


Optimizing Inverter Control Parameters and Thermal Mapping of a Formula SAE Car
Pietro Cipriani, Gianluca Manzi, Matteo Vincelli, and Francesco Giuseppe Quilici
University of Pisa, DESTEC
August 27, 2025
The University of Pisa’s E-Team Squadra Corse initiated a data-driven test campaign to improve performance and reliability in their electric Formula SAE car. The goal was to optimize inverter control parameters and validate the thermal model of the battery system. In collaboration with Dewesoft and Radio6ense, the team gained critical insights into powertrain dynamics and thermal behavior under race conditions using high-frequency data acquisition and RFID-based thermal mapping.
When dealing with complex, black-box systems, fully understanding them is always complicated. Still, when it comes to performance, it is imperative to do everything possible to increase knowledge. In addition, the temperature of the elements in a Formula SAE racing car is always critical, especially when it has to cover 22 km in the shortest possible time.
These needs led to several partners collaborating, including the University of Pisa's E-Team Squadra Corse, Dewesoft, and Radio6ense. Dewesoft's high-frequency, high-precision measurement system and the thermal characterization provided by the innovative SixSense system, developed by Dewesoft and Radio6ense, made it possible to achieve our two objectives:
The E-Team Squadra Corse is the Formula SAE team of the University of Pisa. Composed of more than 100 students from various faculties, the team designs, builds, and develops prototype electric racing cars to compete in international Formula Student events.
Dewesoft is a world leader and benchmark in data acquisition and analysis solutions. Its systems, which integrate modular hardware and intuitive software, ensure accuracy, reliability, and excellent operational flexibility.


Radio6ense is an innovative company that develops advanced technology solutions in
communications, electronics, and automation. The use of radio frequency identification (RFID) technology proved particularly interesting for this application, as it allowed us to implement an advanced monitoring system.
The collaboration between E-Team Squadra Corse and Dewesoft is not a new development. In 2024, a test was conducted with satisfactory results to validate the vehicle's dynamic models and address the issues posed by the powertrain of the team's first electric prototype, EV-A. Specifically, the problem was that once we exceeded a certain power level, the car began to sway longitudinally, followed by a shutdown.
Read the full 2024 story:

Through post-processing data analysis using DewesoftX software, it was possible to identify the causes, which we ultimately attributed to an incorrect parameterization of the motor control system. Following this success, we planned a test campaign for 2025 to improve understanding of the vehicle and its development.
Inverter control and thermal mapping
Working on our new race car, our team’s technical division faced two major critical technical issues:
optimizing the control parameters of commercial inverters, which are not very transparent in terms of operation, and
validating the thermal behavior of the battery pack, which is essential to ensure performance and reliability during the race.
Thanks to Dewesoft's instrumentation and Radio6ense's support, it was possible to make high-resolution measurements of key electrical quantities. These include voltages and currents, as well as thermal quantities at multiple points, allowing for a detailed analysis of the powertrain's operating dynamics under real-world conditions.
Our second electric car, the ET-16, features a rear-wheel drive propulsion system comprising two EMRAX 188 axial-flow electric motors. This results in maximum torque of 100 Nm and a maximum speed of 8,000 rpm, driven by DTI HV-500 inverters. A battery with a capacity of 7 kWh and a maximum voltage of 600 V powers the DC node.
Figure 1 illustrates the car's powertrain.

, DTI HV-500 inverter (in red), and battery (in light blue).")
To achieve both the objectives of optimizing the control parameters and thermal mapping, we divided the test into two parts. Each part is related to the dynamic tests carried out during summer races: Acceleration and Endurance.
The acceleration test takes place on a straight 75 m track, aiming to cover the distance in the shortest possible time from a standing start. Knowing and understanding how the car reacts to changes in the controller parameters makes it possible to minimize this time.
On the other hand, the endurance test is conducted on a mixed track and completed over several laps, covering a total distance of 22 km. The thermal evolution of the most critical elements of the car, as predicted by the models at the team's disposal, enables the creation of customized maps to perform the most crucial dynamic tests more effectively during a race weekend.
Measurement setup
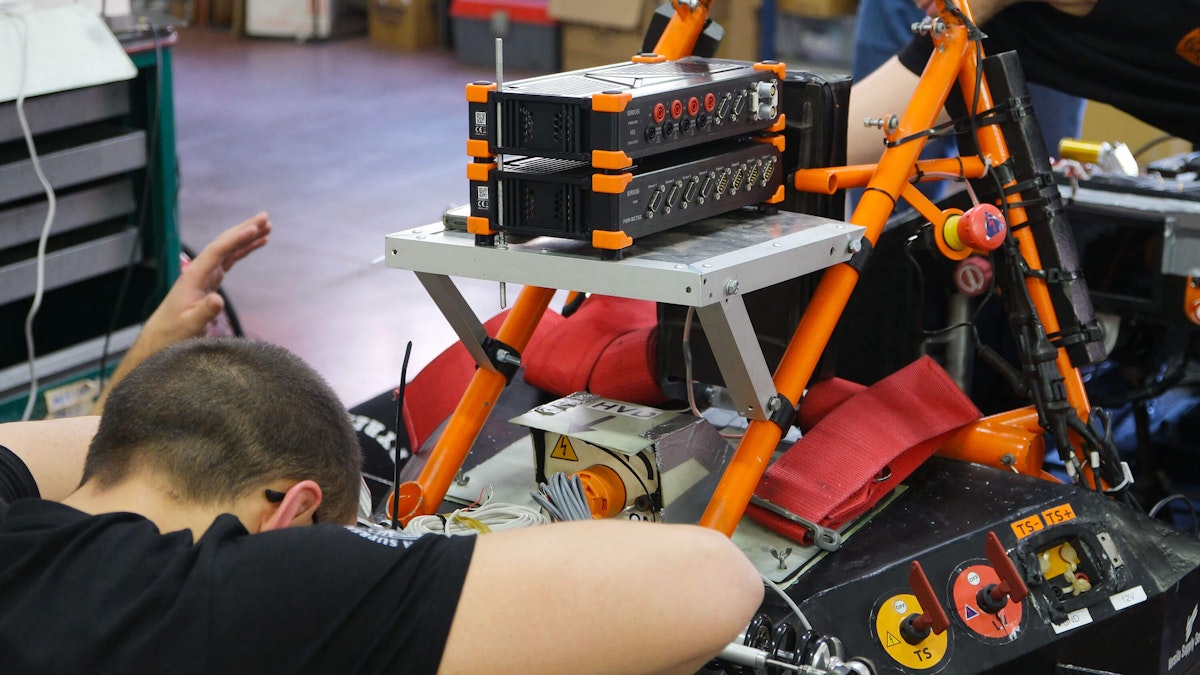
The coordination between the equipment and sensors provided by Dewesoft made it possible to assemble a measurement setup from the many sensors visible in the following images.


The car's low-voltage (LV) battery supplied the onboard power. The electrical quantities measured on the AC side were two currents and three concatenated supply voltages of the left motor and one current of the right motor. In contrast, on the DC side, the voltage and current sensors were installed downstream of the battery.
The sampling frequency of the measured signals was deliberately high, at 800 kHz, to observe all the peculiarities of the car's electrical behavior. We conducted a thermal mapping by installing temperature sensors on various parts of the car's rear. We analyzed four areas in particular: the right wheel, the left wheel, the motors, and the battery (not shown in the image). In total, we used the following devices:
SIRIUS-XHS-4xHV-4xLV - a high-speed data acquisition system (15 MS/s sampling rate per channel) with the new HybridADC signal conditioning technology for.
Three DC-C current transducers - current sensors providing the advantages of a zero-flux current transducer but with lower power consumption and a more compact design.
Current clamps - a high-accuracy sensor for AC/DC measurement and power analysis.
Four high-voltage inputs (direct input on the SIRIUS XHS data acquisition system).
Navion i2 inertial navigation system (INS and IMU) - a compact and rugged inertial navigation system.
PC with DewesoftX software.
4x Receptive antennas.
19x RFID temperature sensors.
Experimental measurement campaign
Our work program for the day of testing on the track was:
Installation runs.
Various "Acceleration" runs.
“Endurance" runs.
The test site was a truck park made available to the team in Buti, about 30 km from Pisa. The tests took place throughout the afternoon, between moments of satisfaction and minor inconveniences, which were promptly resolved by the racing team members.


Acceleration test
The acceleration test aimed to analyze the car's step response and estimate the instantaneous power absorbed by the motors during operation.
With the instrumentation provided, we could derive and see how our motors responded in terms of power to the inputs given by the driver. In particular, as it is a three-wire system, we used some functions of the DewesoftX maths application to calculate the unmeasured missing current as
At this point, it is possible to calculate the instantaneous power as a function of the two directly measured currents and two of the three measured phase-to-phase voltages:
By using phase 2 as a reference, we have used the phase-to-phase voltages and eliminated any error in the calculation of :
We also applied a low-pass filter to zoom in on the acceleration test and help visualize the power. Specifically, we used a Butterworth filter of order 6 with a cutoff frequency of 1.5 kHz.
The power and filtered power plots are shifted by -3π as expected. Interestingly, the instantaneous steady-state power has a frequency component twice as significant as the basic quantities of voltage and current.
The only component converted from electrical power to mechanical power at the shaft is the active power, which is generated only by the harmonic components present in both voltage and current.

.")
We fully characterized one motor by taking two current measurements and took a single measurement on the other. This allowed us to verify that both motors functioned correctly when exposed to the same torque profile.

 and right motor (blue).")
As expected, we see that the two motors have identical waveforms. We verified this by the fact that the two currents are out of phase by an angle of approximately half the period of the waveform itself. The presence of high-frequency noise on the primary signal, which is equally pronounced in the two motors and is related to the switching of the respective inverters, is also evident.
The high-frequency acquisition capability of the Dewesoft systems made it possible to detect and distinguish the contribution of the switching noise. This provides valuable data for optimizing the control parameters of the inverters and validating the system's dynamic behavior.
Endurance test
Our endurance testing aimed to characterize the car's components in terms of their thermal performance. However, the limited duration of these endurance tests did not reveal any significant temperature increase for most components. However, to validate the battery's thermal model, the focus was on conducting a thorough thermal analysis of this particular battery.


During the acquisition, which served as a reference, we gained insight into how temperatures distribute throughout the various parts of the battery.

, sensor 002F (located at the top of the battery), and sensor 0062 (located at the back of the battery).")
The measured data enabled us to determine experimentally the hottest point on the battery's surface. The image shows a slight increase in temperature during the laps, followed by a final pause during which the temperature begins to fall. Among the sensors present, the rear one recorded the highest temperature, around 27°C, while the top and side sensors recorded a final stint temperature of 24.3°C and 25.4°C, respectively.
From these data we can see that, although the temperature change is limited in such a short time, the pack’s rear gets warmer, followed by the side and top. This observation aligns with our expectations. The arrangement of the modules means that the stack’s rear and sides should experience the highest temperatures, as they receive the strongest heat transfer.
Measurement results
The measurement campaign enabled a detailed analysis of our powertrain's behavior. We used the acceleration test to characterize the step response, while the endurance test validated the battery thermal model.
Acceleration test
The acquisitions made it possible to derive the step response of the converter and motor system in terms of the quadrature current Iq. The latter is a transformed quantity using the Park transform, which helps understand the behavior of electrical machines.
The transform also provides the components of the direct axis (d-axis) and the z-axis. Still, in the case of constant torque mode, a feedback controller keeps the direct component at zero, and the z-component is negligible for studying machine dynamics. We also applied a low-pass filter to the quadrature current to reduce the measurement noise.
The step response is interesting because all system frequencies are excited, allowing its behavior to be studied. A 3% settling time, i.e. the time it takes for the response to finally move within a band that deviates ±3% from the steady-state value, was found to be 97.03 [ms] and a percentage overshoot, i.e. the difference between the maximum value reached by the output and the final value, was found to be 1.949%.
The graph shows the response and the generated input as a reference for the converter controller. As the input signal is driven by the driver and not digital, it is normal to see a trend with a non-instantaneous rising edge.


We based our previous considerations on the most recent parametric controller configuration. During the test day, we conducted several trials to determine the optimal parameters from both the car's and the pilot's perspectives. Post-processing analysis then enabled the selection of the optimal configuration based on the experimental evidence presented.
| Acceleration test results - search for optimal controller parameters | |||||
| Controller parameters | Trials | ||||
|
1 |
2 |
3 |
4 |
5 |
|
| Kp |
0.5 |
3 |
1 |
0.7 |
0.5 |
| Ki |
100 |
100 |
100 |
150 |
150 |
| Comments |
Initial configuration |
The car "whistles" |
Optimal configuration |
Worse than trial 3 |
Slow response |
Endurance test
Before comparing the experimental and simulated measurements, we provide a brief description of the electrothermal battery model construction.
Due to the dynamic nature of the estimate we have to obtain, the approach used is that of equivalent circuit modelling, i.e., receiving the voltage and temperature estimates of the different parts of the battery by using equivalent circuit elements such as electrical and thermal resistances and capacitances. Figure 11 shows a schematic of the mentioned circuits used as a reference.

 and thermal (b) equivalent circuits were adopted for the electrothermal battery model.")
Specifically, we adopted the 1-block R-C model for the electrical mode. This model is capable of reproducing the dynamic voltage behavior when the system is subject to a given current. In contrast, we always adopted a first-order system consisting of the heat capacity and thermal resistance of the modelled objects for the thermal model.
We obtained the electrical circuit parameters through experimental laboratory tests, while estimating the thermal parameters based on the geometry of the battery pack. Initially, we defined both circuits at the cell level. Due to the inherent modularity of the storage system, we can achieve the transition from the cell level to the pack level of the electrical circuit by simply scaling the parameters.
In contrast, we cannot do this without making assumptions about the thermal circuit.
It is precisely based on this fact that the test allowed us to assess the veracity of the assumptions, as the transition from cell to stack is always very sensitive in the thermal model. Figure 12 shows the model developed in the Modelica environment, accompanied by explanatory images of the elements we modelled.
The input to the model is the battery current measured during the test. Due to the existing symmetries, we modelled each module with a quarter of the existing elements (cells). Each group of cells communicates electrically and thermally with the others thanks to the network in the model (connections in blue and red).
An additional layer, not present in the model image, relates to the thickness of the aluminum present, on which we carried out the validation, as we placed the RFID temperature sensors on the external surfaces of the house.


The comparison between the experimental measurements and the temperatures predicted by the model revealed the following trends:


A contrasting behavior is evident in the results obtained. As seen from the acquisition of sensor 0045, there was no signal during the whole stint, while during the break, the model responded well to the temperature prediction.
Even for sensor 0062, located on the back of the battery, the model appears to predict the recorded temperature accurately. However, for sensor 002F, the one located on top of the battery, the model overestimates the proper temperature by approximately 2-3°C, a symptom of slightly worse parameterization in this area.
On the other hand, the results obtained by the model for estimating the surface temperature of the pack are satisfactory. They allowed us to place more value on evaluating the temperature of the cells, which are the hottest part of the battery.
Conclusion
The test, conducted in collaboration with Dewesoft and Radio6ense, enhanced our understanding of the car from both electrical and thermal perspectives. The data obtained during testing allowed us to validate the developed models and accurately characterize the step response of the E-Team Squadra Corse car, a critical step in optimizing motor controller parameters.
Additionally, the successful use of RFID-based thermal mapping demonstrated a reliable approach to tracking and validating battery behavior under dynamic load conditions. These insights are not only essential for improving the ET-16 prototype but also serve as a foundation for future vehicle iterations, helping ensure greater performance, safety, and efficiency on the track.
The E-Team Squadra Corse would like to thank Dewesoft, particularly Davide Carniani and Marco Ribichini, for the opportunity offered and their support throughout the test organization, from the instrumentation provided to the analysis of the results.
We also extend gratitude to Radio6ense, and especially Francesco Lestini, for their support with RFID technology. It proved highly effective even in real-world race simulations. The collaboration marks a key step forward in the team’s journey toward engineering excellence and competitive success in Formula Student competitions.