


Energy Consumption Test of an Electric Motorcycle

Rupert Schwarz & Daren Bezuidenhout
October 28, 2020
Analyzing vehicles under real-life driving conditions is the future of electric vehicle testing. The innovative data acquisition solution from Dewesoft allows doing all analyses during the real-life drive test measurement as well as in post-processing. In this case, the efficiency measurement of an electric two-wheeler (such as an electric scooter, electric bike, or electric motorcycle) with the Dewesoft Power Analyzer will be presented.
Standardized driving cycles such as:
NEDC (New European Driving Cycle)
WLTP (Worldwide harmonized Light-Duty vehicles test procedure),
WMTC (World Motorcycle Test Cycle),
etc.
are not suited to measuring the true energy consumption of electric vehicles. These tests usually purely test bench orientated and such testing doesn’t consider all the aspects influencing the power consumption of an electric vehicle.
Standard test driving cycles
The NEDC testing standard has been around since the 1980s and has only undergone minor changes over the years. This caused this testing procedure to become outdated. This mainly happened due to the quick advances that were made in automotive technology. Vehicles became lighter and faster over the years and this was the standard testing procedure for drive cycles.
So it was decided to integrate a new testing procedure, the WLPT. It was aimed to deliver more realistic figures than that of the NEDC, aiming to closer reproduce real drive tests on the test bench.
This testing procedure has been in discussion for quite a while, more concretely since 2008, and it was expected to be implemented by 2023. This was not the case as the diesel gate scandal sped up the process quite a bit. Due to the scandal, the regulators decided that this testing procedure should become mandatory in the European Union as of the 1st of September 2018.
Both the NEDC and the WLPT are carried out in a laboratory under predetermined conditions. Whereas the WLTP has a few different testing procedures compared to the NEDC. It implements a higher level of acceleration and deceleration and the average driving speeds as well as the maximum driving speeds were also increased.
Gear shifting was also altered from a set-point gear-shifting procedure to a more random gear-shifting pattern. The number of driving cycles was increased from 3 in the NEDC to 5 in the WLTP.
There is a slight problem in the whole equation though, these standardized tests were aimed at being universal and implemented worldwide, but this is not the case. There are countries outside of the European Union that still use the NEDC for standardized drive cycle testing, as well as countries that use their own standardized drive cycle test procedures.
Then there are also differences in the WLPT test itself in different countries where the test is adapted to country-specific needs. Be it lower average speeds, or varying temperatures that were recalculated to account for either lower or higher average temperatures specific to the country that is performing the tests among others.
Similarly to the two tests that were described above the WMTC was implemented for motorcycles. These tests were also developed to standardize the consumption and range of motorcycles. These tests are also only done in a laboratory on a rolling test bench.
This inherently means that the driving cycles are designed to represent typical driving conditions, which do not take into account the dynamic changes that occur during a real drive scenario. There is also the chance of result tampering in these types of tests.
Furthermore, as this test is seen as a global standard it does not take into account the differences in ambient conditions such:
temperatures,
different road surfaces,
altitudes,
driver behaviour, and
a whole range of other aspects that have to be taken into account to represent a real drive test.
The energy consumption of an electric vehicle is dependent on an array of factors as mentioned above. These are very hard to simulate on a test bench as real-world conditions vary greatly, and can change quickly. The energy efficiency and therefore the energy consumption greatly impacts the benefits of driving an electric vehicle over other types of propulsion. And of course one of the most important aspects of an electric vehicle is the true range of the vehicle.
This question of the true range is very important as in some countries the charging infrastructure has not been expanded as much as it has been in other countries. Evaluating all the parameters required to deliver a real drive test that has all the relevant information to predicate the actual performance that the vehicle can deliver is therefore a difficult task.
To achieve this, an array of data acquisition equipment is usually required. These must measure the different signals needed for a concrete test result. More equipment means an increase in weight, cabling, and space requirement. This is especially difficult on a motorcycle where space is limited. This changes the requirements for measurement systems.
Check out Dewesoft's modern, digital data acquisition systems


On the hardware side, instruments have to suit the High Voltage environments and be able to withstand harsh environments, as well as be compact enough to take on a real drive test.
On the software side, the synchronous data acquisition of different signals be it electrical, mechanical, GPS, vibration, or video among others. Then there is a need for powerful data processing both during the measurement and in post-processing making use of the full spectrum of raw data.
Importance of the application
Measuring electric vehicles under real driving conditions is becoming more and more popular and requires a mobile and extremely powerful measurement system. This is mainly because test bench simulated drive cycles cannot replace the integral data that is received from a real drive test. In order to do these types of measurements on electric 2-wheelers, an extra compact measurement system is required due to the constraints on space.
The measurement system also needs to be able to power the measurement sensors directly. Dewesoft has the perfect solution for this application, namely the Dewesoft power analyzer product line.
The power analyzer module supports the measurement of any kind of electric motor (1-12 phase) as well as inverter measurements (DC-AC, AC-AC, DC-DC with switching frequencies up to some 100 kHz).
The battery as the central element in the electrical powertrain strongly affects the performance and range of electric vehicles. Extensive tests are necessary, starting from the cell characteristics up to the complete powertrain performance.
There are many other influences that can affect the energy consumption of electric vehicles. These influences can be ambient conditions such as temperature, weather, quality of the road, or different driving situations (uphill, downhill, city, overland, or combined drives), or different drive styles of individual drivers. The Dewesoft Power Analyzer can measure energy and do energy analysis considering all these influences during the real drive tests.
Learn more:
")


The real-drive measurements
For this measurement a SIRIUS High-Speed Data acquisition (DAQ) device was chosen, it has 1 MS/s sampling rate and 2 MHz bandwidth. Furthermore, a battery pack complete with hot-swappable batteries was used to power all the measurement equipment including the sensors. This means that no auxiliary power is needed from the vehicle itself ensuring that the measurement is completely true.


he SIRIUS DAQ device selected for the electrical measurement has 4 x high voltage and 4 x low voltage signal amplifiers. This ensures that the 3-phase motor and the power delivery system (lithium-ion battery) can be measured simultaneously.
The alternate current (AC) voltages were measured using a Dewesoft Starpoint adapter, and for the current measurements, four DS-CLAMP-150DC were chosen.


To ensure that the measurement was as comprehensive as possible a second custom SIRIUS-isolated DAQ device was added, this module was outfitted with an acceleration sensor and an RPM sensor. For the actual data acquisition and storage, the compact SBOXe PC and data logger in a SIRIUS chassis were used. It features a powerful Intel Core i7 processor, with a built-in SSD for ultra-fast measurement data storage and analysis.


An inertial measurement unit (IMU) which includes a GPS receiver (DS-IMU1) and a webcam was connected to the SBOX. The three SIRIUS DAQ devices are connected to each other with sync cables ensuring absolute synchronous measurements and data acquisition regardless of the signals that were measured.


Measurement equipment and setup
The entire onboard data acquisition system included the following devices and software:
Data acquisition system
SIRIUSi - HS 4xHV, 4xLV (Standard)
SIRIUSi - ACC, ACC+ (Custom)
SIRIUSi SBOXe
Battery Pack DS BP2i
Sensors and transducers
4x DS-CLAMP-150DC
Starpoint adapter
DS - IMU1
Accelerometer
RPM Sensor
USB - Camera
DAQ software:
Additional software licenses:
POWER Analyzer Plugin
DSA Upgrade


Measurement results
The powerful software functionality of the Dewesoft Power Analyzer allows for a comprehensive and detailed analysis of any measurement situation. The combination of multiple instruments, such as:
Power Analyzer,
Spectrum Analyzer,
Scope,
Digital displays, and
Data Logger
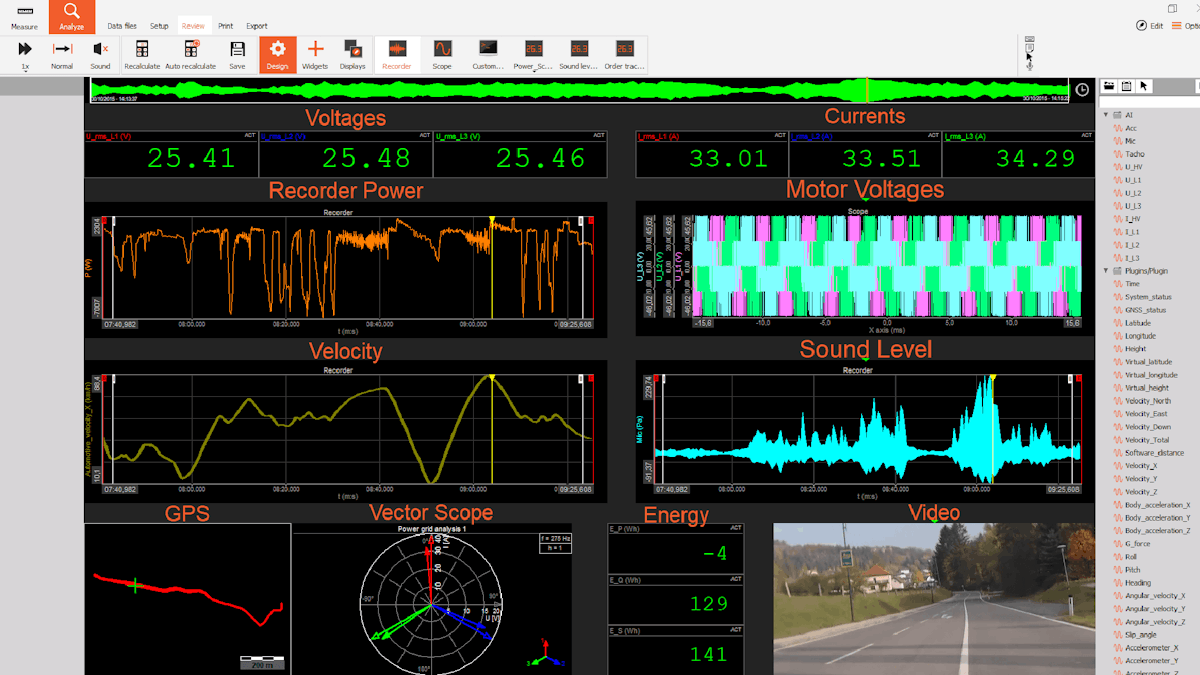
allows for an unmatched testing experience. The following image depicts a screenshot of the DewesoftX measurement software during the measurement.


Recorder: The Recorder window in the top left of the image shows the Power flow (orange), and the Frequency (Red) during the test drive.
Scope: The Scope visualization in the top right shows the three AC motor voltages (magenta, green, and turquoise). Further zooming allows analysis of each pulse of the PWM modulated signal individually.
FFT: The FFT chart on the bottom right of the image shows the FFT of the motor voltage and current. The switching frequency can easily be seen as well as the harmonic components and the moving of the fundamental frequency.
GPS: The graph on the bottom middle of the image depicts the GPS information of the test drive.
Vectorscope: In the vectorscope Voltages and Currents are shown depending on their phase angle. Furthermore, the math library in the software allows for the calculation of efficiency factors, recuperation rate, etc. during the actual measurement.
Digital Meters: The energy calculation for total, positive or negative energy is automatically done by the software and allows fast analysis of used and recuperated energy.
Video: The completely synchronized acquisition of video allows detailed analysis for each measurement situation. The replay functionality of the software makes the analysis easier.
Out of the measured data, various analyses can be performed. The following table shows some exemplary results of efficiency analysis.
Energy Flow diagram


Determining factors which influence the energy consumption


Benchmark comparison with other vehicles


Charging process (single charge)

")
Detailed analysis of special cases


Analysis of different driver behaviour and test tracks


Order tracking analysis

Conclusion
Standardized drive cycle tests on electric vehicles give an indication of the performance that can be expected from such a vehicle. But it does not deliver the deep-seated information on the true performance that a real drive test can yield.
Dewesoft on the other hand offers a compact power analyzer solution that is able to measure an array of different parameters simultaneously and perfectly synchronized with each other. This will deliver all the data necessary to do a comprehensive real-drive test that will deliver the exact performance that you can expect from an electric vehicle.
The Dewesoft power analyzer offers combined electric motor and inverter testing solutions that allow the measurement of a high number of voltage and current input channels. The number of channels is almost infinite due to the modular design of the Dewesoft hardware. It is possible to measure up to eight 3-phase systems along with temperature, vibration, RPM, torque, CAN, video, etc. with a single device completely synchronized.
Dewesoft DAQ devices are unique due to the powerful software which combines the functionality of multiple devices packed into a compact, flexible, and rugged hardware chassis. Therefore, it can also be used to do measurement limited-space space vehicles such as electric 2-wheelers and other smaller electric vehicles under real driving conditions.
All these features provide a comprehensive power analysis system within one measurement device. No more complications with data synchronization, visualization, storage, or data comparison. The Dewesoft power analyzer can do it all.
Learn more:

