


Data Acquisition (DAQ) - The Ultimate Guide [Updated 2026]

March 25, 2026
In this article we will learn everything about Data Acquisition (DAQ), describing it in enough detail that you will:
See what data acquisition (DAQ) is
Learn about the key data acquisition system features and capabilities
Understand how data acquisition is used today, and most important why
Are you ready to get started? Let’s go!
What is data acquisition (DAQ)?
Data acquisition (commonly abbreviated as DAQ or DAS) is the process of sampling signals that measure real-world physical phenomena and converting them into a digital form that can be manipulated by a computer and software.
Data Acquisition is generally accepted to be distinct from earlier forms of recording to tape recorders or paper charts. Unlike those methods, the signals are converted from the analog domain to the digital domain and then recorded to a digital medium such as ROM, flash media, or hard disk drives.
What is a data acquisition system?
A data acquisition system is a system that includes measurement devices, sensors, a computer, and data acquisition software. A data acquisition system is used for acquiring, storing, visualizing, and processing data. This involves collecting the information required to understand electrical or physical phenomena.
There are several types of data acquisition systems. It can be a handheld device for simple temperature measurement or a big multi-thousand channel system installed in several racks and remotely operated. Jump to section types of data acquisition systems to learn more about basic types of data acquisition systems.
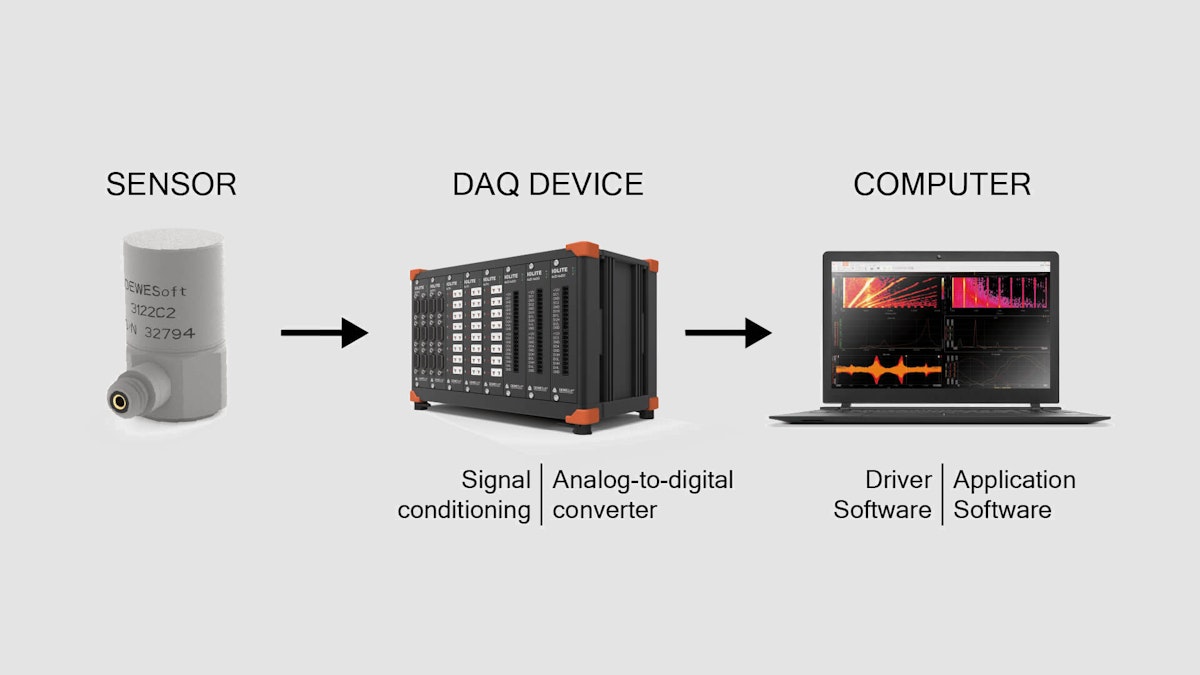
Components of a data acquisition system
Modern digital data acquisition systems consist of four essential components that form the entire measurement chain of physics phenomena:
Sensors
Signal Conditioning
Analog-to-Digital Converter
Computer with DAQ software for data logging and analysis


The typical data acquisition system has multiple channels of signal conditioning circuitry which provide the interface between external sensors and the A/D conversion subsystem.
Learn more:


What does a data acquisition system measure?
Data acquisition systems are principally in the business of measuring physical phenomena such as:
Temperature
Voltage
Current
Strain and Pressure
Shock and Vibration
Distance and Displacement
RPM, Angle, and Discrete Events
Weight
Note that there are several other measures, including light and images, sound, mass, position, speed, etc. that can be measured by the data acquisition system.
Check the modern Dewesoft digital data acquisition systems
Dewesoft provides easy-to-use modern and modular digital data acquisition systems. Systems are designed to be easy to use yet you can use them for the most demanding test and measurement applications. Dewesoft DAQs offer an industry-leading 7-year warranty.
The purposes of data acquisition
The primary purpose of a data acquisition system is to acquire and store the data. But they are also intended to provide real-time and post-recording visualization and analysis of the data. Furthermore, most data acquisition systems have some analytical and report generation capability built in.
A recent innovation is the combination of data acquisition and control, where a high-quality DAQ system is connected tightly and synchronized with a real-time control system. You can read more about this topic in the related article: “Merging Data Acquisition with a Real-Time Control System”.
Engineers in different applications have various requirements, of course, but these key capabilities are present in varying proportions:
Data recording
Data storing
Real-time data visualization
Post-recording data review
Data analysis using various mathematical and statistical calculations
Report generation
Data acquisition instrumentation is also heavily used in monitoring applications. Such examples are:
Monitor the condition of complex machinery such as generators, motors, fans, etc.
Monitor structural properties of buildings such as bridges, stadiums, etc.
Monitor energy consumption and energy efficiency in the production process.
And many other monitoring scenarios.
Learn more:


Importance of data acquisition systems
Data acquisition systems or DAQ devices are essential in the testing of products, from automobiles to medical devices - basically, any electromechanical device that people use.
Before data acquisition, products were tested in an unstructured, highly subjective manner. For example, when testing a new suspension in an automobile, engineers often relied on the opinions of test drivers as to how the suspension “felt” to them.
With the invention and development of data acquisition systems, which could collect data from a wide variety of sensors, these kinds of subjective opinions were replaced with objective measurements. These could easily be repeated, compared, analyzed mathematically, and visualized in many ways.
Today, no one would consider making any kind of vehicle, large or small, aircraft, medical devices, large-scale machinery, etc without employing data acquisition to objectively measure their performance, safety, and reliability.
Learn more about Dewesoft data acquisition technology:

Basic types of data acquisition systems
Today's data acquisition systems come in many forms and flavors:
Handheld data acquisition systems
Portable data acquisition systems (with a built-in computer, storage, and display)
Modular data acquisition systems
Rack-mountable data acquisition system
Etc.
There are many data acquisition systems to choose from that suit certain applications. To learn about different types of data acquisition systems please check the following article:

The measurement process
Data acquisition is the process of converting real-world signals to the digital domain for display, storage, and analysis. Because physical phenomena exist in the analog domain, i.e., the physical world that we live in, they must be first measured there and then converted to the digital domain.
This process is done using a variety of sensors and signal-conditioning circuitry. The outputs are sampled by analog-to-digital converters (ADCs) and then written in a time-based stream to a digital memory media, as mentioned above. We usually call such systems the measurement systems.


Let’s look at each of these elements in the chain in more detail.
Sensors or transducers
The measurement of a physical phenomenon, such as the temperature, the level of a sound source, or the vibration occurring from constant motion, begins with a sensor. A sensor is also called a transducer. A sensor converts a physical phenomenon into a measurable electrical signal.
Sensors are used in our everyday lives. For example, the common mercury thermometer is a very old type of sensor used for measuring temperature. Using colored mercury in a closed tube, relies on the fact that this chemical has a consistent and linear reaction to changes in temperature. By marking the tube with temperature values, we can look at the thermometer and see what the temperature is with limited precision.


Of course, there is no analog output other than the visual one. This kind of primitive thermometer, while useful in the oven, or outside the kitchen window, is not particularly useful for data acquisition applications.
So other types of sensors have been invented to measure temperatures, such as thermocouples, thermistors, RTDs (Resistance Temperature Detectors), and even infrared temperature detectors. Millions of these sensors are at work every day in all manner of applications, from the engine temperature shown on our automobile dashboard, to the temperatures measured in pharmaceutical manufacturing. Virtually every industry utilizes temperature measurement in some way.


Of course, there are many other types of sensors that have been invented to measure another physical phenomenon:
Load cells: for measuring weight and load
LVDT sensors: LVDTs are used to measure displacement in distance
Accelerometers: measuring vibration and shock
Microphones: for measuring sound,
Strain gauges: to measure strain on an object, e.g. measure force, pressure, tension, weight, etc.,
Current transducers: for measuring AC or DC current,
and countless more.
Depending on the type of sensor, its electrical output can be a voltage, current, resistance, or another electrical attribute that varies over time. The output of these analog sensors is typically connected to the input of a signal conditioner, which we will discuss in the next section.
Learn more about sensors:


Signal conditioners
Signal conditioners are in the business of taking the output from analog sensors and preparing them to be sampled digitally.
If we continue the example of the thermocouple. The signal conditioning circuitry needs to linearize the output from the sensor as well as provide isolation, and amplification to bring the very small voltage up to a nominal level for digitizing.


Each signal conditioning circuitry is designed by the manufacturer to perform the elemental normalizing of the sensor output to ensure its linearity and fidelity to the source phenomena, and prepare it for digitizing. And since every sensor type is different, the signal conditioners must conform perfectly to them.
Learn more about signal conditioning:
Isolation barriers (galvanic isolation)
Sometimes also referred to as galvanic isolation, electrical isolation is the separation of a circuit from other sources of electrical potential. This is especially important with measuring systems because most signals exist at relatively low levels, and external electrical potentials can influence the signal quality greatly, resulting in wrong readings. Interfering potentials can be both AC and DC in nature.
For example, when a sensor is placed directly on an article under test, (e.g. a power supply) which has potential above ground (i.e., not at 0V), this can impose a DC offset on the signal of hundreds of volts. Electrical interference or noise can also take the form of AC signals created by other electrical components in the signal path or in the environment around the test. For example, fluorescent lights in the room can radiate 400Hz which can be picked up by very sensitive sensors.
This is why the best data acquisition systems have isolated inputs - to preserve the integrity of the signal chain and ensure that what the sensor outputs is truly what has been read. There are several kinds of isolation techniques employed today.
Learn more about galvanic isolation:


Filtering
Virtually every signal that we want to measure can be affected by electrical interference or noise. This has a variety of causes, including ambient electromagnetic fields which can be induced into high gain signal lines, or simple voltage potentials that exist between the sensor or measuring system and the object under test. Therefore, the best signal conditioning systems provide selectable filtering that the engineer can use in order to remove these interferences and make better measurements.


Filters are normally expressed in terms of the band that they operate upon. There are four basic types of signal filters:
Low-pass filter: this filter reduces or “rolls off” starting at a given frequency and those above it.
High-pass filter: does the opposite and allows frequencies to pass which are above a given frequency.
Band-pass and band-reject filters: either pass or stop (reject) frequencies between two given values.


Some filtering, such as anti-aliasing filtering, can only be done in the analog domain. This is because once a false signal caused by under-sampling has been digitized, there is no way to know what the real signal looked like anymore. However, nearly all other filtering can be done in the digital domain, i.e., in software, after the signal has been digitized.
Filters are also defined by how many poles they have. The more poles, the steeper the roll-off they are capable of performing on the signal. This roll-off or slope simply means how many decibels of the signal can be rolled off per octave. The specification of the filter in question will typically give the maximum roll-off in dB/Q.
Dewesoft DAQ hardware typically provides low-pass filtering as required by the types of signals being measured. Some conditioners additionally provide high-pass filtering, for example, CHARGE signal amplifiers. Removing unwanted low-frequency elements is especially critical if the measured signal will be integrated or double-integrated, as unwanted elements would badly distort the derived speed or displacement values.
You will also hear of filter types such as Bessel, Butterworth, Elliptic, and Chebyshev to name just a few. Because all filters impose distortions onto the signal itself due to their very nature, engineers over the years have developed their own filtering types in order to provide the best possible results for their specific purposes.
| Filter Type | Roll-off Steepness | Ripple or Distortion | Other Factors |
|---|---|---|---|
| Butterworth | Good | No ripple, but square waves cause distortion (hysteresis) | Moderate phase distortion |
| Chebyshev | Steeper | Ripples in the pass-band | Poor transient response |
| Bessel | Good | No ringing or overshoot from non-sinus waveforms | Increased phase delay |
| Elliptic | Steepest | Ripples in the pass-band | Non-linear phase response |
DewesoftX DAQ software provides a broad palette of user-selectable filtering options, including all of the ones mentioned above and more. It is interesting to note that software filters can be applied after measurement - and even removed or modified after measurement. This provides the engineer with many tools by which to analyze their data non-destructively.


Using DewesoftX software, engineers can record their data without filtering, and then apply various filters after recording and experimenting, even doing side-by-side comparisons with the original signal. This flexibility is a powerful analysis tool and extremely easy to implement. It preserves the raw, unfiltered data and simultaneously allows the engineer to apply filters as needed, creating a different data set for analytical or presentation purposes.
Analog-to-digital converters (ADCs or AD converters)
The output of most physical measurement signal conditions is an analog signal. It is necessary to convert this signal to a series of high-speed digital values so that it can be displayed and stored by the data acquisition system. As such, an A/D card or A/D subsystem is used to convert this signal.

There are a variety of ADC types, including both multiplexed and single converters per channel. In a multiplexed ADC system, a single analog-to-digital converter is used to convert multiple signals from the analog to the digital domain. This is done by multiplexing the analog signals one at a time into the ADC.
This is a lower-cost approach compared to having an ADC chip per channel. But on the other hand, it is not possible to precisely align the signals on the time axis, because only one signal can ever be converted at a time. Therefore, there is always a time skew between channels.
In the early days of data acquisition, 8-bit ADCs were common. As of this writing, 24-bit ADCs are standard among most data acquisition systems designed to make dynamic measurements, and 16-bit ADCs are commonly considered the bare minimum resolution for signals in general.
The rate at which the signals are converted is called the sample rate. Certain applications, such as most temperature measurements, do not require a high rate since the measurements do not change very rapidly. However, AC voltages and currents, shock and vibration, and many other measurands require sample rates in the tens or hundreds of thousands of samples per second or more. The sample rate is considered the T or X-axis of measurement.


On the Y or vertical axis, ADCs are available with various resolutions. The most common today are 16-bit and 24-bit. An ADC with a 16-bit resolution can theoretically digitize an incoming signal with a resolution of one part in 65,535 (2^16 = 65,536).
This number is actually reduced by noise and quantization error among other factors, but it provides a good starting point for comparison. Because each bit of resolution effectively doubles the quantization resolution, systems with 24-bit ADCs provide 2^24 = 16,777,216. Thus, an incoming one-volt signal can be divided into more than 16 million steps on the Y-axis.
ADCs which offer high sample rates and high amplitude axis resolution are optimal for dynamic signal analysis such as shock and vibration. Low sample rates and high amplitude axis resolution are optimal for thermocouples and other measurands which have a wide amplitude range but which do not change state rapidly.
ADCs which provide anti-aliasing filtering (AAF) is highly desirable in all applications involving dynamic measurements because they prevent measuring errors caused by sampling a signal at a too-low rate. This aliasing is when a false signal is created by sampling too infrequently for a fast-changing signal.
Once converted to digital, our signals (aka measurands) are processed by the computer subsystem in several ways. First and foremost they can be displayed to the test operator on the system’s screen for visual inspection and review. Most DAQ systems show the data in several popular formats, including a time-history aka “strip chart” (Y/T) display, as well as a numerical display. But other display types are available from many systems on the market today, including bar graphs, X-Y graphs, and more.
Learn more about A/D converters:

Data storage
Today’s data acquisition systems typically utilize a solid-state hard disk drive (SSD or HDD) to stream data from the ADC subsystem to permanent storage. Writing the data to disk also allows it to be analyzed after the test is completed.
Most DAQ systems allow the data to be exported to different file formats for analysis using third-party software tools. Common data formats include CSV (Comma Separated Values), UNV (Universal File Format), and more.
DewesoftX data acquisition software which is included for free with our modular data acquisition systems are able to export data to both formats plus many others. See the complete list of supported file export formats.


Data visualisation and display
One of the most critical functions of any DAQ system is the ability to visualize the data in real-time during data storage. Systems typically employ an integrated or separate flat-screen display, which can be configured in a variety of visual formats.
Waveform data can almost always be displayed as Y/T waveforms against a graph or grid, and in numeric form. But other graphical conventions can be employed in addition, such as bar graph meters, FFT (Fast Fourier Transform) frequency/magnitude graphs, and more.
Today’s most flexible DAQ systems allow the user to configure one or more displays freely using built-in graphical widgets in an easy manner. DewesoftX software offers several high-quality built-in visual instruments:
Recorders: horizontal, vertical, and XY recorder
Oscilloscope: scope, scope 3D, vectorscope
FFT: FFT, 3D FFT, Harmonic FFT, and Octave
Meters: digital, analog, horizontal/vertical bar meters
Graphs: 2D, 3D graph, Octave, Orbit, Campbell plot
Video: standard video display and thermal video display with temperature indicators
GPS: positioning display with interactive Open Street Map layering support
Control: button, switch, knob, slider, user input
Combustion analysis: P-V diagram and combustion scope
Rotor balancer: for field balancing
Automotive: 3D polygon for displaying moving objects
Aerospace: altitude or artificial horizon indicator
DSA/NVH: Modal circle
Other: 2D/3D table, image, text, line, overload indicator, indicator lamp, note
All visual instrument offers different customization options with real-time visual feedback.
Data analysis
Data acquisition systems provide an important visual reference to the state of the test in real time. But after it has been stored in the DAQ system, the data can also be analyzed using tools either built into the DAQ system or third-party data analysis software.
As mentioned earlier, nearly every DAQ system on the market today has several built-in data export filters that convert the system’s proprietary data format to third-party data formats for offline analysis.


Data acquisition system price
Data acquisition systems are sold by a variety of companies and are available with a broad range of capabilities and specifications, thus the prices can vary significantly. It is useful to provide general pricing for these various levels of DAQ systems, using the price-per-channel model. Estimated prices are given in USD (US dollars):
Low-end DAQ systems typically range from $200 - 500 per channel.
Mid-range DAQ systems typically range from $500-1000 per channel.
High-end DAQ systems typically range from $1000-2000 per channel.
Do-it-yourself DAQ systems are impossible to estimate because they cover a wide span from a few channels to a system that took 10 man-years to develop and/or which involves hundreds or even thousands of channels.
Refer to The complete list of data acquisition companies guide for the up-to-date list of the data acquisition companies.
The Data Acquisition Future
The future of data acquisition is promising and continuously evolving, driven by rapid technological advancements. One such example is the open data acquisition standard called OpenDAQ. OpenDAQ is a joint venture of two big data acquisition vendors - Dewesoft and HBK.
OpenDAQ is an SDK and is aimed to finally standardize the data protocols used in the DAQ systems. The standard defines protocols and interfaces that data acquisition vendors can implement in their hardware and software making it easier for users to integrate different data acquisition devices into their workflow.
The OpenDAQ is currently in public beta and will be fully released later in 2024.
In summary, the future of data acquisition is bright, filled with innovation that will profoundly impact society and business operations. It will be characterized by faster, more efficient, and more ethical data collection methods, powered by advanced technologies and driven by the need for deeper, real-time insights.