


Dynamic Measurements on Suspension Bridges

The Southern Highway, Carretera Austral, is the lifeline of southern Chile’s Aysén region. Chile’s Ministry of Public Works hires private companies to inspect, test, and verify the designs of its engineering structures.
HochBau was charged to do dynamic measurements during load tests on two hanging bridges on the highway. The environmental conditions, the structural designs, and the time pressure were challenging but IOLITE 3xMEMS-ACC offered a practical and cost-effective solution. A series of these low-noise triaxial MEMS accelerometers carrying data and power through one and the same ethernet cable did the job.
Finis Terrae - a road to the end of the world
The Carretera Austral, which loosely translates as Southern Highway, is the backbone infrastructure of southern Chile’s Aysén region. Known for its spectacular landscapes and particularly harsh climate, it’s a major tourist attraction for international and local adventurers.
The highway runs south from Puerto Montt to Villa O'Higgins for about 1,240 kilometers, passing through rural Patagonia. These areas are sparsely populated, and yet, without the Carretera, its residents wouldn’t have land connectivity with the north of the country.
Furthermore, its eventful rugged geography and large rivers - which actually bring water all year round, unlike the northern “rivers” of Chile - force the Carretera to have large hanging or suspension bridges over rivers and ferries in larger fjords.

.")
Most of the infrastructure of the Carretera Austral was built or enlarged in the 1990s. Hence, thorough inspection and analysis were due. To assess the current condition of the main hanging bridges of the Aysén region, the Ministry of Public Works (MOP) is hiring private companies, through public biddings, to inspect, test, and verify their designs.
Under this scheme, MOP entrusted the large road construction company R&Q with the assessment of the Palena and Rosselot bridges close to the town of La Junta. In turn, R&Q hired COWI for the structural design assessment, MRH for the inspection, and HochBau for the dynamic measurements during load tests.
The hanging bridges
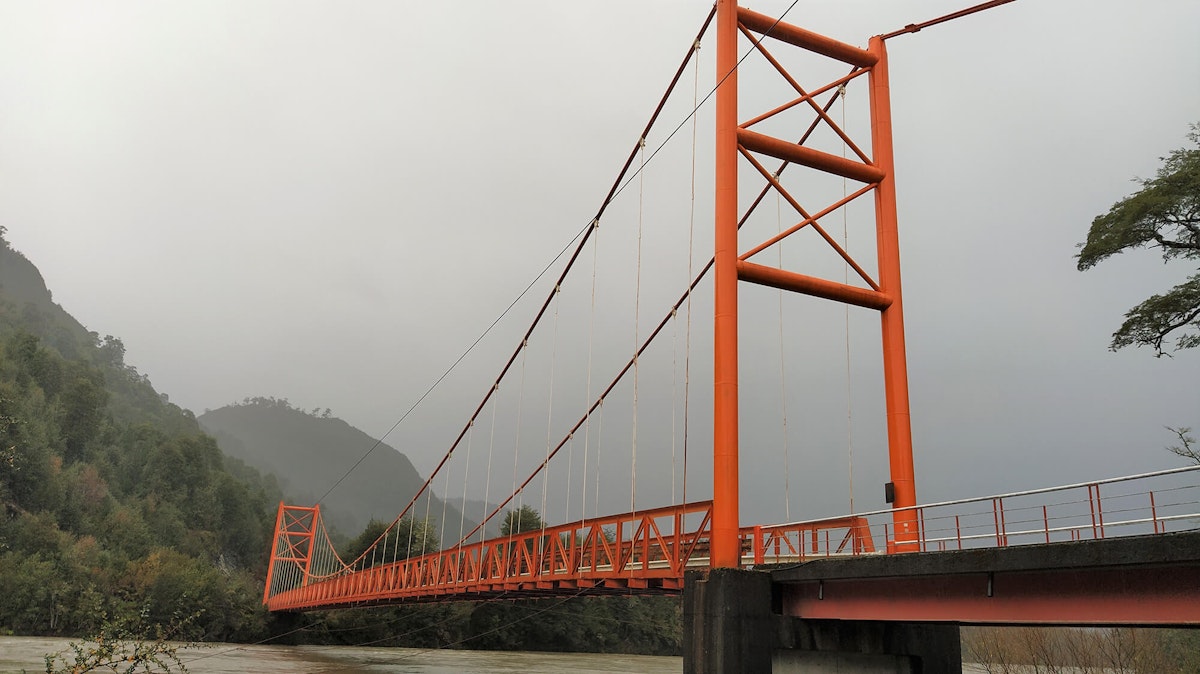
The Palena and Rosselot are suspension bridges, with free long spans of 150 m and 130 m respectively, and have two metallic towers, which support the cables. Their reinforced concrete bridge decks are supported by vertical rods which hang from the main cables. The decks are stiffened by two 2,1 m high lateral metallic trusses.
The inspection works discovered several fractures near connections of the stiffener trusses and several other defects. Furthermore, unlike most hanging bridges, the decks have several expansion joints along their span, which are uneven and their edges are worn-out.


As part of the load tests which were carried out on the bridges, HochBau was hired to measure the dynamic response of the bridges. The load tests were carried out with a 23-ton three axel load truck.

Three load tests were defined:
Static Load Test: The truck is parked at ¼, ½, and ¾ of the bridge span, and the deflection of the bridges is measured with an engineering level.
Dynamic Load Test: The truck passes the bridge in both directions at 5 km/h, 15 km/h, and 25 km/h while dynamic measurements are made. The dynamic response is recorded during these tests.
Ambient Vibration Measurements: The responses of the bridges are recorded under ambient excitation (wind, river, low traffic, etc.). The results are used to determine the natural frequencies and mode shapes (OMA).
Hurdles - working in the rain
The measurements during the Dynamic Load Tests and the Ambient Vibration Measurements were carried out by HochBau. It was convened with the client that a total of six points of acceleration measurement would be used, at both sides of ¼, ½, and ¾ of the span of the bridges. At least the vertical and transversal directions had to be measured in all points, and the longitudinal direction in at least 2 points, making up already at least 14 channels.
Several hurdles had to be overcome for the success of this endeavor, mainly:
Geographic location: La junta is 1415 km from Santiago, Chile’s capital. All measurement systems, tools, and all supplies had to be taken by car there. Meticulous planning was needed; if anything stayed behind, we would not be able to get it in Aysén.
Little upfront time: Delivery of hardware takes its time. Delivery in midst of a pandemic and a chip and aluminum bar shortage takes even more time. Having only two months from notice to execution of on-site works of the project, time was tight.
Flexible structure: On the technical side, a decision of which sensor technology to use had to be made; Piezoelectric, MEMs, or Force Balance? Despite not knowing the bridges' lowest natural frequencies, intuition dictated that they had to be well under 1 Hz.
Bridge length: The bridges have no berm, and therefore, no place on the structure for a person to record and monitor the measurements. The length of the bridges meant long cables. If analog cables would be used, the DAQs would have to be brought close to the sensors, since the shortest cable might have been over 40 m.
Installation time: The measurement system had to be installed and ready to measure in a short time, on the same day as the load tests would take place. Pre-installing the system was not an option, since the chance of the equipment or the cables getting stolen is real (at least here in Latin America).
The Weather!!!: Chile is known as a largely dry country; it even hosts the driest desert on the planet. But despite this, the Aysén region competes with some of the rainiest regions of the world. Even though it rains all year round there, the tests were carried out in July, at the height of South America’s winter. Buckets of water falling from the sky and near-freezing temperatures were guaranteed.
Suited for rough conditions
Keeping all the beforementioned aspects into account, some decisions had to be made - both practical and technical. The accelerometers had to have a DC component (i.e., 0 Hz), due to the low frequencies to be measured, and therefore piezoelectric sensors were discarded as an option.
Between MEMS and Force Balance sensors, the latter offers a much higher dynamic range and would have been our first choice if measuring a very tall or base-isolated building. Nevertheless, for the dynamic tests, both are suited. But would the signal-to-noise ratio be enough for ambient vibration measurements?
For this campaign, we knew that the external ambient excitation would be large enough, even for the 90 dB dynamic range of MEMs. But then there is the issue of the cabling. If analog sensors would be used, the DAQs had to get close to the sensors; having 14 cables between 45 m and 105 m in length was not an option, because of the cost and additional noise the cables would infer into the measured signals.
| Piezoelectric (IEPE) | Force Balance | MEMS | |
|---|---|---|---|
| Low Freq Response | Acceptable | Excellent | Excellent |
| High Freq Response | High | Low | Acceptable |
| Transducer Cost | Acceptable | High | Low |
| Dynamic Range | Good | Excellent | Acceptable |
| Wiring Cost | Acceptable | Acceptable | Excellent |


Luckily, a practical cost-effective measurement solution was at hand. The IOLITE 3xMEMS-ACC combines a low-noise triaxial MEMS accelerometer and an ADC module (i.e. local DAQ) into one single relatively small piece of equipment. Since the measured quantities are digitized in the sensor, the results are queried digitally through the EtherCAT protocol via ethernet cables (CAT5e or CAT6).
The EtherCAT protocol has the advantage of time-inherent synchronization between all sensors and also allows to connect the sensors in series or, with a Beckhoff EtherCAT switch, in branches. Additionally, the sensors support Power Over Ethernet (PoE), which allows to power the sensor through the same cable carrying the queried data, without having to take power over long cables to every single sensor.
But to top all this and make the choice of using these sensors a no-brainer, was the fact that they can be bought in an IP67 aluminum housing! Even though to be watertight, the latter needs the network cable to be passed through the waterproof cable glands before crimping the RJ45 connector and then the aluminum housing cover can be closed.
Now, don’t get too excited about all this yet. Remember the delivery/supply chain issue? Dewesoft’s fabrication and delivery time, on such short notice, only allowed for the delivery of three waterproof MEMs. Luckily, our local provider Varitec leased us three indoor MEMs.
Now we were down to only two issues:
how to waterproof the three indoor MEMs and
how to avoid the on-site opening and crimping of the ethernet cables of the three waterproof MEMs?
The latter would also have taken a long while on-site! Well, we had to go old school, wrapping the indoor MEMS in plastic foil and preinstalling 30 cm ethernet cables to the waterproof MEMs.
The connection with the longer cables was then made through RJ45 couplers. Due to the roughness of the concrete deck, the MEMS were fastened to thick steel plates which were bolted to the bridge deck.


With all this said, only the system layout was missing. Together with the Technical Support Area of Varitec, a chain architecture, over a 250 m CAT6 line was chosen over a branch architecture, since only one PoE and no EtherCAT switch would be necessary this way.
Figure 7 below shows where the sensors were located and how the cables were laid out, using the Palena Bridge as an example. The cable was crossed from the third to the fourth MEM through the expansion joints. The measurement software had to reside on a notebook in a dry and safe location, so a car (SUV) was parked close to the entrances of the bridges (control station) from where the system was also powered using a gasoline mobile generator.


But there was still one last issue. From the car, the measurement engineer would have no visibility off the deck of the bridge and be working blindly without seeing the passing of the truck, only resting on radio communication. Therefore, a USB webcam was placed at the entrances of the bridges and integrated into the DewesoftX environment. The 15 m distance to the bridges was overcome with a USB over Ethernet extender.
The issues and measurement results
As mentioned before, measurements of the moving truck at different speeds and ambient vibration measurements were made.
The measurements during the dynamic load tests showed that the RMS values of the response of the bridges increase linearly with speed and are largest in the vertical direction (around 0.01 g at 25 km/h). Nevertheless, it can also be observed that there are always several impacts while the truck is passing, independently of speed, with crest factors of up to 14, reaching up to 0.15 g in the vertical direction and 0.06 g in the lateral direction.
It was concluded, through observations of the synchronized webcam footage, that the impacts were caused, or at least amplified, by the uneven and worn-out expansion joints.

 and dashboard used during measurements (right).")
With the records of the ambient vibration, the natural frequencies and mode shapes of the bridges were determined. The Palena bridge is used as an example, see figures 9-11. The first horizontal mode was way lower than predicted by the structural finite element model, but this was expected when accounting for structural deficiencies which were identified during the visual inspection.
Furthermore, the first three vertical modes were clearly identified. These results were valuable input for the structural engineers to calibrate their finite element models for further analysis and assessment of possible retrofit options.

 and torsional (right) modes of the Palena Bridge.")

 and second (right) vertical modes of the Palena Bridge.")


Conclusion
Wrapping it up, measurement campaigns can differ greatly depending on the location. As soon as heavy rain in remote locations factors in, all details of the system architecture and logistics need even greater care.
The dynamic measurements of the load tests with the truck showed to give valuable input to the structural engineers assessing the current condition of the suspension bridges. The possible retrofitting proposals and their increased lifespan will be assessed with a calibrated finite element model rather than just a theoretical one, thanks to the acquired data.
This field campaign highlights the importance of monitoring bridges and other critical infrastructure. With the decreasing cost of technology and increasing connectivity, even in remote locations (let’s talk about 5G mobile networks and Starlink), we’re aiming at the design of continuous and permanent Structural Health Monitoring Systems (SHM) for the bridges of today and tomorrow.
PS: An expanded system including strain gauge and temperature RTDs was recently used for measurements on two other hanging bridges, further down in Patagonia.