


Vibration Test on High-Voltage Reactor

Vibration testing and analysis are widely used to identify anomalies in industrial and other machinery. In this test, the Dewesoft SIRIUSi measurement system was used to test a high-voltage reactor. Such testing at regular intervals allows for keeping track of the evolution of the mechanical characteristics of the insulating material – identifying machinery issues to foresee any need for maintenance. Dewesoft SIRIUSi can be configured to perform mechanical or electrical measurements or a combination of the two, depending on the test needs.
Terna S.p.A. is a transmission system operator (TSO) based in Rome, Italy. It operates through Terna Rete Italia, which manages the Italian high-voltage transmission grid. A network of 74,669 Km of lines with 888 electrical substations, and 4 control centers managing 320 billion kWh every year. Such grids distribute high-voltage electricity many times greater than consumer voltages, in Italy typically up to 380 kV (AC).
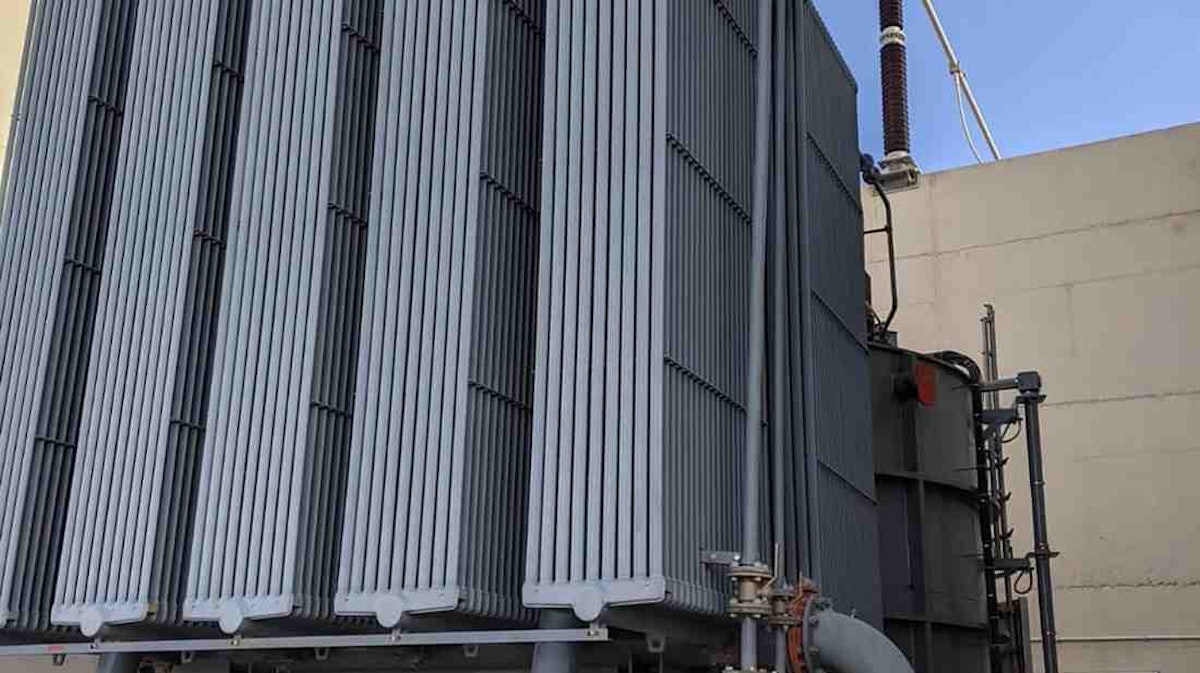
Shunt reactors are used in high-voltage energy transmission systems to stabilize the voltage during load variations. A traditional shunt reactor has a fixed rating and is either connected to the power line all the time or switched in and out depending on the load.
The main power system parameters are system voltages and frequency which normally indicate the level of generated active and reactive powers against the load power requirement.
Increased active and reactive power load tends to decrease the system frequency and voltage levels respectively. It then becomes essential to generate additional active and reactive power. The function of the reactors is to stabilize the grid voltage by consuming the reactive power of overhead lines in low-load conditions.
The high quality and long-term stability of these components are crucial for a reliable transmission network. However, low noise and vibration levels are required by customers. Noise from reactors and large power transformers has a tonal character, which is perceived as more annoying than broadband noise at the same sound levels.
Purpose of the test
The purpose of the test was to verify the differences in the level of vibrations between a particularly noisy reactor and a less noisy one (a normal one) as the applied load varies. This comparison is aimed at evaluating the possible variations over time of any mechanical-structural drifts of the reactors, to predict and prevent their failures.
The measurement equipment used
One Dewesoft SIRIUS signal conditioning and data acquisition system, model SIRIUSi-HS 4xHV, 4xLV
One Dewesoft AC current clamp, model DS-CLAMP-15AC
Two IEPE 10mV/g uniaxial accelerometers
G.R.A.S. 46AE 1/2" microphone
Interface accessories


Current Transformers (CTs) are used to measure alternating current (AC). They are inductive sensors that consist of a primary winding, a magnetic core, and a secondary winding.
Essentially, a high current is transformed to a lower one using a magnetic carrier, thus very high currents can be measured safely and efficiently. In most current transformers, the primary winding has very few turns, while the secondary winding has many more turns. This ratio of turns between the primary and secondary determines how much the magnitude of the current load is stepped down.
The AC detected by the primary winding produces a magnetic field in the core, which induces a current in the secondary winding. This current is converted to the output of the sensor.
Current transformers are available as split-core configuration from Dewesoft, which allows convenient hook-up possibilities since the circuit does not need to be altered in any way.


The module integrates a high-end signal conditioning circuit with all the necessary features, such as:
selection of AC or DC coupling,
programmable gains,
offset compensation (deriving from transducers),
programmable low-pass filters,
excitation of the current probes,
the possibility of IEPE measurement,
self-recognition of the current probes and the sensitivity to be used and self-recognition of adapters.
Among the various features, the galvanic isolation at 1600V channel-channel and channel-GND is noteworthy.
Measurement setup
One channel of the SIRIUSi isolated data acquisition system was dedicated to the voltage measurement, detected downstream of the VT (1:3850). The other channel was used for the current measurement downstream of the reactor (CT 1:400).
For this test, two accelerometers were used on the external structure of the reactor. One kept in a fixed position near the temperature indicator and the other moved into two positions during the test. One on the exchanger side and one on the HV output side.


Noisy reactor
The vibration monitoring test of the mechanical structure of the noisy phase 4 reactor involved two configurations:
Accelerometer 1 is positioned behind the pressure indicator and Accelerometer 2 is positioned on the exchanger side;
Accelerometer 1 is positioned behind the pressure indicator and Accelerometer 2 is positioned on the HV output side.


Normal noise reactor
The vibration monitoring test of the mechanical structure of a reactor with a normal noise level, the phase 12 reactor, involved two configurations:
Accelerometer 1 is positioned behind the pressure indicator and Accelerometer 2 is positioned on the exchanger side
Accelerometer 1 is positioned behind the pressure indicator and Accelerometer 2 is positioned on the HV output side.


Comparative mechanical analysis
We did a comparative mechanical analysis between the phase 4 reactor and the phase 12 reactor.
For both measurement configurations, the mechanical behavior of the Phase 4 reactor shows higher acceleration RMS values when compared with the acceleration RMS values acquired on the Phase 12 reactor.
| Reactor | Acc. 1 (pressure indicator) | Acc. 2 (exchanger side) | Acc. 2 (HV side) |
|---|---|---|---|
| Noisy reactor Phase 4 | 0.363 g | 0.606 g | 0.779 g |
| Standard noise reactor PHase 12 | 0.142 g | 0.430 g | 0.430 g |
The extracted data show that a reactor with a normal noise level shows a uniform vibration level on both sides (exchanger side and HV side), equal to 0.430 g. The accelerometer near the pressure indicator measures an acceleration equal to about one-third of the other. This is a phenomenon that is explained by the presence of a reinforcement of the metal carpentry not far from the first accelerometer.


The analysis carried out on the noisy reactor, on the other hand, shows a clear discrepancy in the vibration values on the two sides measured by accelerometer 2 (0.606 and 0.779 g RMS).
Also, in this case, accelerometer 1 detects a lower vibration level but with a ratio of about ½ instead of ⅓ as in the case of a noisy reactor. The phenomenon is clearly visible in Figure 6.

, passing from configuration 1 on the exchanger side to configuration 2 on the HV side. The two levels, on the other hand, are almost identical for the pink curve which represents the measurement on the normal noise reactor (Phase 12).")
A frequency analysis of the signals from accelerometers shows the clear presence of harmonics up to 1,500Hz.
The spectral content is different but present at the same frequencies.


By adding the line voltage to the graph (in green), the correlation of the frequency of mechanical vibrations with that of the reactor energization becomes clear. The line voltage is at 50Hz, while the harmonics of the vibrations are multiples of 100Hz.

Power analysis
We performed a power analysis on the voltage and current signals acquired downstream of the VTs and CTs to calculate the typical parameters of a network analyzer.
Line frequency
The line frequency was calculated by the PLL algorithm integrated with DewesoftX which guarantees accuracy of 1 MilliHertz.
In the 20 minutes of recording, the system detected frequency variations with a peak-to-peak variation of 0.07 Hz.


Phasor analysis
A display of voltage and current phasors highlights the phase shift of 90°, which is typical of the almost pure inductance of the reactor.

.")
Harmonics analysis

The very low Power Factor (0.0255) is almost totally caused by the phase shift close to 90 degrees, while the distorting power is practically negligible (almost perfect sinusoidal regime).
For reactive power Q, is measured in “var” (volt-ampere-reactive) – VA added the letter “r”. The multiples of “var” are kvar (kilovar) and Mvar (megavar).
The distorting power D is 1,059 kvar out of a total reactive power Q of 86,347 kvar and an apparent power S of 86,375 kvar.
 power analysis screen of the DewesoftX Power Module. A wide range of parameters is calculated.")
Conclusion
The tests carried out have clearly shown a high level of vibrations of the noisy reactor (Phase 4) compared to the normal noise reactor (Phase 12). It also showed a non-uniform distribution of intensities on the two measured sides.
The measured vibration shows a perfect correlation with the 50Hz mains frequency, a clear sign that it derives from reactor energization phenomena
An analysis at regular intervals of the reactors with the Dewesoft system undoubtedly allows to keep track of the evolution of the mechanical characteristics of the insulating material and to foresee any need for maintenance.
The Dewesoft SIRIUSi system can be configured to perform mechanical or electrical measurements or a combination of the two, depending on the test needs.
The power analysis, in parallel with the mechanical measurements, allows you to keep all the electrical characteristics of the system under control and adds important information to detect any anomalies.
The same tool could be used for modal analysis (Modal Test) when the reactor is not energized, to identify the frequencies and modal shapes, as shown in the following image.


Any drift of frequencies and modal shapes gives a clear index of mechanical wear with the consequent change in stiffness characteristics.
These indices could be used both in the initial phase to identify the best points to analyze the vibrations and on periodic analysis to have a clear picture of the variation of the mechanical characteristics.
All to give an insight into the dynamic mechanical behavior of the reactor – a useful tool for optimization of its noise and vibration properties.
More Information:


