


Brake Test Pressure Measurement on Buses

October 9, 2020
The brake system is a rather complex system in the vehicle. It consists of many components and parts, and any minor failure of one component could cause the failure of the whole system.
A Dewesoft customer, a vehicle brake manufacturer in China, needed to check whether a specific brake problem was caused by a brake line pressure imbalance. Previously the customer did not perform this kind of troubleshooting. Now a Dewesoft measurement solution, including a DEWE-43 data acquisition system with a pressure sensor and DewesoftX software, does the job.
Of all the systems that make up a car, the brake system might just be the most important and vulnerable one – it ensures basic safety in driving. Such systems contain a variety of parts:
brake pads,
brake drums,
brake discs,
brake calipers,
brake shoes,
wheel cylinders,
backing plates,
brake cables,
which are all consumable accessories.
Issue – deviation when braking
Most motor vehicles feature hydraulic brake systems, and the brake lines are flexible hoses transferring the pressure from the driver’s foot on the brake pedal into stopping power. The brake fluid is stored in the master cylinder and is transferred from the master cylinder to the brake callipers via the brake lines when the brake pedal is pushed. This pressure forces the callipers to clamp down on the brakes and, in turn, slow and stop the vehicle.
The brake lines are essential to keep the vehicle safe on the road, if they fail or aren’t reliable, it means serious trouble. So, this kind of testing is general in the vehicle industry.
Our customer, a vehicle brake component manufacturer is supplying its products to commercial vehicles and buses. Their customers reflected to them that a bus that used its brake components always deviated when braking. They wanted to check whether an imbalance of the brake line pressure caused the brake problem or if the brake callipers and brake discs were responsible for the failure


The solution – DEWE-43A data acquisition system
To do this troubleshooting, the customer used a Dewesoft solution to test the brake line pressure. The measuring system consists of the DEWE-43A data acquisition system, DewesoftX data acquisition software, third-party pressure sensors type WIKA S-10.


DEWE-43A is a portable and robust data acquisition system. It weighs under two pounds and is small enough to fit in a hand. The unit is cut out of a solid block of aluminium by CNC.
DEWE-43 has 8 universal analog inputs, 8 digital/counter/encoder inputs, and two high-speed CAN bus inputs. Each channel provides power for sensor excitation, and each channel, either analog, digital, or CAN is synchronized with microsecond accuracy. DewesoftX, the award-winning advanced data acquisition, data recording, and data analysis software, is included with the hardware.
With plug-and-play functionality, the DEWE-43A is suited for various dynamic data acquisition applications. It has universal analog inputs and can accept: voltage and full-bridge signals natively as well as IEPE, charge, thermocouples, half-bridge, quarter bridge, RTD, current, resistance, and LVDT signals with the use of DSI adapters. The sampling rate is up to 200 kS/s per channel, with 24-bit sigma-delta ADC. Each channel provides power for sensor excitation.


DewesoftX software for data acquisition (DAQ), data recording, and data analysis are included in Dewesoft data acquisition systems.
Compact and rugged, WIKA S-10 pressure transmitters are designed for industrial pressure measurement applications, including hydraulics and pneumatics, vacuum, liquid level measurement, press control, compressor control, pump protection, and other processing and control operations.


The pressure sensor used is a 3-wire type, WIKA S-10 sensor. Its measuring range is 0~150 bar, the output is 0~10 v, the media temperature is -30 ~ +100 degrees Celsius, and the operation temperature is -20 ~ +80 degrees Celsius.


Brake line pressure measurements
Using DEWE-43A with pressure sensors to measure the brake line pressure, obtains the pressure value and pressure curve of the main valve and brake chamber of the carriage wheel.
In this case, the customer is limited by the number of pressure sensors. Only four pressure sensors are available, meaning that both the front axle system and back axle system cannot be measured at the same time. The front axle system was chosen to be measured.
One pressure sensor is installed in the line of the upper cavity main valve. Two other sensors are installed with tee couplings in the pressure line of the front-right brake chamber and front-left brake chamber. Measuring cables connect the pressure sensors and analog input of DEWE-43A.
Because of the test conditions, the testing is static, and the pressure of the brake master pump inflate is about 10 bar.
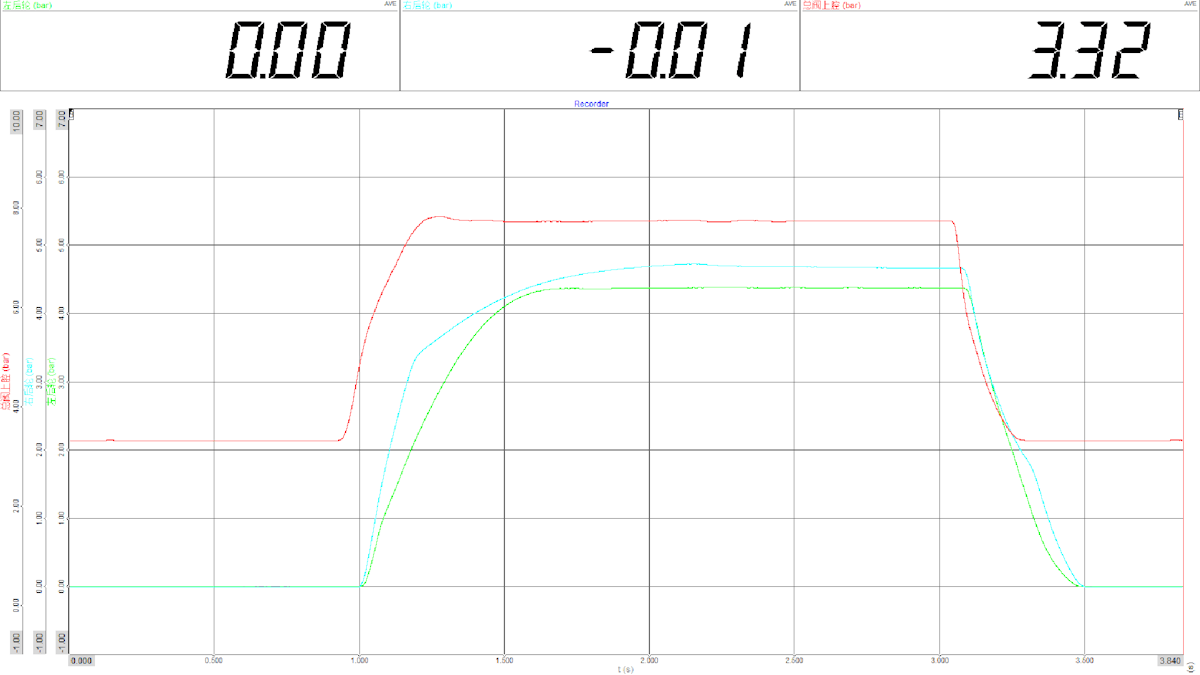
The brake is hit, activating the brake system and the curve of pressure recorded. The curve is then analyzed among others to establish whether the top brake pressure of the right and left brake chamber is equal and if the timing of the right and left brake chamber is simultaneous. DewesoftX DAQ software is in this case only used to record the pressure values and curves.


In the software, two statistical channels are added to calculate the Max pressure value of two brake chambers. The front-right brake chambers are 4.38 bar, and Front-left was 4.73 bar. Then we zoomed in on the pressure rise part, and used the double cursor, to see the time difference in timing between the upper cavity main valve and that of the brake chamber working. It was about 55ms.
This way the recorded curve of the data helps the customer to find the braking deviation caused by brake line pressure imbalance.


Conclusion
Previously, the customer did not perform this kind of testing, but the DEWE-43A, as a small, flexible, easy-to-use product, helped the customer to gain valuable new insights.
More Dewesoft data acquisition systems were already used by the manufacturer. They are connected or expanded if more channels are needed in the future when the customer intends to add the GPS module and pedal force sensors.