


Vibration Testing to Improve the Riding Comfort of a Vintage Luxury Car

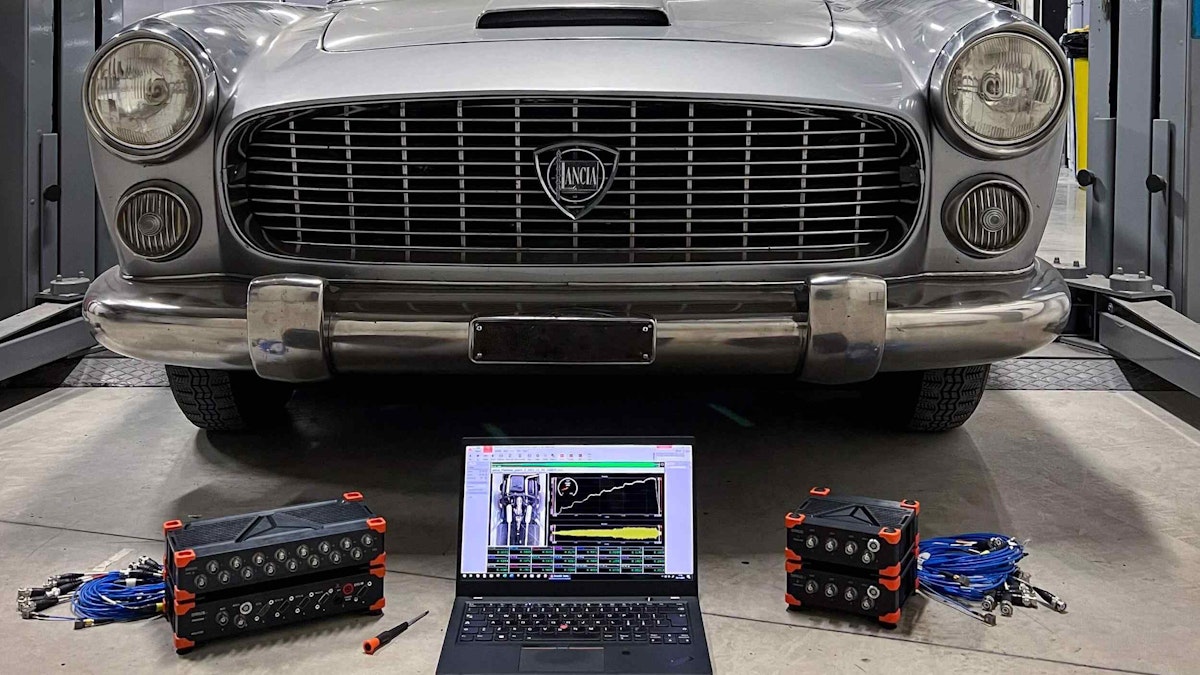
To improve the vibrational comfort of a 1960s vehicle gem - a Lancia Flaminia, we did some vibrational testing and analysis. Currently, an enthusiastic vintage car collector owns the car. When the engine was running, he felt unexpected vibrations. Though he is very knowledgeable about NVH, he commissioned a Dewesoft customer, EASTING, to do the vibrational comfort analysis of his car.
The Lancia Flaminia
Lancia was an Italian automobile manufacturer founded in 1906 and known for producing a range of luxury vehicles. Lancia introduced the first Flaminia in 1957, and the Italian car design firm and coachbuilder, Carrozzeria Pininfarina, designed the sedan version. The car was named after Via Flaminia, one of the great Roman roads laid down in 220 B.C. The free encyclopedia, Wikipedia, shares these facts about Lancia Flaminia:
The Lancia Flaminia (Tipo 813/823/824/826) is a luxury car produced by Italian automaker Lancia from 1957 until 1970. It was Lancia's flagship model at that time, replacing the Aurelia. It was available throughout its lifetime as a saloon, coupé, and cabriolet. The Flaminia coupé and convertible were coach-built cars with bodies from several prestigious Italian coachbuilders. Four "presidential" stretched limousine Flaminias were produced by Pininfarina for use on state occasions.
There were 12,633 Flaminias sold over 13 years. Coupés outsold the four-door saloon, an unusual occurrence otherwise seen at the time only in American compact and midsize models whose coupé versions were standard factory models that cost the same or less than the sedan, while the Flaminia coupés' coach-built bodies made them considerably more expensive than the limousine-like Berlina.”
Lancia introduced the first Flaminia in 1957, and the Italian car design firm and coachbuilder, Carrozzeria Pininfarina, designed the sedan version. The Flaminia was the last model developed before the carmaker went bankrupt and ended up being bought by Fiat in 1969.
The vehicle tested is owned by a collector with a passion for technology and vintage cars and is today used for weddings and other festive vents.
LANCIA FLAMINIA SEDAN (1963-1967)
| Type of specs | Part | Specs |
|---|---|---|
| ENGINE SPECS – 2.8 | Cylinders | V6 |
| Displacement | 2775 cm3 | |
| Power | 95 KW @ 5000 RPM129 PS @ 5000 RPM127 BHP @ 5000 RPM | |
| Torque | 228.5 Nm @ 2500 RPM | |
| Fuel System | Carburetor | |
| Fuel | Gasoline | |
| Fuel capacity | 58-liter | |
| PERFORMANCE SPECS | Top Speed | 171 km/h (106 mph) |
| TRANSMISSION SPECS | Drive Type | Rear Wheel Drive |
| Gearbox | Manual, 4 Speed | |
| BRAKES SPECS | Front | Discs |
| Rear | Discs | |
| TIRES SPECS | Tire size | 205/55 - R16 |
| DIMENSIONS | Length | 4855 mm |
| Width | 1750 mm | |
| Height | 1480 mm | |
| Front/Rear Track | 1,368/1,370 mm | |
| Wheelbase22 | 2870 mm | |
| Ground Clearance | 140 mm | |
| Aerodynamics (Cd) | 0.48 | |
| WEIGHT SPECS | Unladen Weight | 1560 kg |
| FUEL ECONOMY (NEDC) | CO2 Emissions | 247 g/km |
The testing partner - EASTING
We consulted the company Easting for testing services. They develop and customize measurement solutions. We found it the ideal partner for troubleshooting. The company’s experience in testing allows it to guide customers through all measurement steps. All from choosing, supplying, and setting up the most appropriate instrumentation to processing and analyzing measured data.


The issue - shaft unbalances
The vintage car collector asked Easting to take care of the vibrational issues of his 1960s Lancia Flaminia Berlina. The levels of vibration were disturbing the driving comfort. The car is a rear-wheel drive sedan with a 2.8 litre and V6 cylinder engine.
The Flaminia model has the peculiarity of having a transaxle, a combination of a transmission and an axle. The transaxle transmits the power from the engine to the rear wheels and provides the necessary gear ratios for acceleration and deceleration.
Typically, Lancia transaxles are designed to be lightweight and efficient and were applied in various Lancia models. They were known for their reliability and durability and were a key component of many of the company's successful vehicles.
Most commonly in cars, the clutch connects directly to the powertrain. However, in the Flaminia, the clutch is in the gearbox case in the rear of the vehicle. This car’s gearbox is in a single block with the differential and the rear brakes. This refined technical device ensures better weight distribution, grip, and braking.
However, this implies that the prop shaft always rotates with the engine crankshaft. As a consequence of this design, eventual prop shaft unbalances are perceivable. It is felt within the car in even the quietest conditions, such as engine idle and low revolutions.


Figure 3 - Components description
| Number | Description |
|---|---|
| 1 | Shaft, gear remote control |
| 2 | Shaft, gear control lever |
| 3 | End gear control lever shaft lower |
| 4 | Yoke, gear selector |
| 5 | Gearbox |
| 6 | Knob, gear control lever |
| 7 | Lever, clutch pedal |
| 8 | Lever, gear selector idler |
| 9 | Lever, gear connector |
| 10 | Pedal, clutch |
| 11 | Rod, clutch control |
| 12 | Rob, gear control |
| 13 | Rob, gear selector |
| 14 | Propeller shaft |
| 15 | Propeller shaft assy |
The owner asked Easting for help to improve the driving comfort index of his car. We set out to reduce the prop shaft unbalancing and check the status of the gearbox and engine rubber mounts.
The solution
NVH (Noise, Vibration, and Harshness) was needed. NVH is an engineering discipline that studies the noise and vibration characteristics of vehicles, among others:
Vehicle riding quality (comfort)
Gearbox, driveline, pump characterization (idle, rattle, whine, etc.)
Powertrain and driveline NVH
Operational Deflection Shapes
Rotating Machinery diagnosis
Transfer Path Analysis and structural propagation analysis
To address the unbalance measurement, we used DAQ from the SIRIUS family and DewesoftX software with the Balancing module and the ODS functionalities of the Modal Testing module:
System setup
The choice of modules used reflects the mix at hand at EASTING. We used the following test equipment for our vibration testing.
SIRIUS-HD-16xACC - 16 channel differential SIRIUS DAQ slice with voltage and IEPE input modes.
SIRIUSm-3xACC-1xACC+ - 4 channel differential SIRIUSm DAQ slice with voltage and IEPE input.
SIRIUS-CUSTOM - 16 channel SIRIUS DAQ slice.
DewesoftX - data acquisition software for data recording, signal processing, and data visualization.
DewesoftX Rotor Balancer - single and dual plane rotor balancing for DewesoftX software.
DewesoftX Modal Test - modal testing add-on for DewesoftX software.
8x PCB Piezotronics triaxial accelerometers
1x tacho pick-up for RPM


Vehicle axle balancing
Balancing the axle of a road vehicle ensures that the vehicle’s weight is evenly distributed around the axle.
The Dewesoft balancing tool for rotating bodies acts in an easy three-step sequence:
Step one, recording the actual status,
Step two, adding a trial mass, and
Add the calculated correction mass at the appropriate angle in the last step.
We designed a pair of specific collars for applying the balancing masses without modifying the original layout.


We deployed the Dewesoft Balancing software module to reduce vibrations related to the first order.
Basically, it worked like this:
We measured the initial state and then added a trial weight of the known mass.
We calculated the position and mass of a counterweight.
Removed the trial weight, and added the calculated weight on the opposite side to cancel out the imbalance.
In the end, we managed to reduce vibration on the receiving accelerometers by 70%.


Proud of our result, we invited the owner for a subjective evaluation. His judgment was that it is better but not perfect.
We made further analysis of the mounts. Our balancing procedure might have been affected by a suspicious natural frequency. Never balance across resonance! Furthermore, we analyzed an elastic system changing its properties with temperature and load.
To better understand underbody behaviour, we instrumented the car for carrying out the ODS test.
Operating Deflection Shapes (ODS)
Operating Deflection Shapes (ODS) is a technique used to identify the root cause of problems in mechanical systems, such as vibration, noise, or fatigue failure. It visualizes the movement of individual components during operation, showing how a machine or a structure moves within its operational conditions. ODS testing involves no applied artificial forces; the operating machinery under test is only excited by itself, and only response vibration signals are measured.
A series of sensors, most often accelerometers, are placed at strategic locations on the mechanical system. These sensors measure the movement of the system components as it operates. The data can create a graphical representation of the system’s movement, known as an operating deflection shape.
By analyzing the operation deflection shapes of a system, engineers and technicians can identify areas of excessive stress or movement. They can then take steps to correct the issue, and improve the reliability and performance of the system.


Frequency operating deflection shapes (FODS)
Frequency Operating Deflection Shapes (FODS) is a variation of operating deflection shapes (ODS) that adds a frequency component to the analysis. Like ODS, FODS is a technique used to analyze the dynamic behaviour of mechanical systems during operation by visualizing the movement of its components. However, FODS goes a step further by analyzing the movement’s frequency which can provide additional insight into the system’s behaviour.
Data is analyzed to determine the frequency of the component movement. It generates a graphical representation of the system’s movements at different frequencies, known as a frequency operation deflection shape. Frequency ODS is the simplest method to see how a machine or structure moves during action at a specific frequency.


During our measurement of the Flaminia transmission system, we acquired only the raw signals to speed up the test as much as possible.
One benefit of using FODS over ODS is that it allows you to identify areas of excessive movement or stress at specific frequencies. This can be particularly useful in identifying problems that may not be apparent with a simple ODS analysis. If, for example, a system is experiencing vibration at a specific frequency, an ODS analysis may not reveal the source of the problem. A FODS analysis, on the other hand, can identify the components that are moving excessively at that frequency, helping to pinpoint the root cause of the issue.
Another benefit of FODS is that it can provide a more detailed understanding of the dynamic behaviour of a system. By analyzing the movement of the system's components at different frequencies, it is possible to identify patterns or trends in the data that may not be apparent with a simple ODS analysis. FODS can identify potential problems or be used to develop strategies to improve the system's performance.
The DewesoftX Modal suite supports ODS and FODS testing. With Frequency ODS, one of the acceleration sensors is defined as the excitation reference signal and the others as response sensors. As usual in the software, animations can be displayed but only work optimally in areas with good coherence.
The only math channel enabled online was the one that calculates the RPM value from the voltage pulse train of the tacho pick-up.


The analysis consisted of the Operational Deflection Shape of measured points and the evaluation of vibration magnitude at critical RPM/orders.
Order analysis separates rotational or reciprocating vibration into orders. The first order is the reference value corresponding with the machine’s rotational speed (RPM). In other words, the first order and the frequency of the rotation are the same value. The subsequent orders (2, 3, 4, etc.) are a multiple of that value.


Conclusion
Our ODS analysis showed a first-order reduction at the synchronous frequency, but a “well-animated” gearbox deflection mode was still at 12 Hz. We had solved the shaft balancing problem, but the overall behaviour still has to be improved.
Our next step will be to replace the old and worn-out mounts, then repeat the test to check the gearbox behaviour and eventually recheck the prop shaft balancing.
