


Vibration Monitoring Eliminates The Need for a Tuned Mass Damper in Vienna’s DC Tower 2 Building

During the construction of Vienna’s DC Tower 2, engineers faced a crucial question: would the skyscraper require a costly Tuned Mass Damper to limit wind-induced vibrations? Using real-time vibration monitoring and a digital twin model in combination with Dewesoft MEMS sensors, REVOTEC zt gmbh gathered live structural data in cooperation with PORR Bau GmbH to predict the tower’s stiffness and natural frequencies. The result — precise insights that ultimately eliminated the need for the damper, saving several floors and millions of euros.
Introduction
Civil engineers apply tuned mass dampers in tall buildings, bridges, and other structures. These devices reduce structural vibrations by using a large mass mounted on a spring-damper system.
The damper is ‘tuned’ to the structure's resonant frequency, causing it to oscillate out of phase with the structure's motion. This action absorbs and dissipates the structure's vibrational energy, thereby reducing sway from events such as wind or earthquakes. However, such a system is costly.
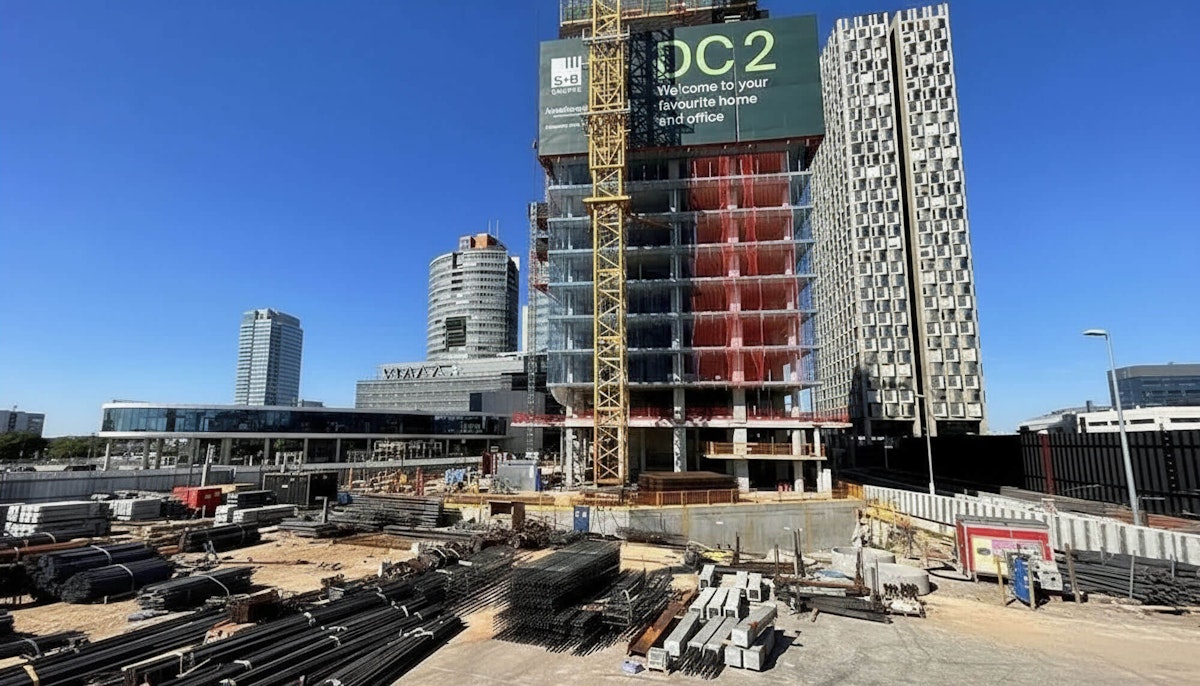
In Vienna, the capital of Austria, in the area known as Donau City, the French architect Dominique Perrault has designed a cluster of skyscrapers, the three Donau City (DC) Towers. As the tallest skyscraper in Austria, DC Tower 1, standing at 220m high (250m including the antenna), was completed in 2013. DC Tower 3, measuring 110m, was finished in 2022, while DC Tower 2 is now in the finishing phase.
The project partners
While the Vienna DC Tower 2 was under construction, the Austrian building company PORR Bau GmbH sought to determine as soon as possible whether a Tuned Mass Damper (TMD) was necessary to ensure the structure’s safety and comfort. The assessment is of significant interest because the implementation entails substantial costs and the loss of several floors that could otherwise serve as living spaces.
PORR Bau GmbH is active in Austria and Central Europe across government services, building construction, industrial construction, civil engineering, mineral resources, exceptional foundation engineering, tunnel construction, environmental technology, and transport infrastructure construction.
Together with the department “Technology Management and Innovation” of PORR Bau GmbH, the Civil Engineering companies REVOTEC zt gmbh and ghp gmeiner haferl&partner zt gmbh used real-time monitoring and a real-time built Digital Twin Model for vibration analysis of the DC Tower 2, leveraging Dewesoft equipment to inform data-driven decision-making.
The DC Tower 2 is approximately 175 meters high with 53 stories and six underground levels. The building is about 59m long and 26m wide, with a total gross floor area of approximately 62,800 m², including 314 flats, offices, restaurants, and shops. It also provides 216 parking places.
The work of the special foundation engineering team of PORR Bau GmbH involved excavations to a depth of 22.7 meters, using advanced techniques such as diaphragm walls and injection anchors. Reinforced concrete without joints characterizes the DC Tower 2 construction. It has a stiffening core and two transverse shear walls for the horizontal load transfer. The builders have scheduled the tower's completion for autumn 2026.


The issue
Due to their nature, high-rise buildings are more exposed to environmental conditions such as wind or earthquakes. Vibrations, therefore, need to be kept below certain vibration levels—first to ensure the integrity of the structure and second to provide comfort for the residents. For example, people working in an office are generally less sensitive to vibrations than residents in their homes sleeping at night.
To compensate for winds, the neighboring building, DC Tower 1, already has an in-built 350-ton pendulum on top, a so-called “Tuned Mass Damper” (TMD), for which Mr. Martin Haferl, structural engineer and structural designer at ghp gmeiner haferl&partner zt gmbh, was involved in the planning. When the building moves, the pendulum swings in the opposite direction. A damper slows the pendulum's kinetic energy, thereby reducing the tower oscillation.
The question was whether the DC Tower 2 would need a TMD? And how to know this as soon as possible, while the skyscraper is still under construction? The assessment is of significant interest because implementing a TMD involves high costs and the loss of several floors that could otherwise serve as living spaces.
 in DewesoftX software, shown on a Demo Building.")
The strategy and the challenges
Since this region of Vienna is known for strong winds, the dynamic wind-induced vibrations had already been investigated and reported. The comfort limit (i.e., maximum top horizontal acceleration) is 1.5% g for a wind of 10-year return. Wind tunnel testing and simulation of DC Tower 2 showed a slight exceedance of 1.59% g, requiring a passive TMD at the design stage. However, previous studies also showed a gap between the design estimation and the actual modal parameters characterizing the real tower.
The urgent need to decide on installing a passive TMD has prompted PORR Bau GmbH and REVOTEC zt gmbh to develop a framework that couples real-time monitoring with a 3D digital twin model of the tower, providing the actual natural frequencies and damping ratios in real time throughout construction.
Vibration measurements began when the building was 1/4 of its height. The engineers progressively extended the measurement chain and constantly adjusted the 3D digital twin model as the building grew.
The permanent vibration monitoring system
The engineers installed the permanent vibration-monitoring system during the construction of DC Tower 2. The system comprised a control cabinet, a weather station, and acceleration sensors. It is well known that shear walls and core walls in high-rise buildings transfer more horizontal load than columns do. Therefore, the measurement layout for evaluating the modal parameters and wind-induced vibrations of DC Tower 2 accounted only for the perimeter of the stiffening core.
The tower's natural frequencies and corresponding vibration modes, estimated at the design stage, were used to determine the installation of three accelerometers per floor, spaced at every quarter-height of the tower. The setup should capture not only the translational vibration modes, i.e., bending modes, in the weak X- and strong Y-directions of the tower, but also its torsional mode and its coupled translational-torsional modes.
Although a single accelerometer measured the tower's natural frequencies, it was only possible to link them to the tower's natural vibration modes (i.e., mode shapes) by installing three accelerometers per floor.
The engineers mounted three accelerometers at every quarter-height of the tower, using real-time monitoring data to build a digital twin model that displays the mode shapes in 3D. While construction was in progress, they installed three accelerometers per floor at each quarter-height of the tower, i.e., the 16th at 49.6 m, the 28th at 88.0 m, the 41st at 129.6 m, and the 53rd at 166.3 m. In total, 3 * 4 = 12 accelerometers (S1-S12) were present in the final state.
On top of the K2 crane at the construction site, the engineers also installed a weather station. The station should monitor, in real time, the environmental effects, such as dynamic wind impact, on the DC Tower 2 modal parameters and forced vibrations. They chose the K2 crane based on its proximity to the Danube River. The weather station recorded the wind speed and direction in real time.
By combining wind data from the weather station with wind-induced vibration data from accelerometers on DC Tower 2, engineers could accurately assess forced vibrations and link vibration amplitudes to specific wind forces. An electrical cabinet controlled and managed the measurement system, ensuring the data collected were reliably captured, processed, and transmitted.


. As the building grew higher, engineers gradually expanded the measurement chain. On each of the four instrumented floors (16, 28, 41, and 53), they used three vibration sensors.")
List of equipment
Twelve IOLITEi-3xMEMS-ACC-INC - Four floors equipped with three MEMS sensors for measuring vibrations
DewesoftX - data acquisition and signal processing software
DEWESOFT-PLUGIN-SERIALCOM - software plugin for communication
Standard Ethernet cables
Sensors and data acquisition sampling rate
Twelve Dewesoft IOLITEi-3xMEMS-ACC-INC triaxial MEMS accelerometers, attached tightly to the mechanical chassis to avoid any damage, recorded the vibration accelerations of the tower. The analog-to-digital conversion (ADC) is performed within the MEMS sensor, eliminating noise pickup in the analogue cabling. In addition to acceleration, the -INC option enables the sensors to function as tiltmeters and measure the tower's static roll and pitch angles about its X and Y axes. In this respect, the sensors include temperature offset drift compensation.
The sensors have a high bandwidth of 0-1 kHz and are suitable for measuring low-frequency vibrations < 1 Hz, as expected for the DC Tower 2 based on the static design estimate. The sensors recorded vibration accelerations in the X and Y directions, with a ±2 g range and a sampling rate of 100 Hz.


The Lufft WS700-UBM sensor recorded the wind speed and direction. This sensor is an all-in-one weather station that also measures air temperature, relative humidity, air pressure, precipitation, and solar radiation. The sensor measured wind direction as an angle ranging from 0° to 359.9°. In this respect, the sensor was aligned to the North, i.e., 0° is North, 90° is East, 180° is South, and 270° is West.
The system recorded wind speed and direction with a sampling rate of 1 Hz. The weather station outputs data via a serial COM port using the DewesoftX software plugin DEWESOFT-PLUGIN-SERIALCOM. The system acquired these data with the vibration data.
Disruptions - severe flood and short-circuit
During the measurement campaign, from September 14th to 21st 2024, heavy rainfall unexpectedly hit Europe. The flooding began in Austria and the Czech Republic, then spread to Poland, Romania, and Slovakia, and subsequently to Germany and Hungary. Especially in Lower Austria, close to Vienna, meteorologists classified this flood as a 30- to 100-year event!
At this point, the builders had completed construction work up to 1/4 of the total height. Wind speed and direction were recorded by the installed weather station as soon as the tower construction began (green dot in the graph). The system recorded a maximum value of wind speed of around 60 km/h on 15th September 2024 (red dot), when the flood hit Vienna.

 recorded during the night of the flood (15.09.2024).")
The first sensor (S1), which records the DC Tower 2's ambient and forced vibration responses, was installed at the first quarter height (light-blue dot). The recorded data were the accelerations in the X- and Y-directions in the time domain. Figure 8, for instance, shows the acceleration recorded by S1 during ten minutes on the night of the severe flood in Vienna.
The engineers obtained similar diagrams every 10 minutes during the construction stage for the sensors they installed next. They installed S2 and S3 sensors after the flood event (yellow dots), while the remaining sensors, S4-S12, were installed following the construction progress - the blue, purple, and orange dots in Figure 7.
Notably, S1 and the weather station stopped measuring temporarily due to the severe flood, which caused a short circuit in the measurement system. However, engineers repaired this a couple of days later, as indicated by the yellow dots in Figure 7.


Measurement results - construction stage
The permanently recorded tower accelerations in the X- and Y-directions were available on the REVOTEC platform and elaborated in the company-owned software Revo-Visual. It provides the complex magnitude of the Fast Fourier Transform (FFT) spectra.
From these spectra, it is possible to identify the natural frequencies of DC Tower 2 throughout construction. The peaks in the frequency spectrum in X correspond to natural frequencies that involve vibration modes with displacement in the X-direction; the same applies to the Y-direction.
The installation of three sensors per floor at every quarter-height of the tower became fundamental for identifying the tower's global vibration modes in their actual state and comparing them with those previously estimated at the design stage (i.e., bending modes in the X- and Y-directions, and a torsional mode).

.")
For all installed sensors (S1-S12), the spectra showed peaks corresponding to the same values of f1, f2, and f3. It is also noticeable that the values of f1, f2, and f3 decreased with the construction progress (Figure 11-b) and the tower height (Figure 11-a). During construction, the builders used a climbing formwork to build the tower core faster than the floor slabs.
It is also evident that at the beginning of the measurement, the S1 sensor recorded only f1 and f2, as indicated by the dashed light-blue line in Figure 11. The explanation was that the stiffening core had greater inertia in the Y direction than in the X direction.
Indeed, due to the strong winds in Vienna a week before and during the severe flood, as recorded by the weather station, it was possible to identify f3 already at the first quarter height of DC Tower 2, on the 16th floor, despite its almost-rigid behavior in the Y-direction.
In Figure 11, the dashed red line indicates missing data due to the severe flood. Data was unavailable until the sensor repair, as shown by the dashed yellow line. Additionally, data was unavailable due to construction work, as indicated by the dashed grey line, until technicians had restored electricity, marked by the dashed green line.

 dropped as the skyscraper under construction grew. Left: frequencies versus height, right: frequencies versus date.")
Digital twin model and 3D mode shapes
A 3D view displayed the global vibration modes corresponding to the natural frequencies of the DC Tower 2 (i.e., f1, f2, and f3). The view was made possible by the digital twin model built in ARTeMIS OMA software (from Structural Vibration Solutions) in parallel with the construction progress.
The digital twin model was developed in conjunction with the real DC Tower 2, initially using real-time acceleration records from three sensors (S1-S3, placed on the 16th floor) and subsequently incorporating records from all installed sensors (S1-S12).
In the developed digital twin model, engineers positioned the sensors according to the real tower, and the acceleration records capture the vibration response of DC Tower 2 due to dynamic wind effects and ambient excitation.
Without a FEM structural model, ARTeMIS OMA can estimate the vibration modes, natural frequencies, and damping ratios of the real DC Tower 2 under construction, by applying Operational Modal Analysis (OMA), based only on the output data (i.e., structural vibration responses, such as accelerations), recorded during uncontrolled excitation conditions (i.e., dynamic wind impact).
In OMA, the input vibration signal is considered unknown and often modelled as Gaussian white noise. The technique used in ARTeMIS OMA for the modal estimation of the DC Tower 2 was the enhanced frequency-domain decomposition (EFDD), which approximately decomposes the structure's response into a set of independent single-degree-of-freedom systems, one for each mode. Namely, it estimates spectral density matrices from real-time records and performs singular value decomposition (SVD) of these matrices.
At each frequency, there are as many singular values as there are measurement channels. The engineers then selected the SVD peaks and took the corresponding singular vectors as the identified mode shapes. They used the identified mode shapes to define the single-degree-of-freedom (SDOF) spectral bell of each mode, from which they estimated the frequency and damping ratio.
Sensor S1 at Phase 1 of the measurements identified the natural frequencies of DC Tower 2 (i.e., 1/4 of the tower height) on 7th September 2024. They were f1 = 1.06 Hz, f2 = 1.27 Hz, and f3 = 1.47 Hz, along with their corresponding vibration modes in planar view (see Figure 10).
However, to display the vibration modes in a 3D view by the digital twin model of the DC Tower 2, it was essential to install three sensors per floor. Figure 12 shows the 3D vibration modes at Phase 1 (i.e., bending in the X-direction, torsion, and bending in the Y-direction), determined in ARTeMIS OMA using three sensors installed at 1/4 tower height.

, torsion (b), and bending in Y-direction (c).")
The digital twin model of the tower rose as construction progressed, while the natural frequencies decreased. The shapes of the vibration modes remained practically the same for the first three modes (f1, f2, f3). The increasing number of installed sensors later determined additional vibration modes (f4, f5).
Figure 13 shows the determined 3D vibration modes for a 3/4 tower height (Phase 3) on 6th May 2025, with frequencies f1 = 0.28 Hz, f2 = 0.41 Hz, f3 = 0.51 Hz, f4 = 1.22 Hz, and f5 = 1.38 Hz, respectively.
, torsion (b), bending in Y-direction (c), bending in X-direction of higher order (d), and torsion of higher order (e).")
Result discussion - construction stage
The real-time monitoring, coupled with the digital twin model proposed herein, aims to bridge the gap between design estimates and the tower's actual natural frequencies, including the tower's stiffness. The results obtained during the different stages of construction helped bridge this gap earlier than the end of construction or during operability, and to predict the final actual natural frequencies of DC Tower 2.
The vibration modes of the DC Tower 2 identified in ARTeMIS OMA and displayed in a 3D view were as expected at the design stage. However, the natural frequencies corresponding to the vibration modes were significantly lower at the design stage than those obtained from the coupled framework linking the real-time monitoring and the digital twin model.
That is, in reality, the DC Tower 2 was considerably stiffer than expected at the design stage. The expected frequencies for ¼ tower height were f1 = 0.67 Hz, f2 = 0.93 Hz, and f3 = 1.04 Hz, corresponding to 58%, 37%, and 41%, respectively, which were lower than the values obtained by the coupled framework. Consequently, the natural frequencies expected in the tower's final state were notably low.
The expected final stiffness, based on the static design, overestimated the top acceleration of the tower, a crucial parameter for deciding whether to install a passive tuned mass damper to reduce forced vibrations from dynamic wind action. For a 10-year return period, the engineers requested that the top acceleration of the DC Tower 2 not exceed 1.5% g. The top acceleration, estimated at the design stage, indeed exceeded this limit.
Moreover, the coupled framework showed that the natural frequencies of the DC Tower 2 decreased significantly until the construction crew had built half the tower. Afterwards, the decrease was less steep.
The engineers, therefore, decided to estimate the final actual natural frequencies, i.e., the stiffness of DC Tower 2, by considering not only the coupled framework but also collaborating with the design engineers. The coupled framework was fundamental for the design engineers to calibrate the FEM model of the tower to the measured frequencies and to predict the tower's stiffness in the final state.
An alternative method of prediction is to regress the measured frequencies on tower height, with decreasing frequencies as tower height increases. However, attention must be paid to the regression model, as it can change significantly and become more accurate with additional measurements during construction. Based on the results for DC Tower 2, the engineers recommended performing a regression analysis of the measured frequencies up to ¾ of the tower height.
Natural frequencies prognosis
Given the discrepancies between the measured frequencies and the expected values for ¼ tower height, and the immediate need to determine the final actual stiffness of DC Tower 2, the engineers decided to estimate the final stiffness based on the available data from the first-installed sensors S1-S3.
The data used for prognosis were the acceleration records on 04.11.2024, when S1-S3 were the only sensors installed (at ¼ tower height), the tower core was at the 30th floor, and the slabs were at the 26th floor. The measured frequencies at that time were f1 = 0.65 Hz, f2 = 0.82 Hz, and f3 = 0.99 Hz, corresponding to 23%, 12%, and 16% higher than the design values, respectively.
The design engineers reduced the FEM model to the state of the DC Tower 2 on 04.11.2024 and calibrated it to match the measured frequencies, including the actual stiffness. They did this by increasing the Young modulus of the tower core's concrete by 20% and applying rigid soil constraints.
They then expanded the FEM model, allowing them to determine the natural frequencies of the DC Tower 2 in its final state. The engineers predicted the final actual stiffness of the tower with high accuracy, and the final predicted frequencies were f1 = 0.21 Hz, f2 = 0.3 Hz, and f3 = 0.39 Hz, by accounting for dead and live loads; and f1 = 0.25 Hz, f2 = 0.37 Hz, and f3 = 0.47 Hz, by accounting only for dead loads.
The wind engineers received the predicted frequencies of DC Tower 2 and computed the top acceleration in its final state. Over 10 years, the expected top acceleration of the tower was 1.11% g, which did not exceed the 1.5% g limit.
Notably, the top acceleration expected at the design stage was reduced by 30% considering its predicted value obtained from the proposed framework. This prediction showed that a passive tuned mass damper (TMD) was no longer required, thereby saving installation effort and costs.
To be on the safe side, the engineers also made a control of the prediction. They further refined the calibrated and expanded FEM model to predict natural frequencies at various tower states, verifying these values against measurements taken every two weeks until the project's completion. They showed a continuous good agreement.
Results - final stage
The results obtained in the frequency domain for the final state of DC Tower 2 included the natural frequencies and corresponding damping ratios at the end of construction, as well as the vibration shapes, displayed in a 3D view.
The natural frequencies, identified by the digital twin model built in ARTeMIS OMA, considering the acceleration records of the S1-S12 sensors on 31.05.2025, were f1 = 0.26 Hz, f2 = 0.39 Hz, f3 = 0.48 Hz, f4 = 1.15 Hz, and f5 = 1.30 Hz, when accounting only for dead loads. The vibration modes observed in the final state were practically identical to those determined during construction.
It was also possible to observe the actual top acceleration in the time domain, identify its maximum value, and visualize the tower’s corresponding deflection in a 3D view using the digital twin model. Given that the X-axis was the critical direction of the tower core, the engineers considered the maximum top acceleration in the X direction.
On 31.05.2025, the maximum wind speed recorded by the weather station was 9.9 km/h, corresponding to very low vibrations of DC Tower 2. Therefore, the engineers decided to observe the top acceleration at higher wind speeds. In fact, the maximum wind speed of 46.08 km/h, recorded on 25.06.2025, was considered to evaluate the top acceleration in the X direction.
The S12 sensor recorded the top acceleration in the X direction at 14:59, with a value of 0.011m/s2, significantly below the 1.5% g limit of 0.147 m/s2, corresponding to a 10-year return period wind. The tower deflection corresponding to the maximum top acceleration recorded in the X direction on June 25, 2025, is displayed in the graph below.

) and the corresponding deflection (b).")
Result discussion - final stage
The natural frequencies obtained by the engineers at the end of tower construction, accounting only for structural loads, matched the predicted values. The prognosis, based on the framework that couples real-time measured data with the digital twin model of DC Tower 2 during construction and the calibrated expanded FEM model, was accurate. This accuracy enabled the engineers to predict the final natural frequencies (i.e., the tower's stiffness).
The engineers considered the predicted top acceleration of 1.11% g, obtained from the final-state predicted and verified natural frequencies, to be accurate and reliable. The design value decreased by 30% for a 10-year return period wind, as predicted by the developed framework. Moreover, the expected top acceleration, corresponding to a 10-year return period wind, cannot be directly compared with the one recorded in the final state of the tower for a wind speed of 46.08 km/h.
Nevertheless, due to the excellent match between the measured frequencies and the predicted values, engineers affirmed with high reliability that the DC Tower 2 top acceleration induced by dynamic wind effects for a 10-year return period did not exceed the 1.5% g limit required to ensure resident comfort in the upper-floor apartments This affirmation allowed rejecting of the option of installing a passive tuned mass damper in the DC Tower 2 and significantly reduced the building cost by two million EUR.
Conclusions
The novel framework, which coupled real-time monitoring with a digital twin model of DC Tower 2 during construction, predicted the tower's final natural frequencies and stiffness. Engineers applied the tower acceleration records from real-time monitoring to the digital twin model, which they developed in parallel with the tower's construction.
The digital twin model enabled engineers to determine the tower's relevant natural frequencies (f), the corresponding damping ratios (ζ), and mode shapes of the tower in real time. The chosen configuration of the sensor locations helped them to identify not only bending but also torsional vibration modes. The natural frequencies decreased with increasing tower height until the tower reached its final state.
Namely, the first natural frequency, bending in the weak X axis, recorded for ¼ tower height was 1.06 Hz, and the one recorded for the final state was 0.26 Hz. The shape of the first three vibration modes — the bending in X, torsion with respect to Z, and bending in Y — identified by the digital twin model for ¼ tower height, remained practically the same until the end of construction. An additional two modes were visible by the digital twin model from three-quarters of the tower height.
The developed framework was essential for the design engineers to calibrate the ¼-tower FEM model to the actual frequencies determined by the digital twin, accounting for measurement data from the first three sensors installed at ¼-tower height. After calibrating the FEM model, they extended it to predict the final frequency and amplitude values.
The projected frequencies in the tower’s final state matched those obtained by the engineers from the recorded data at the end of its construction. It proved that the natural frequencies (i.e., stiffness) of the tower expected at the design stage were lower than those in its real state. The final frequencies, predicted at ¼ tower height, were also provided to the wind engineers to evaluate the top acceleration accurately.
The engineers reduced the top acceleration they predicted at the design stage for a 10-year return period wind by 30% compared with the value indicated by the developed framework. It rejected installing a passive tuned mass damper in DC Tower 2, saving on installation costs and effort.
The engineers also investigated the damping obtained from the digital twin model throughout tower construction, from the initial state to the final state. The damping values showed dispersion around average values of ζ1 = 2.1%, ζ2 = 1.0%, and ζ3 = 1.0%, in agreement with the assumed values at the design stage of the DC Tower 2.
Sources
Real-time Monitoring Coupled with Digital Twin Model for Vibration Analysis of DC2-Tower. By Luz Elizabeth Vasquez Munoz, Herbert W Müllner, Christian Rauch, and Michael Reiterer. Proceedings of the 19th D-A-CH Conference, Vienna, Austria, September 2025.