


Testing Load Cell Tension and Compression for Accurate Rocket Thrust Measurement
Chris Derks
Inholland University
September 3, 2025
Under the motto ‘In Thrust, We Trust’, the students of the AQUILO rocket team from Inholland University are pioneering hands-on aerospace innovation. They design and test advanced sounding rockets. To enhance thrust measurement accuracy, the team explores the performance of S-type load cells under both tension and compression. By integrating Dewesoft’s SIRIUS DAQ and software into the test setup, the team captured and compared force measurement data in real-time.
Testing a motor design is arguably one of the most essential tasks in the field of rocket engineering. Launch day may not seem risky, but motor testing remains critical. Comparing actual thrust to theoretical predictions helps ensure the rocket engine is reliable and well-built. One of the most vital measurement tools for this is the tension and compression load cell.
The load cell, or more specifically, the S-type load cell, is intended for use on a jet engine test stand. Currently, the team is developing a horizontal version instead of a vertical one. A horizontal setup offers several advantages over a vertical setup in terms of accurate measurements.
It may be worth investigating whether applying a tensile force to the load cell is more effective than using a compressive force. Tensile loading is a method traditionally favored by engineers. This question arises from the idea that the geometric shape of the S-type load cell may enable more accurate measurements of tension than of compression.
The AQUILO rocket team
The AQUILO rocket team began in 2014 as a graduation project at Inholland University of Applied Sciences in Delft. It has since evolved into a dynamic collective of student Aeronautical engineers dedicated to advancing rocketry through hands-on innovation and interdisciplinary collaboration.


Specializing in the design and construction of lightweight sounding rockets, the team utilizes advanced composite materials. These include carbon fiber and fiberglass to optimize structural performance and efficiency.
Over the past decade, AQUILO has developed and launched a series of rockets, each version built upon improvements derived from lessons learned during previous missions. Notably, the team undertakes in-house development, including the design and fabrication of their rocket motors, which sets them apart from many student rocketry groups.
Structured into several departments: Structural, Electronics, Propulsion, Recovery, and Marketing, each department is interdependently responsible for designing and testing. With a diverse team of over 50 students from more than 20 nationalities, the group embarks on a mission to achieve both educational growth and pursue excellence in the aerospace field.
With the development of AQUILO IX, AQUILO is preparing for participation in the European Rocketry Challenge (EuRoC) 2026, to compete in the prestigious three-km altitude category.


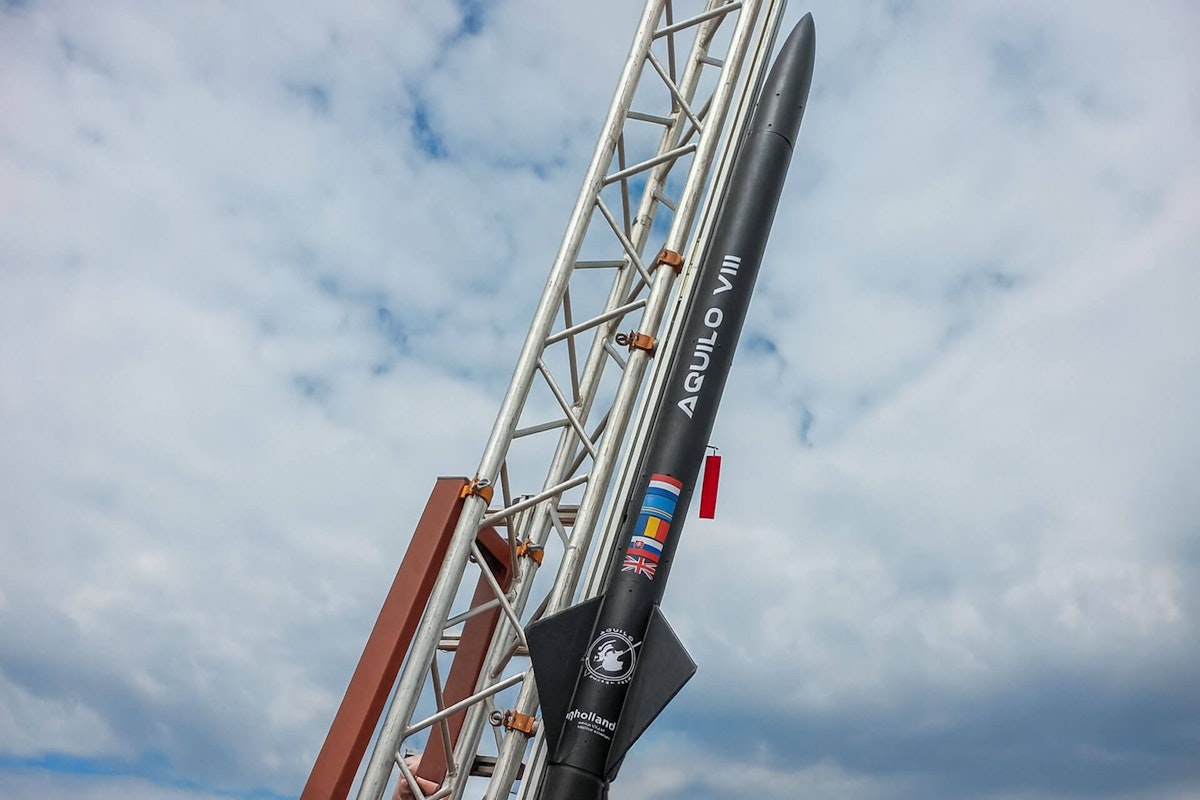
AQUILO VIII.VS - 3rd (Re)launch - March 2025
| Apogee | Mass | Diameter | Motor | Max Thrust | Total Impulse | Launch Date |
|---|---|---|---|---|---|---|
| 1162 meters | 11534 grams | 116 mm | RM-37 | 1014 N | 1942 Ns | 31/03/2025 |


Experiment on S-type load cell
For a thorough evaluation of the force sensor (force transducer), the initial phase focuses on testing an S-type load cell under controlled conditions. The objective is to compare its performance under both tensile and compressive loading. And with a particular focus on measurement accuracy and repeatability.

.")
This test will assess whether it is worthwhile to design the horizontal test stand in a way that converts thrust forces into tensile forces rather than compressive ones. The results will offer valuable insights into whether applying a tensile or compressive force yields more reliable data. This knowledge is a critical factor to consider for future integration into horizontal test stand configurations.
Testing setup
We designed the test setup to evaluate the performance of the S-type load cell when subjected to forces in both pulling (tension load cells) and pushing (compression load cells) directions.
We applied the force in a controlled manner to both a 200 kg and a 1000 kg load cell, recording the load cell readings to assess any differences in accuracy or consistency.
We connected the load cell to the Dewesoft SIRIUSie-8xUNI+ DAQ system and collected data using DewesoftX software. To ensure clear data collection during testing, we created a custom setup.


Hardware and software used
The complete test setup consisted of the following components:
SIRIUSie-8xUNI+ data acquisition system provided by Dewesoft. It can measure up to eight universal signal inputs such as voltage sensors, strain gauges, IEPE accelerometers, and others.
DewesoftX data acquisition and signal processing software with a Custom Aquilo static fire setup.
S-type load cell 200kg.
S-type load cell 1000kg.
We performed the data acquisition in both loading conditions, and the results were processed to ensure the reliability of the test.
To validate the suitability of the load cell for integration with the horizontal test stand, we gave particular attention to the comparative analysis of output values between tension and compression.
This comparison is crucial for concluding the test, specifically whether tensile or compressive loading is more accurate and stable, considering the mechanical characteristics of the S-type geometry.


Testing results
After a specified period of experimentation, we applied tensile and compressive stresses. Here, the peak amount is what we’re interested in.
During the testing, I noticed that for this case, only the 200 kg load cell is sensitive enough to detect small loads. Therefore, from this point forward, I will only present the results from the 200 kg load cell and, ultimately, provide a brief comparison with the 1000 kg load cell for reference.


This information doesn’t tell us much, except for a graphical representation of the direction of the different forces. Including this is beneficial since it confirms the correct settings of the load cell, i.e., the direction of our force.
If we examine the differences between the various load cases, we specifically want to focus on the difference in peak load, as that is what we’re looking for. Typically, engineers design a rocket engine for its peak load case based on its mission. Therefore, we zoom in on the graph and select the highest value for comparison. The tensile value is 0.09482 [N], and the compression value is 0.21339 [N].

.")

.")
To verify this difference, we now examine the 1000 kg load cell. Where there is a tensile force of 0.02821 [N] and a compressive force of 0.04271 [N]

.")
.")
Using a low-pass filter
Throughout the experiment, I also examined whether the signal display setting in the channel setup on the oscilloscope would have any effect on the overall setup. This setting was crucial to assess. Without a proper low-pass filter, the electrical signal could become highly distorted, resulting in poor results. To address this and achieve a more stable signal, thereby yielding more reliable data, I applied a 40 kHz low-pass filter.
After comparing the test results, I found that this had little effect on the outcomes. As a result, I conducted the main tests without the filter in place. Nonetheless, observing the differences between various low-pass filters was informative and may prove helpful in future experiments.


Conclusion and recommendation
There is a performance difference between tension and compression in the S-type load cell. In this experiment, the 200 kg S-type load cell showed a difference of approximately 76.94% in favor of compression. The 1000 kg S-type load cell also exhibited this effect, but to a lesser extent, with a 40.93% advantage for compression.
These findings suggest that the load cell's performance can vary significantly depending on the direction of the applied mechanical force and its rated capacity. This variation has significant implications for the use of load cells in various test stand configurations.
We considered one key factor when designing horizontal test stands or integrating load cells into a test system: Determining whether tension or compression delivers more accurate and reliable readings for the specific load cell model and its rated capacity.
I recommend further testing with additional load cells of varying ratings to determine whether this trend continues as stiffness or rated capacity increases. Such testing would help inform better decisions when designing thrust measurement systems for rocket jet engine tests or similar specific applications.
The geometric shape of the S-type load cell may not solely cause the difference in response to tensile and compressive forces. Instead, the stiffness of the material relative to the load cell’s maximum capacity may influence this response.
For example, the 1000 kg S-type load cell responds differently to tension and compression compared to the 200 kg model. Consider this variation carefully when designing the test stand.
To gain more confidence and precision in these findings, I strongly recommend further investigation. This investigation should include testing load cells with capacities higher, lower, and between the 200 kg and 1000 kg models. The goal is to determine whether the observed trend—from 76.94% down to 40.93%—continues across other capacities.