


Data Acquisition for Rocket Engine Static Fire Test
Álvaro Teijeiro Montoro, Leonardo Javier Martínez Robles, Alberto Pérez Gallardo
Faraday Rocketry UPV, Polytechnic University of Valencia
August 11, 2025
Ensuring the safe and efficient operation of student-built rocket engines requires precise and reliable testing. At Faraday Rocketry UPV, a new data acquisition setup utilizing Dewesoft technology was implemented for static fire tests. It captured vital measurements such as thrust, temperature, and vibration. The team enhanced their propulsion development with modern DAQ solutions for high-impact results.
The aerospace industry, specifically the rocketry field, involves complex design, extensive testing, and operation of the systems that propel launches. Data acquisition (DAQ) is crucial in this domain, particularly during ground testing and flight experiments. Propulsion systems must perform flawlessly under extreme conditions, and the data collected throughout development is essential to ensuring safety, efficiency, and performance.
Data acquisition in rocket propulsion faces several unique challenges. The sensors must function in harsh conditions—exposed to intense heat, vibration, and electromagnetic interference—requiring robust and resilient equipment. High-speed data capture is another essential requirement, as the dynamic nature of combustion and thrust generation demands high sampling rates.
Furthermore, to integrate multiple sensor types, such as thermocouples, pressure transducers, and accelerometers, precise synchronization is required to ensure that all data points temporally align for meaningful analysis.
We set out to explore the use of advanced Dewesoft hardware in a static fire test context and review our previous approaches to collecting thrust and temperature data, as well as the challenges these present to our Propulsion Department.
We applied an acquisition system based on SIRIUS hardware and DewesoftX software. We analyzed and post-processed our fire test results to compare the new system’s operability, feasibility, and reliability with those of our previous acquisition systems.
Faraday Rocketry
Faraday Rocketry UPV established itself in 2021 as the first rocketry university team at the Polytechnic University of Valencia (Universitat Politècnica de València (UPV)). Hosting 40,000 students, the university focuses on science, technology, and the arts.
The rocketry team comprises more than 40 students from various programs at the Polytechnic University of Valencia. Since its inception, the team has successfully developed several sounding rockets, including Aspera and Astra in 2022.
Notably, Astra participated in Europe’s most prestigious sounding rocket competition, the European Rocketry Challenge, EuRoC. In 2023, the team competed in EuRoC with another rocket, Genesis, which won the Flight Award.
The team is currently engaged in two ambitious projects. The first, Origin, is a two-stage rocket expected to achieve an apogee exceeding 10 kilometers and is scheduled for launch next year. The second project, Skybraker, is a single-stage modular rocket intended to compete in this year’s EuRoC edition.

 10,000 m.The coming two-stage rocket, Origin. Weight 17.4 kg, length 2.8 m, speed 2.5 Mach, and expected Height Above Ground Level (HAGL) 10,000 m.")
A reliable and robust propulsion system is essential to ensure the successful launch of these rockets. In this regard, the Propulsion Department plays a critical role, ensuring that the rocket motor meets the necessary thrust and total impulse requirements without affecting other components. Our task includes maintaining vibrational compatibility with elements such as the airframe and avionics bay, respecting weight limits, and performing these tasks without thermally compromising the rocket.
In the team's first years, the Propulsion Department relied on Commercial-Off-The-Shelf (COTS) motors. We bought those motors from specialized manufacturers, which offered a moderately cheap and reliable source of rocket motors. As the team grew, so did its propulsion requirements and ambitions. To achieve its objectives while upgrading its knowledge and capabilities, the department initiated a project to develop a Student-Researched and Developed (SRAD) rocket motor, designed, manufactured, tested, and certified by our team members.
The issue – critical data
Static fire tests are one of the most, if not the most, critical steps to reach a safe, reliable, and successful SRAD rocket motor development. The test consists of a controlled static ignition of a fully mounted prototype in a workbench designed by the team for that purpose.
The primary objectives of these tests are to gather valuable data regarding thrust, surface temperature, and vibrational information about the rocket motor's nominal operation. Furthermore, we intend to post-process the obtained information to determine the total and specific impulse, as well as the motor’s natural frequencies.
Basic theoretical physics concepts explain how we implemented the acquisition system, as well as the issues related to the data display, including the difficulties and its limited range of use.


Thrust and vibration measurement concepts
Thrust is the force that propels a rocket, aircraft, or any object forward. It is generated by expelling mass in the opposite direction, by Newton’s Third Law of Motion: for every action, there is an equal and opposite reaction.
In rockets, propellant (a combination of fuel and oxidizer) produces thrust when it burns and ejects at high speed through a nozzle. The faster and the more mass expelled, the greater the thrust.
Thrust-related formulae
Total impulse is a measure of the total momentum change delivered by a rocket engine throughout its burn. It tells you how much push the engine produces in total, not just at any one moment.
Total impulse IT is the thrust force F (which may vary over time) integrated over the time t:
Where:
= Total impulse (in newton-seconds, N·s)
= Thrust as a function of time (in newtons)
= Burn time (in seconds)
This measure is, in essence, proportional to the total energy released by the propellant.
Additionally, specific impulse represents the thrust per unit propellant “weight” flow rate:
Which, for a solid rocket motor, can be represented as:
Where:
= specific impulse [s]
= total impulse [N·s]
= total weight of propellant [N]
This magnitude represents the number of seconds a rocket engine can produce 1 newton of thrust using 1 newton of propellant weight. It is a normalized performance value that enables engineers to compare propulsion systems easily.
Where g0 is the gravitational acceleration value at sea level, which is approximately 9.81 m/s². The formula converts between mass (in kilograms) and weight (in newtons). The m is the propellant mass flow rate, meaning fuel (in kilograms) burned per second, and w is the propellant weight (mass × gravity). This value serves as a figure of merit for the performance of any rocket propulsion system, much like the concept of liters per 100 kilometers, applied to automobiles. A higher value often indicates better performance.
Vibrations concepts
The only measurable magnitude related to the motor’s vibrations is the accelerations suffered by its surface. To determine the vibration frequencies, which are essential for assuring structural compatibility with other elements, we transform data from the time domain to the frequency domain. We perform this transformation using the mathematical tool known as the Fourier Transform, which breaks down a signal, often a function of time, into its constituent frequency components.
Computers use the so-called Fast Fourier Transform (FFT) to calculate the Fourier Transform. This efficient algorithm, combined with other tools, such as windowing and Short Time Fourier Transform (STFT), can accurately approximate the value of the Fourier Transform for a given number of samples with a relatively small number of operations.
The previous setup
The setup of the previous acquisition system was composed of the following sensors:
A Kistler piezoelectric force sensor (model 9103C).
Two general-purpose Thermocouples.
We connected the force sensor to one externally powered and analogically calibrated amplifier, using a ruler to change the sensitivity according to the sensor. Then, the amplifier generated a voltage signal, which it transmitted to a Kistler acquisition system via a BNC cable.
This acquisition system sorted the data obtained from the sensor and directed it to the PC, where the data was displayed and stored. Then, it would be necessary to process the sensor's data, export it to Excel, and treat it with MATLAB scripts (such as numeric integration and signal filtering).
In parallel, we stored the thermal data obtained with the thermocouples in an external acquisition system. This data had to be collected after the test using a PC; there was no live temperature information display.
Setup challenges
This setup featured several key flaws that made data acquisition a challenging and somewhat unreliable task:
Complex setup labor and noise on the signal
The system linked several components and concatenated connections of different kinds (sensors, amplifiers, DAQ system, and PC), which complicated the setup labor and introduced noise to the signal.
Uncertain sensitivity and signal drift
Using analogically calibrated amplifiers increased the uncertainty of the sensitivity. Additionally, the external alimentation of these amplifiers introduced a significant and continuous signal drift that altered the DAQ system’s output throughout the entire test. This error was inevitable, even with an offset. Finally, we had to connect them 24 hours before the test to “warm up” them, introducing an extra level of difficulty.
Not able to visualize
As the data was raw, recorded with the Kistler DAQ system, we could not measure, visualize, or treat it with an implemented tool. Therefore, the design of several post-processing MATLAB scripts required deep code knowledge, although the measurements were not highly accurate, as the scripts were somewhat rudimentary. Furthermore, a previous Excel reorganization was required, introducing another step to the already extensive list of assignments.
The new setup
As we have studied the previous DAQ implementation, the main objective is to solve the following problems:
Reduce the system’s complexity to reduce noise and obtain a more straightforward assembly.
Improve the reliability of the amplifiers and adapter while reducing the noise generated by the external power supply.
Enhancing the post-process labor, upgrading the data storage, visualization, treatment, and numerical methods.
Our ultimate goal was to create the best possible acquisition system, enabling the team to reach the full potential of each engine test performed. To this end, the Propulsion Department decided to migrate its DAQ system to the Dewesoft option, providing us with reliable data acquisition hardware and software.
Measurement equipment
Data acquisition system
The Sirius module serves as the primary component of our system. It processed the sensors' signal and transferred it to the computer on which we had downloaded the software. This model is ideal for our testing, as it incorporates numerous inputs for the sensor, along with a modular design that facilitates easy modification. The modularity allows us to expand the setup with additional modules as needed easily.
These are digital amplifiers. They receive alimentation from the Sirius DAQ system.
We used DSI adapters to connect sensors to the SIRIUS unit.
Sensors
Located in the upper part of the engine, it records the thrust generated by the motor.
3x Type K Thermocouples
Three thermocouples are strategically placed along the engine's longitudinal axis, enabling temperature readings at the desired locations.
Used to measure vibrations during the engine test.


, (2), and (3), and force sensors (4). Note that the accelerometer can be placed at any point on the casing and in any orientation, depending on the type of vibration we want to measure.")
Software
We utilized the DewesoftX, which performed flawlessly, seamlessly integrating all our robust sensors and acquisition systems, allowing the team to extract the full potential of the hardware used. This software enables deep display, processing, and several personalization layers, making it suitable for almost any situation, setup, and requirement.


Measurement and analysis
The rocket motor static fire test is a grounded firing of a rocket engine to assess its performance, reliability, and safety. The testing involves careful preparation, sensor instrumentation, data acquisition, and post-test analysis to validate or improve the motor design.
We build a strong, secure structure to anchor the motor in place and withstand its thrust. We installed the sensors to measure: thrust, temperatures in engine components, and vibrations.
Our safety systems include blast shields, remote control, fire suppression, and emergency shutdown protocols, as well as several layers of redundancy for the ignition mechanism.
Our high-speed synchronized data acquisition system captures and logs all measurements. In the DAQ software, we first set up the channels and define displays to be on screen during the motor testing – see Figures 11-15. Once we have prepared the test setup and everything is in place, we start the recording and activate the engine.
When the ignition has ended, we keep the recording running for a few minutes to ensure that we have reached the maximum temperature, as the heat transfer to the casing is not instantaneous and continues to increase after turn-off.
Finally, we stop recording and proceed to analyze the recorded data.


Figure 6 illustrates the setup of the measurement channels, including the analog inputs and math post-processing channels, used for the analysis. Overall, the channels of our interest are:
Analog channels
AI1
This channel records already amplified data from the force sensor.
AI3, AI4, and AI5
Here is where the thermocouples are connected (1, 2, and 3, respectively). See Figure 4.
AI6
We used this input to obtain the accelerometer data.
Figures 3 and 4 show the position of each sensor and the DAQ system inputs.
Offline math channels
Thrust
It filters the AI1 channel, stabilizing the signal and deleting noise. The filter used is an IIR filter, using a high-order low-pass (40 Hz) variant of the Butterworth method to delete unwanted noise. This channel provides our reference data stream for the rocket motor thrust.
The figures 7 to 10 demonstrate the filter’s effectiveness.


Thrust/MAX
Stores the highest “Thrust” read.
Total Impulse
Integrates the filtered thrust signal over time, giving us the rocket's Total Impulse. This channel utilizes several sub-channels created to start and stop the integral measurement.
Specific Impulse
Taking advantage of the formula explained in the theoretical concepts chapter of this document, we use the DewesoftX “formula” tool to obtain the Specific Impulse of the rocket motor.
AI6/Filter
A low-pass high-order IIR filter is applied to the accelerometer channel again. Here, filtering the signal is even more crucial for accurate data treatment, as failing to delete noise vibrations may significantly alter the FFT results, leading to incorrect natural frequencies. Figures 9 and 10 illustrate the operation of the filter.


Measurement visualization
Furthermore, we divided the visualization into five display screens: 1) General Display, 2) Thrust Display, 3) Temperature Display, 4) Vibration Display, and 5) Post-Process Display. Figures 11 to 15 illustrate these.


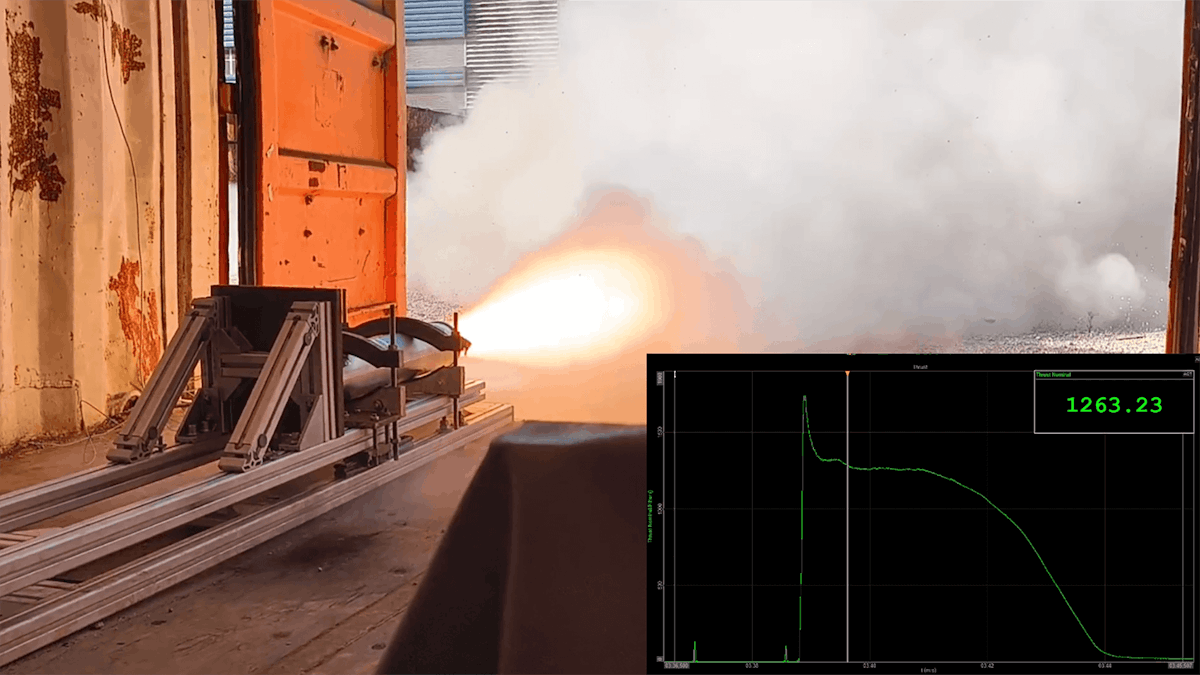
General Display: gives an overview of the motor status. It contains a thrust display and a digital meter, displaying the maximum reading of the sensor at the time. Furthermore, it shows a video display and six general-purpose digital meters, three of which are used for temperature channel readings, displaying the actual readings.


Thrust Display: emphasises the thrust recorder, where we overlap the AI1 channel raw data with the real-time filtered data. Additionally, it displays a horizontal bar as an alternative representation of the maximum thrust, along with the maximum thrust reading as a digital meter.

Temperature Display: Is intended to display all temperature-related information, featuring a graphic and several digital meters to that end, each one related to a specific thermocouple.


Vibration Display: It encompasses all the vibrational information. Here, we utilize both time and frequency domain graphs applied to the AI6/Filter Channel to visualize how the engine generates vibrations over time. Also, there’s a digital meter to measure actual acceleration.


Post-Process Display: Shows all the information related to the thrust-related calculations. Under the thrust and filtered thrust register, we find three digital meters, displaying the maximum thrust, the actual Total Impulse, and its corresponding Specific Impulse.
Results
Table 1 and Figure 16 present our results.
Force – test results
| Measurement | Value |
|---|---|
| Maximum Thrust | 1641 N |
| Total Impulse | 4081 N·s |
| Specific Impulse | 172.06 s |
The rocket motor delivers the expected values of force thrust, with a thrust curve similar to the theoretical and simulated ones. The fact that the Total and Specific Impulse are close enough to the ideal values allows us to certify our motor for its intended mission, meeting the team’s requirements.
Furthermore, the measurements verify the trustworthiness of our propellant manufacturing process. Our Propulsion Department produces the propellant throughout every step of the manufacturing process. This result will be essential to future motors and propellants.
The rocket and its components do not surpass the threshold temperature (100 ºC) at any point. Figure 16 shows that even at its maximum, the temperature did not reach this value. This fact ensured that the heat doesn’t compromise the thermal integrity of the rocket's structure.
Regarding vibrational results, it is worth noting that due to the motor's characteristics, the vibrations were transient, changing over time. However, we can discard the ignitor pulse, as well as the first moments of the motor’s ignition, since the duration of such vibrations is negligible. So, we only accounted for the “steadiest” section of the thrust curve. Figure 15 illustrates the vibration data.

Taking this graph into account, we can determine the frequencies at which the motors vibrate. Approximately, we have four peaks, at around 425 Hz, 730 Hz, 1470 Hz, and 1935 Hz, with the last two being the more relevant ones due to their high frequency and amplitude.
Conclusion
The results of this test were astonishingly precise, aligning closely with previously run simulations using specialized software. The information obtained was vital for further technological development in the department. Finally, this new setup allowed us to measure and certify the motor’s positive and nominal behavior. It provided us with all the necessary information to characterize the motor and validate its flight readiness.
As stated, the previous setup had some flaws that needed improvement. Thanks to Dewesoft’s technology, we were able to unify the entire system into a single platform, making the department’s work significantly easier. The whole department has widely adopted Dewesoft’s technology, with team members noting a noticeable improvement in their day-to-day workflows and testing processes, as well as a relatively smooth learning curve.
The intuitive software interface, combined with robust and modular hardware, has created a smoother, more integrated working environment. As a result, the team is now better equipped to tackle more demanding projects with confidence. Looking ahead, Dewesoft’s advanced tools will continue to support the team in meeting the challenges of developing more powerful and sophisticated rocket engines, enabling them to unlock their full potential.