


Monitoring Structural Vibrations from Quarry Blasts in a Family Home
Andraž Bregar, Mathematics Student
University of Ljubljana
May 28, 2025
Vibrations from a nearby quarry can significantly affect the structural health of residential buildings and their occupants. In this student project, I installed a simple yet effective vibration measurement setup in a family house near a quarry and a busy road. Over three weeks, the Dewesoft system recorded vibration data in the house. The results showed short but intense spikes from quarry explosions, exceeding international safety limits for human exposure by more than 30 times.
Vibrations are all around us. They affect us in our everyday lives, sometimes having a pleasant effect, and occasionally, an unpleasant or, to some extent, harmful one. The same applies to buildings, but to the extent that vibrations can typically deteriorate the structure of the building. Many houses are constructed near busy traffic roads or in proximity to facilities that can be harmful to humans and buildings.
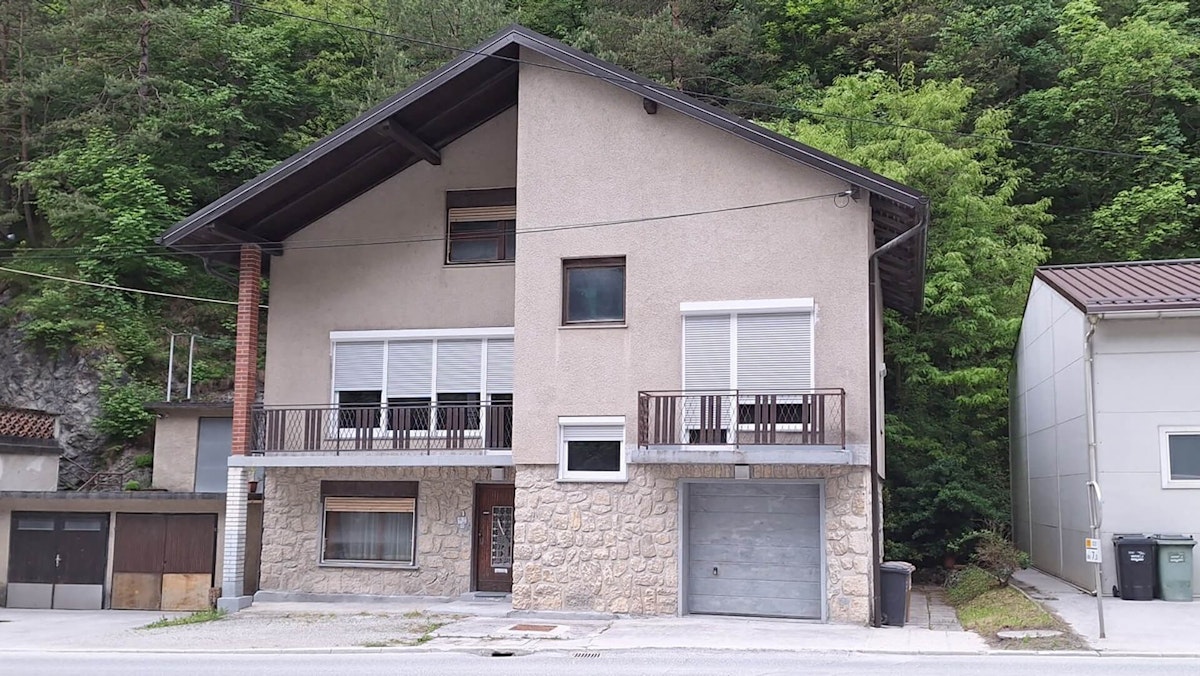
I set up a quick vibration measurement in a family house near a quarry and a busy road (used by construction activities), frequently used by speeding lorries. The goal was to see if the measured vibrations stayed within safe limits and whether living in the house was healthy.


The equipment
The idea is to use a basic, cost-effective three-axial accelerometer fixed on the house’s wall. Since this is a measurement of the structural health of the building, I am using a Dewesoft IOLITEi 3xMEMS-ACC device.
The IOLITE-3xMEMS devices combine a triaxial MEMS accelerometer and an ADC converter with an EtherCAT data interface. It is well-suited for measuring static vibrations and has a very low noise level over the frequency range from 0 Hz to 1000 Hz, making it ideal for structural monitoring.
The measurement setup
The setup is nothing special. I use the latter sensor/DAQ device connected to the DewesoftX software for data recording and analysis of measured signals.


The issue arises when deploying the sensor. How and where to mount it? I chose to fix it with double-sided tape on a living room wall. The ideal scenario would be to drill holes in the wall and mount the sensor directly. This procedure would yield the results with minimal errors, but I did not want to damage the wall, so I taped the sensor to it. The tape should work because I do not aim for 100 % accuracy.


After setting up the sensor, I connected it to the DAQ device, a simple IOLITE Modular, and connected the accelerometer to the computer using Ethernet cables.

The last thing left was configuring the system correctly in the data acquisition and signal processing software, DewesoftX. The connection of the sensor/DAQ device is straightforward with the plug-and-play functionality. I used the built-in configurations of the available accelerometer channels.
First, I had to choose the connected sensor on the opening page, then set the scaling. I can scale it in several different ways. In my case, the IOLITE-3xMEMS device comes with a TEDS-equipped sensor (Transducer Electronic Data Sheets) chip. I selected this option when calibrating it in DewesoftX, and the software automatically takes care of all the configuration.
Then I selected one of the available channels and checked if the units matched.


I wanted to measure acceleration by choosing the unit in g’s, Earth’s gravity, so all the data will be a factor of g. The last step before measuring was to select the bandwidth. Since I was measuring a very low-level frequency, I selected the minimal possible bandwidth of 50 Hz. I quickly checked if the sensor worked, and after that, I was all set up and ready to start collecting data.


The measurements
My measurements lasted for around three weeks from January 25 to February 14. I chose this interval to capture as many different quarry activities as possible. The primary concern was the quarry explosions, which the operators use to break up large boulders.
The impact of the blast and, of course, the blast vibrations can have a detrimental effect on my nearby structure. When such explosions happened, and how many were there, can easily be seen as large spikes or deviations in the data collected.
My interest was not only focused on these explosions but also on road traffic and vehicles (usually heavy machinery) driving by. I therefore chose an extended interval with long-term continuous monitoring to see if the vibrations of cars differ by time.
However, as expected, the vibration caused by vehicles was minimal, and so was the effect on the building's health, the health of its residents, and the surrounding environment.
The actual human effort when it comes to performing the measurements was minimal. I only had to check whether the setup acquired data once daily.
One of my fears was that the IOLITEi 3xMEMS-ACC sensor could unstick from the wall and fall on the floor, but that did not happen. The double-sided tape was more than strong enough. Another question was whether the DAQ was still collecting data. However, I encountered no practical or technical troubles or difficulties during the measurement process.
I stopped recording on February 14, saved the data, and cleared the “workspace”, concluding the measuring part of my task. What awaits me further is a more thorough data analysis and comparison with government-defined vibration boundaries.
Data analysis
Figure 11 shows the measured vibration data in bright green colour. All the following figures indicate specific calculated values from the original data in lime green.


When I began analyzing the collected data, the first step was to calculate the RMS (Root Mean Squared), with the following formula:
This value derives from the equation below, where T represents the full time interval and a²(t) is the square of the acceleration. RMS is a key parameter because it reflects the energy and average vibration a person would experience.
I’m not focusing on the human body vibration measurements in this case. Still, the RMS is relevant as it relates to the volume of energy affecting the house and the potential harmfulness of the vibrations.

Secondly, I calculated the maximum, which I will use to make a quick estimate later.


Lastly, I calculated the crest factor. This number signifies the number of peaks in a wave, but more empirically, it tells me the number of impacts of interest, meaning the quarry explosions. Figure 12 shows that there were three quarry explosions within that period.

Figure 15 displays all my measured and calculated data neatly presented in DewesoftX. On the upper left is the original data, on the upper right is the maximum, on the bottom left is the RMS, and on the bottom right is the crest factor.

ISO 2631-2:2003 is an international standard for evaluating human exposure to whole-body vibrations and shocks in buildings, focusing on comfort and annoyance in the 1 Hz to 80 Hz frequency range. I quickly calculated to check whether the measured vibration levels in the house complied with this standard.
I use a recorder graph cursor to identify the highest point on the maximal values graph, which I denote as a=0.0548g. As I am only interested in its value, not direction, I multiply that number's absolute value by the value of g, as I want it in meters per second square.
The standard gravitational acceleration, g, is approximately 9.81 m/s². So the calculation becomes: a′ = 0.0548 × 9.81. The result is a′ = 0.5376 m/s2. I then consult with the ISO 2631-2 standard and check the peak vibration level limit: It is around as = 0.015 m/s2.
Now I compare the two values a′ and as, and observe that the actual value is more than thirty times bigger than the prescribed value. I must remember that this is a very rough estimate, and I apply this method to an event that does not last long.
A similar calculation can be performed using the standard ISO 4866:2010. This standard, titled Mechanical vibration and shock – Vibration of fixed structures, provides guidelines for measuring vibrations and evaluating their effects on structural damage.
Conclusion
In conclusion, I measured and analyzed the vibration in the house caused primarily by quarry explosions. I understood that in the moments of these explosions, the peak vibrations are more than thirty times larger than they should be.
A peak vibration of 0.5376 m/s² is exceptionally high for a residential structure. Though the explosions quickly fade away, the energy stored in the vibrations caused by them carries immense amounts of energy far above acceptable limits for human comfort or structural health as outlined in ISO 2631-2. Still, luckily, they don’t last long.
However, over time, repeated exposure to such vibrations, even if short, can damage the house, cause microcracks in plaster, walls, or foundation, and weaken its structural integrity. As established, it potentially causes discomfort, sleep disturbances, and stress, and such vibration harms house residents.