


Experimental Analysis of Tire Behavior on a Hydrogen Vehicle
Team H2politO
Politecnico of Turin
August 29, 2025
To enhance the performance of their hydrogen-powered prototype, Team H2politO from the Polytechnic University of Turin conducted an in-depth experimental analysis of tire and drivetrain behavior. Using advanced Dewesoft data acquisition systems and wireless RFID temperature sensors, the team gathered critical insights into cornering stiffness, side slip, and thermal response. The results will refine vehicle modeling and race strategy for future Shell Eco-Marathon competitions.
Team H2politO is a student team from Politecnico di Torino, the Polytechnic University of Turin. The team is participating in the Shell Eco Marathon Europe-Africa, a competition focused on fuel consumption.
During the competition, the aim is to complete:
11 laps, a total distance of 14.5 km, within a maximum of 35 minutes, and
10 laps, while fuel consumption is measured.
The team that uses the least amount of fuel wins.


The team has two vehicles participating in the two categories:
Combustion Engine Urban Concept (JUNO),
Hydrogen Fuel Cell Prototype (IDRAzephyrus).
Full team members:
Carlo Maria Desenzani, strategy & dynamic division manager
Davide Molina, vehicle manager
Alexander James Valtorta, electronic division manager
Alessandro Zuccotti, mechanic division manager
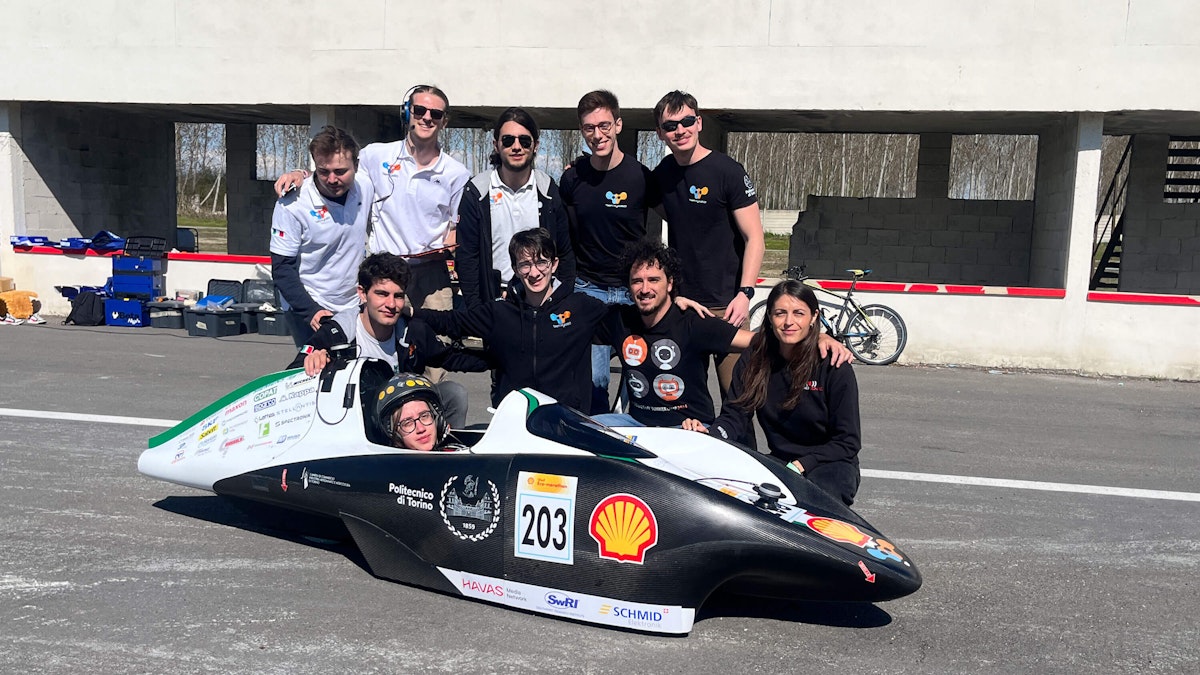
The IDRAzephyrus
Figure 2 shows the Prototype vehicle IDRAzephyrus involved in this project. The IDRAzephyrus vehicle is highly compact and lightweight, but it has no internal space to accommodate heavy or bulky instrumentation. It is a carbon fiber monocoque designed to minimize mass, frontal area, and aerodynamic penetration coefficient.
IDRAzephyrus - The Vehicle characteristics
| Specification type | Value |
|---|---|
| Max Speed | 37 km/h |
| Autonomy | 58 km |
| Cx | 0,08 |
| Propulsion | 500 W Fuel cell with 150 W direct electric motor |
| Tank | Hydrogen cylinder of 0.4 L @ 200 bar |
| Body | Carbon Fiber monocoque |
| Braking system | Disc brakes with separate hydraulic circuits between front and rear |
| Transmission | Direct gear transmission |
| Steering System | Cinematism acting on the front wheels |
| Empty Mass | 32 kg |
| Length | 3009 mm |
| Width | 814 mm |
| Height | 698 mm |
The vehicle’s powertrain consists of a Fuel Cell, an FCCU that includes a DC/DC converter (which controls the charge of a stack of supercapacitors), and a motor controller that powers the onboard PMDC electric motor.
While achieving high subsystem efficiency is paramount to obtaining a competitive result, the strategic approach employed during the competition also plays a significant role.
One of the most critical measurement activities is related to vehicle dynamics, for which we require specially designed sensors. Through this analysis, it is possible to guide developments from both dynamic and structural perspectives of the vehicle.
It is also possible to improve the vehicle simulation both dynamically and energetically. Our team uses this enhanced simulation to develop the optimal race strategy for a specific circuit, its road conditions, and its altitude. This approach ensures the best possible fuel-consumption results.
The Vehicle Dynamics and Strategy division leverages a data-driven methodology to construct a comprehensive car model. This model facilitates the acquisition of crucial information, enabling further refinement and optimization of various vehicle components.


The stakeholders
The project involved the collaboration of several actors, each with a key role within the measurement and data acquisition process. Our team needed to obtain precise and reliable measurements to analyze the prototype's behavior in detail.
To support us in this goal, the Team collaborated with Dewesoft, a company specializing in data acquisition instrumentation.
Dewesoft provided us with a high-performance analog-digital acquisition system, which was essential for collecting signals from the various sensors installed on the vehicle. Additionally, it provided us with the NAVION inertial navigation system and differential GPS antennas. Both are crucial tools for accurately reconstructing the vehicle's dynamics and trajectories under real-life conditions of use.
We received additional technical input from Radio6ense, a company that supplied us with non-invasive, radio-frequency identification (RFID) passive temperature sensors. We were able to place both between the inner tube and the tire, as well as on the stator of the electric motor. These innovative sensors, which were completely battery-free, were activated by radiated waves from a transmitter and, once energized, transmitted data to the transmitter, which then sent the data to Dewesoft's data collector.
Thanks to this solution, we were able to obtain valuable thermal information in previously inaccessible areas of the prototype tire, all captured within a single solution.
The team’s purpose
To develop a racing strategy that optimizes the vehicle’s performance, you need a model that considers the energy aspects of each component. This model must also account for how those components interact with the surroundings. Finally, it should capture the vehicle’s dynamic behavior.
Modeling longitudinal dynamics is relatively straightforward, since the car requires low torque to accelerate. In contrast, modeling lateral dynamics is much more complex. It is therefore essential to achieve a closer match between simulation results and real-world behavior.
Our main limitation is the absence of adequate tools to acquire vehicle data, such as longitudinal and angular accelerations. We have no accelerometer or gyroscope. Therefore, we cannot derive any information regarding the interaction between tires and asphalt.
Until now, for the Team models, some coefficients, such as cornering stiffness, have been estimated geometrically and derived from the car's mass distribution. However, the data obtained by the Team in the past are only approximate, resulting in differences between the real and simulated behavior.
The Team, over the past year, has also worked to gain experience in analyzing and understanding the tire, which, in an efficiency race, is a key component. During some preliminary tests this year, we experimentally measured that an 8 °C change in asphalt temperature can increase drag by up to 14 % with our current tires. This finding underscores the significant impact of surface temperature on tire performance. Hence, we now aim to collect data to analyze this aspect further.
Our objective was, therefore, to monitor the temperature of the tires as well as other hard-to-access components such as the electric motor and the speed reducer. This monitoring was by no means a simple task!
The solution
During the track test, we employed advanced instrumentation from Dewesoft to collect a wide range of heterogeneous data. Specifically, the Navion2 inertial navigation system, the SIRIUS HD 16xLV high-dynamic data acquisition module, and SixSense, an innovative wireless measurement system developed in collaboration with Radio6ense, were utilized.
Given the volume and variety of the data collected, a complete and exhaustive analysis in a short timeframe and from all possible perspectives was not feasible. Therefore, the tests were designed and conducted to build a structured and comprehensive database. This database is a valuable resource for future consultations and analyses, supporting ongoing development and comparison with future tests.
We conducted an initial analysis by observing the interaction between asphalt and tires, aiming to characterize the latter, which is the most complex element within a vehicle.
However, it is not possible to obtain data directly from the tire, so we have to translate the data collected by NAVION2 related to the vehicle body to the two axles. NAVION2 is a highly advanced inertial navigation system.
The system is capable of computing angular and longitudinal accelerations as if it were located at the vehicle’s center of mass, even when physically positioned elsewhere. By inputting the relative position from the center of mass, the system performs the necessary coordinate transformations internally.
The main obstacle in analyzing the vehicle's behavior is the difficulty in obtaining the side slip angle of the car. However, the inertial platform of DewesoftX, data acquisition and digital signal processing software, is capable of calculating this value. Once this is received, it is then a simple matter to obtain the relative geometry of the individual wheels, known to the car, and its angular acceleration along the Z axis.
Having then known the side slip angle and the forces on the body, it is possible to derive the cornering stiffness of the tire.
The bicycle vehicle dynamic model, which represents the front axle with two overlapping wheels and considers the rear wheel as a single wheel, as it already is in the vehicle, was used to analyze the data, allowing for a practical analysis of cornering behavior with a low level of computational complexity that proved effective for our application.
Some effects, such as load shift between axles or camber angle variation, were not considered at this stage. The choice was dictated by the lightweight configuration of the vehicle, with a kerb weight of approximately 30 kg, which renders these effects negligible for the analysis conducted, as the cornering stiffness graph did not reach the saturation zone.
Radio-frequency identification (RFID) utilizes electromagnetic fields to identify and track tags attached to objects automatically. Thanks to the Dewesoft SixSense instrumentation, which applies wireless RFID technology, we were able to easily mount sensors on rotating components, such as the tires, and on hard-to-reach parts, like the electric motor and the speed reducer.
We monitored the temperature data through antennas connected to a receiver via Ethernet, with full synchronization handled within the Dewesoft environment.
Experimental set-up
We carried out our setups on the IDRAzephyrus prototype in preparation for track testing.
Dewesoft Italia provided the following instrumentation:
NAVIONi2 for vehicle dynamics data
SIRIUS HD 16xLV for CAN Bus Data and two potentiometers for the steering angle
SixSense Reader: namely, the RFID reader, operating in the UHF frequency band, is connected to the reader antenna(s) on one side and to a laptop on the other
We placed the inertial platform under the vehicle’s steering column, with distances precisely measured from the car's center of mass using the car's CAD.


The setup used was the default prototype configuration, excluding the fuel cell, and was powered by three LiPo batteries, each with a 12V capacity and 5000 mAh. The boards used in this setup were:
Dc-Dc Converter
Supercapacitor
Power Supply Board
Telemetry Module
Steering Wheel
Steering Angle Sensor
Speed Sensor
Extras: Mobile Phone
The implementation for testing was straightforward, requiring only minor adjustments to the configuration and layout at the front of the vehicle (Figure 4).
The telemetry module was connected to the DAQ via the CAN bus protocol to transmit data generated by the vehicle. We made the physical connection using a male-to-male Micro-Fit cable. A 12 V 5000 mAh LiPo battery, connected through an adapter to banana plug cables, powered the DAQ.


We inserted the tire temperature sensors between the inner tube and the tire. During assembly, we ensured their tightness using scotch tape, and later through the inflation pressure of the inner tube, as seen in Figure 5. The great advantage of these was their small thickness, which allowed us to leave them on the tire surface without altering it.
Two such sensors were mounted on each of the vehicle's three wheels, totaling six sensors. We placed four additional sensors of different types, suitable for mounting on metal surfaces, on the electric motor and the speed reducer, with two sensors each. Along with the sensors, we also placed antennas (see Figure 6) near them to energize the sensors, enabling them to measure and then collect the data they sent.
Figure 7 illustrates the vehicle's preparation in the laboratory before the tests.


During the track test, numerous laps were completed, primarily to simulate a race strategy. We did this to make the tests easier to read both immediately after the tests and in the future, and to analyze the dynamic behavior of the car that was similar to that faced later in the race.
Measurements
At the end of the test day, the Dewesoft engineers provided us with all the collected data for analysis using their software.
We obtained the first significant piece of data from the force diagram of the vehicle in the XY plane (Figure 8). This diagram illustrates the forces acting on the car. It is of fundamental importance at the mechanical level when designing a new component, as it allows us to calculate the maximum force and mean square value from this data.


The primary data we analyzed were those related to the lateral behavior of the IDRAzephyrus car, such as cornering stiffness and side slip angles.


Figure 9 illustrates the side slip angle of the vehicle as calculated by the NAVION system. In contrast, Figure 10 displays the data from the steering sensor, with the output voltage transformed into wheel angles. Finally, Figure 11 presents the yaw rate.
The data were then filtered at 2 Hz using an IIR filter, allowing for the acquisition of cleaner data. With the aid of this data and the vehicle's geometry, it was possible to calculate the front and rear axle side slip angles, as shown in Figure 12.
This figure, in particular, illustrates an overall neutral vehicle, with the front and rear side slip angles being nearly identical. Even considering the whole run of seven laps and making the difference between the values of front and rear side slip angles, the average is practically equal to zero.


Through these data, it was possible to calculate the cornering stiffness, as represented in Figure 13, which shows both the cornering stiffness and the vehicle's steering. The values have peaks, however, that do not occur while the car is cornering. Therefore, we used the ‘if’ function to obtain the value of cornering stiffness for steering angles greater than 1°. Otherwise, it returns to 0°.
Afterwards, we noticed that the cornering stiffness varies along the circuit. This phenomenon is due to the different bending of the vehicle, which induces variable camber, and also to the conditions of the asphalt during the various corners. Figure 14 shows the results of this operation.


 and rear (in white) cornering stiffness when steering the front wheels by more than 1°")
Figure 15 shows an overview of the formulas used for calculus. We then elaborated on this data in MATLAB to obtain a vector containing only the values greater than 0° (Figure 16). From this vector, we calculated the root mean square value to get a constant number for use in our model in Simcenter Amesim, the mechatronic systems simulation platform for virtual performance evaluation.


The values obtained for cornering stiffness at the front and rear were 1621.5 N/rad and 1009.8 N/rad, respectively. The values previously used (obtained in the past by the Team) for the vehicle dynamic simulation were 2000 N/rad at the front axle and 1500 N/rad at the rear axle.
Following the vehicle dynamics analysis, we analyzed the temperatures acquired through the Radio6ense sensors.

Figure 17 shows engine temperature in red during the entire run. This feature is activated at intervals, as shown in the graph. We can also observe that the temperature increases at times, remains constant at other times, or decreases, depending on its ability to exchange heat.
An actual steady state is reached only in the last seven minutes of the simulated run. In fact, during this interval, the heat increase during the on phase is equal to the heat exchanged in the off phase.
This heating provides excellent indications of the electric motor’s temperature range when in use, but at the same time highlights how the power loss in the copper constantly changes during the race. Therefore, we utilized this data to create a fitting within the model that already considers an engine temperature that evolves; moreover, it will help us in the next motor test bench to identify the temperature range at which to run the characterization tests of the new electric motor.
On the other hand, as shown in Figure 17, we can see the temperature acquired by the speed reducer, represented in blue. As we note, this temperature increases more slowly, but in a steady state, it reaches the same value, since the two elements are interconnected.
Regarding the temperature data at the tire, as shown in Figure 18, we highlight what we already noted in this year’s first tests. The tire undergoes a short transient to conform to the asphalt temperature without increasing its temperature due to the turns. Figure 18 shows the graph of a single tire temperature, as the behavior is the same for both the front tire, which is more stressed by the steering, and the rear tire, which pushes the car.


Conclusion
The experimental tests conducted proved to be very fruitful from the perspective of the data obtained, and the decision to simulate race runs turned out to be an excellent one, as it provided a wealth of data representing the real conditions of vehicle use.
The results obtained from the dynamic point of view also were outstanding and solid, in fact they were different to those already used by the team, letting the model’s dynamic be closer to the reality since time they have been obtained in a more rigorous way and with more advanced sensing, which makes them more accurate, robust and reliable.
Finally, thanks to the electric motor and tire temperatures, we were able to obtain data that would have been difficult to estimate otherwise, thus providing us with a new key in setting up future tests on these components.