


Determining Stall Torque of BLDC Motor
Martin Võip
Tallinn University of Technology
September 4, 2025
As electric scooters continue to shape the future of urban mobility, understanding the torque-speed performance of their BLDC motors is crucial. Using real-time analysis tools, engineers can map efficiency and identify motor limitations that are critical to optimizing design and control strategies. A custom Dewesoft-powered test bench can evaluate stall torque and power output under varying loads.
Electric mobility rapidly transforms urban transportation, with electric scooters becoming a key element. Understanding the dynamic performance and efficiency of brushless DC motors (BLDC) used in these scooters is essential for engineers and students.
Tallinn University of Technology (TalTech) is a research-based university specializing in engineering, business, public administration, and maritime affairs. The university has nearly 10,000 enrolled students, approximately 11% of whom come from more than 100 different countries worldwide.
A Brushless DC motor (BLDC) is an electric motor that operates using direct current (DC) electricity but without the mechanical brushes and commutator found in traditional brushless motors. Instead of using brushes to switch current direction in the motor windings, a BLDC motor uses an electronic controller.
The rotor typically contains permanent magnets, while the stator has windings. The lack of brushes reduces friction, wear, and maintenance needs, making BLDC motors more efficient, longer-lasting, and quieter.
BLDC motors are popular in modern devices due to their high efficiency, precise control, and compact design.
BLDC motors have use in various applications:
Electric vehicles
Electric scooters
Drones
Consumer electronics (e.g., computer cooling fans)
Industrial automation
HVAC systems
etc.
For this application, I used a custom-built test bench. The setup demonstrates how Dewesoft tools can characterize motor-speed and torque-speed behavior. It can also observe real-time controller waveforms and construct efficiency maps of electric motors under load.


Manufacturers widely use BLDC motors in personal electric vehicles due to their high efficiency, low maintenance, and compact size. However, to optimize their application in real-world conditions, such as steep inclines or high loads, it is necessary to understand their torque-speed characteristics and efficiency under different operating conditions.
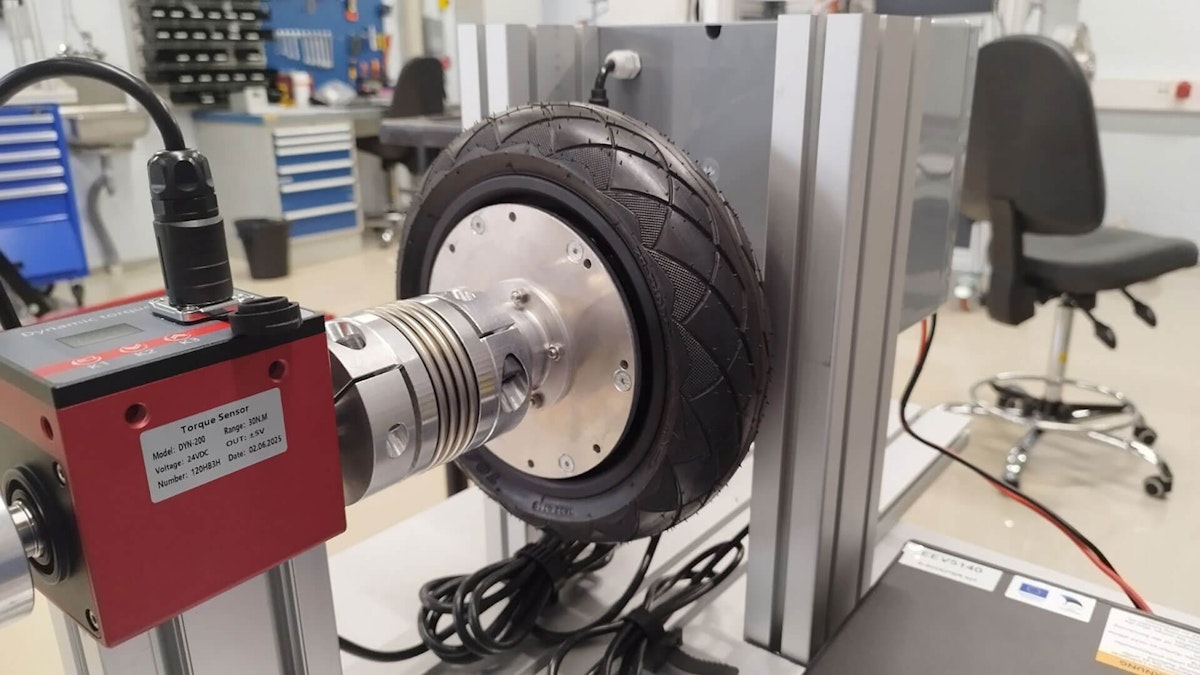
The test bench integrates a brushless motor (BLDC) with a powder brake, a torque sensor, and a unified control unit. All components interface directly with Dewesoft for flexible, in-depth measurement and analysis.
Objective
The primary objective of this application is to evaluate the dynamic and steady-state performance characteristics of brushless DC motors used in electric scooters. This evaluation includes determining the stall torque at various fixed RPM values, creating a power map, and analyzing electrical waveforms under different load conditions.

The measurements provide insight into how the motor behaves when subjected to gradual torque increases, helping to identify the motor performance limits, such as the maximum torque (sustainable) at a given speed.
Using Dewesoft’s Power Analysis module, the system enables real-time observation and evaluation of controller voltages, phase currents, and power-related parameters. This module allows for a comprehensive understanding of the motor’s behavior under varying output torque and speed profiles.
Measurement setup
I used a Dewesoft SIRIUS isolated (SIRIUSi) data acquisition system. It has four high-voltage (HV) and four low-voltage (LV) signal inputs, perfect for this application. I used the high-voltage channels to measure the DC supply voltage and the three motor phase voltages. I connected the low-voltage channels to current clamps for input and phase current measurement.
A DYN-200 torque sensor, with analog torque output and a 6V square wave signal for speed, measured torque and speed. I connected this to a DEWE-43A DAQ unit. A sync cable synchronized the DAQ devices to ensure the acquisition of fully time-aligned electrical and mechanical signals.
I performed the sampling with a bandwidth of 1 MHz to capture high-frequency switching characteristics in the motor controller signals. All components, including sensors and control electronics, were powered separately as part of a modular test bench layout, ensuring electrical isolation and system flexibility.
The entire measurement system included the following devices and software:
Data acquisition system
SIRIUSi-4xHV-4xLV – modular amplifier with 4x HV (high voltage), 4x LV (low voltage) analog inputs.
DEWE-43A – 8-Channel USB Data Acquisition (DAQ) system for additional analog input channels and digital signals.
Synchronization cable – for precise timing between systems.
Sensors and transducers
CP30 current clamp (100 mV/A) – for supply current
3x PR200 current clamps (10 mV/A) – for motor phase currents
DYN-200 torque sensor (0-5 V analog output, 30 Nm range)
DYN-200 speed output (square wave, 6 V amplitude)
Motor and load
BLDC Scooter Motor - 1 kW, 48 V rated
Motor Controller – ASI BAC555
Load Machine/Powder Brake – 25 Nm magnetic particle brake for adjustable mechanical loading.
DAQ and analysis software
DewesoftX Professional – For synchronized data acquisition, visualization, and analysis.
DewesoftX Power Analyzer Module – a software bundle for comprehensive power analysis with more than 100 parameters based on voltage and current for analyzing the motor's power consumption.


Methodology
The test procedure involves setting the motor to constant RPM and gradually increasing the torque of the motor using the powder brake until the motor stalls. This procedure allows identification of the peak torque point at each speed. I captured the data using the following Dewesoft configurations:
Scope: Used for visualizing motor controller voltages and phase currents. Scope views were auto-triggered to capture clear waveform snapshots. Sinusoidal modulation patterns of the voltage signals were observable.
Filtering: I applied a low-pass filter to phase currents to reduce noise. Though it introduced a minor signal delay, the trade-off favored amplitude accuracy.
Angle Sensor Math: I used the Frequency signal derived from the angle sensor mathematics module to measure the motor rotating speed.
Vector Scope: Used for analyzing voltage and current phase relationships, allowing a deeper insight into real-time power flow with load increase.
Digital Meters: Displayed average values for torque, RPM, supply voltage, and supply current.
Recorders: Continuous recording of motor torque and speed to identify key operating regions.


Initial analysis
I conducted measurements at rotational speeds ranging from 50 to 600 RPM, with increments of 50 RPM. Dewesoft analysis interface allows convenient exploration of all recorded data, with synchronized viewing of instantaneous values across multiple channels:


This synchronized view is particularly effective for identifying transient events or subtle interactions between mechanical and electrical domains. During the analysis phase, additional filtering was applied to the torque channel to reduce noise and improve signal clarity.
The power software module provides a clear overview of the phase angles and power triangle.


Phase voltages and currents helped me assess if the motor is experiencing an unbalanced load or abnormal operating conditions. The relatively low power factor indicates that a significant amount of power is reactive, confirming the motor’s light load at this particular moment.
Detailed analysis
Since the detailed analysis in this application note required only torque and RPM data, these channels were exported as MATLAB files using a relative time scale.
The first step in the analysis involved generating torque-versus-speed motor profiles. These plots illustrate the motor’s stable operating regions and the maximum achievable output torque at each speed setpoint. It is also evident that the motor controller imposes a power limitation, causing the motor to stall earlier at higher RPMs:


The second chart presents motor power as a function of torque and speed. This visualization helps identify the point of maximum mechanical power output, which is again clearly limited by the controller’s capabilities:


Conclusion
The results confirmed that Dewesoft provides a robust, high-resolution platform for capturing the transient and steady-state behavior of electric motors.
Key features such as real-time waveform triggering, intuitive vector scope analysis, and flexible filtering proved critical in visualizing and interpreting motor characteristics.
Some challenges, like current measurement noise, were mitigated using digital filtering and averaging techniques.