


Noise Floor Analysis: Signal Measurement Chain Quality in Civil Engineering
Gabriele Ribichini & Emanuele Burgognoni
June 1, 2022
Measuring the environmental forces affecting structures can be complicated. The measurement signal chain has to be well-composed and accurately dimensioned to optimize the signal-to-noise ratio. However, technological evolution pervades every single testing application. High-performance measurement instrumentation and powerful analysis software at affordable prices have also substantially changed the civil engineering approach.
Introduction
Modal analysis is the type of dynamic investigation that requires a very high-level treatment of the analog signal. Unlike dynamic monitoring, the purpose of which is to define the maximum vibrations perceived by the structure, the operational modal analysis (OMA) requires an accurate analysis of small entity signals, typically generated by environmental noise and not by imposed stresses - such as in the case of the Modal Test.
Measuring small signals is often difficult. Without an accurate dimensioning of the various components used in the measurement chain for the optimization of the signal-to-noise ratio (SNR), it is very easy to find yourself in the condition where the amplitudes of the vibration signals from the ambient noise have amplitude comparable to or even lower than those the electrical noise of the instrument.
Among the various transducers used, it is very common to encounter accelerometers; devices that convert accelerations into an electrical signal, which can be measured with data acquisition systems.
The signals generated by the accelerometers require multiple amplification and filtering steps. Some types of sensors are designed to have an output that is already amplified thanks to the integrated circuitry inside the device, while others simply supply the signal generated directly by the sensitive element, requiring the use of particular wiring and electronics for the treatment of the signal. All these details must be carefully considered when configuring a measurement system, taking into account that the acquirer hardware is part of the signal processing chain.
An inadequately conditioned or digitized signal inevitably leads to results that are inconsistent with the state of the analyzed structure. In this field of engineering, it is therefore important to work with instruments that are characterized by low noise floor values, a high signal-to-noise ratio (SNR), and high dynamics to perceive the smallest amplitudes and introduce the least number of impurities along the signal processing path. It should be emphasized that we cannot measure in detail signals whose average amplitude is below the background noise (Noise floor), so the choice of hardware must be made with care according to these parameters.

, an analog signal conditioning circuitry, an A/D converter (analog-to-digital converter or ADC), and a data processing system (processing, storage, and display).")
Dynamic analyses in civil engineering are, by their nature, an excellent testbed for data acquisition instrumentation as they require excellent signal processing and a high degree of synchronization of the acquired channels. Poor signal processing often causes electrical noise superimposed on the useful signal. This makes post-acquisition analyses problematic or worse, leading to the impossibility of obtaining results from the processing of the final model.
This scenario is very common in the civil field, but although noise is a crucial issue in the analysis phase, it is not a dangerous factor for data analysis as much as the absence of perfect synchronization of the systems used for the analysis. The dynamic characterization of a structure has the indirect objective of leading the engineer or designer to choose whether to carry out consolidation works or limit the analysis to the drafting of a report on the state of the structure itself. If it were necessary to carry out adaptation works, there would be a risk of compromising the structural integrity by operating based on incorrect models developed from the acquired data in the absence of perfect synchronization.
In the worst case, not only the solidity of the complex would be undermined, but also the safety of those who reside there. It is for this reason that we prefer to use wired systems, where synchronization is guaranteed to the microsecond. Wireless systems, in addition to not allowing sync times of less than a few milliseconds, require the use of batteries that cannot have a long life if the system acquires dynamic signals and transmits data in streaming.
It is precisely to meet these needs that Dewesoft's IOLITE 3xMEMS-ACC dynamic acquisition modules have been developed. These are all-in-one devices equipped with a sensor and an integrated sensor within a single case. These systems are scalable and offer high degrees of synchronization reaching the microsecond. These are wired systems with an architecture designed to optimize the wiring in monitoring applications of large works; a single cable for power, data, and synchronization.
The concatenation of the modules allows reducing to a minimum the number of cables. In addition, the use of UTP CAT6 cables with RJ45 connectors allows you to create very economical cabling with highly available material from standard distributors for electrical systems.


A further factor of great importance is given by the sampling frequency. Although civil engineering requires an analysis of very low acquisition bands, it is very useful to work in oversampling conditions for the faithful reconstruction of the original analog signal in the time domain. Thanks to this technique, it is possible to obtain a greater cleaning of the spectral band involved in the analysis, reducing the problems related to quantization noise.
Compliance with the Nyquist-Shannon principle in the sampling phase is not a sufficient condition to preserve good signal quality but has the sole purpose of preventing the aliasing phenomenon (anti-aliasing filters). The systems that operate in the maintenance of this principle only, appear to be affected by high quantization noise values increasing in the acquisition of harmonics at higher frequencies near the upper band limit. Quantization noise is what introduces most of the disturbances in this phase of the conversion process and leads to a lower SNR value within the observation band.
To improve the resolution of the signal, it is necessary to carefully approach the choice of hardware based on 3 factors: the type of integrated ADC, the sampling frequency available, and the filters available for cleaning the signal. In this field, where quality is preferred over sampling speed, it is important to rely on a type of high-performance analog-digital converter.
The Sigma-Delta technology proves to be the most suitable choice when compared with the faster but less precise counterpart of the SAR type since the sampling process used by the first operates on an oversampling principle even 100 times higher than the sampling rate set. Observations of this kind can be crucial in choosing a single element of the acquisition chain, even more so for dynamic investigations.
In structural dynamics, the Modal Tests have as their primary objective the identification of three parameters that, taken together, describe the behavioral response of a structure to vibrations: resonance frequency, damping coefficients, and modal forms.
To carry out this analysis, two methods are used: EMA (Experimental Modal Analysis) and OMA (Operational Modal Analysis), chosen according to the surrounding conditions of the survey.
Both analyzes will be aimed at stimulating the frequency band at which the structure will exhibit resonance (also defined as natural or natural frequencies) and then identify the exact value to which the vibrational resonance effects take over. In the EMA method, an artificial excitation is used, such as shakers for the structures, the falling bodies for the floors, and instrumented hammers for the chains, tie rods, and floors.

f it is not possible to impose such a forcing, due to the absence of instrumentation or the critical condition of the structure, then reference can be made to the OMA methodology, thanks to which it will be possible to identify natural frequencies through environmental noise. This analysis process takes place with greater difficulty than the previous one since the conditions imposed from the vibrational point of view are not known (output only). An important parenthesis should be opened on the concept of identification of modal forms and their differences with the simple ODS analysis.


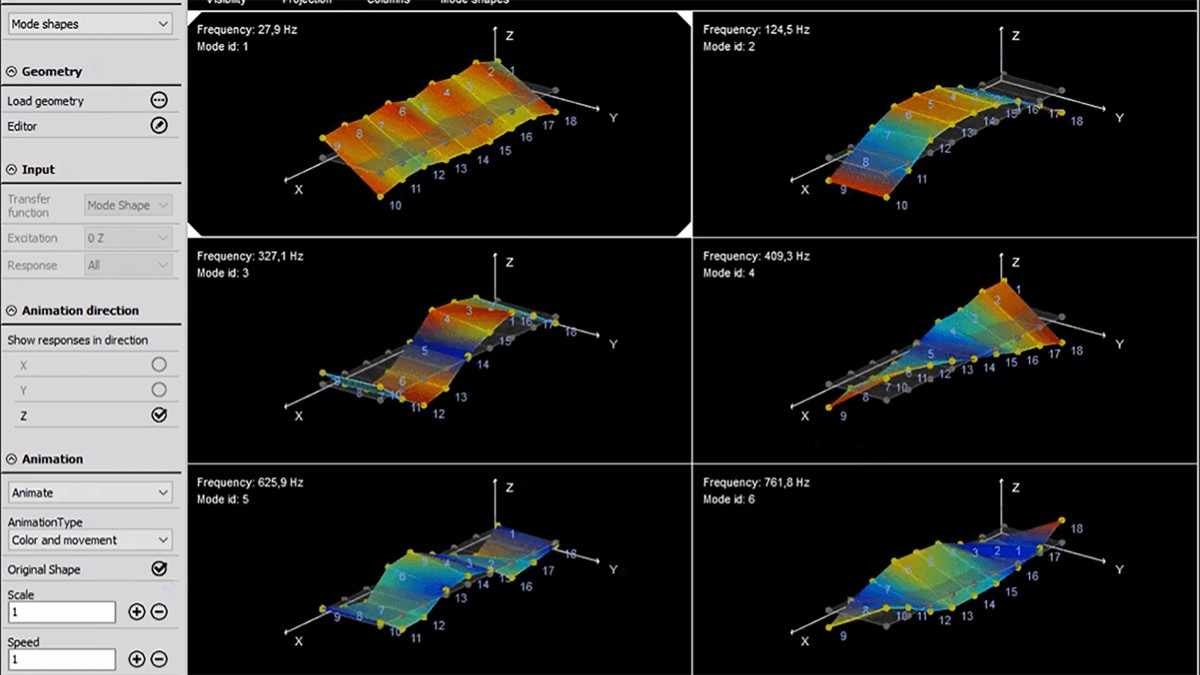
The Operational Deflection Shapes in the time domain - more precisely, time-domain ODS - graphically show the displacements of the structure reconstructed using the data acquired by the synchronized channels, but do not provide an idea of the presence of similar modes or the participating mass for each of the identified frequencies. The extraction of the modal forms must go through a validation process characterized by the use of various algorithms not contemplated in the simple ODS.
The execution of a vibration acquisition to process an OMA analysis requires special attention since the noise of the instrumentation could be many times higher than the accelerometric quantities to be acquired. For this reason, it is important to focus on the quality of the hardware components used for the conversion of information from analog to digital and how these affect the acquisition process within the analysis chain.
Background noise and total dynamics
The spectral noise density (Spectral Noise) is defined by complex mathematical functions of the signal theory and represents in practice the power of the noise of the system (ADC + analog conditioning) distributed in the band. The unit of measurement is µg / √Hz.
A good accelerometer like PCB 393B12, widely used in civil engineering, has a noise spectral density of about 1.30 µg / √Hz at 1 Hz with decreasing values as the frequency increases.
Spectral density is a very convenient unit of measurement for defining noise when analyzing different frequency bands. In fact, it is sufficient to integrate the spectral density value in the band of interest to have the RMS noise (background noise that is confused with environmental vibrations).
The 393B12 accelerometer has a "background noise" of the order of 10 µg in a band ranging from 0 to 10Hz
The same accelerometer shows a different noise level (Noise Floor) if different frequency bands are analyzed, for this reason, it is important to use correct analog filtering of the signal that limits to a minimum the presence of signals without useful information content.
Dewesoft systems integrate a wide selection of low-pass filters, with different cut-off frequencies and different characteristics to optimize the instrument in most applications.
Another very important parameter is the Total Dynamics of the acquisition channel (Dynamic Range) which represents in logarithmic scale (dB) the ratio between the full scale and the background noise (lower limit).
Having a very low background noise, seismic accelerometers have very high total dynamics, normally well above 100 dB.
It is therefore essential to use data acquisition instruments with adequate dynamics >> 100 dB to avoid introducing limitations on the quality of the transducer used.
The Dewesoft family of acquisition systems implement DualCoreADC technology, considered the last frontier in data acquisition. The power of two 24-bit converters is combined to achieve total dynamics up to 160 dB. Performance is essential to acquiring the signals of the most performing accelerometers.
Analysis of noise components
The whole process inherent in the processing of the signal acquired by the sensors is subject to the introduction of a component of information that is not useful for the analysis. This component is called "noise" and characterizes the whole acquisition chain. Let's consider a system consisting of piezoelectric sensors with charging output, a DAQ device that also acts as an interfacing and conditioning circuit for the transducer, and finally, a PC dedicated to system configuration and data storage.
The first potential source of noise is the interface stage between the sensor and the DAQ. In this stage of the chain, the analog signal is identified by the charges generated by the piezoelectric element inside the transducer which is redistributed on the crystal according to the perceived acceleration. This signal form is very weak and has very low noise rejection.
The conversion of the signal into a potential difference is achievable only if the generated charges reach the amplifier before the crystal discharges and uniformly redistributes these charges within it. To work in good signal conditions, it is necessary to have a very high impedance DAQ input stage. It is also important to avoid the introduction of triboelectric and electromagnetic disturbances with connection cables that have the following characteristics: limited length, mechanical rigidity, and electromagnetic insulation.
In the next stage, the DAQ performs its data acquisition and conversion functions. At this point, the signal encounters new problems linked to electronic components which, by their nature, introduce different forms of noise which in the jargon are defined as “Thermal”, “Shot” and “Flicker”. Their study is not the purpose of this article, but their consideration only wants to highlight all the factors that potentially come into play in compromising what will then become the final data. Each of these types of noise "dirties" the useful signal by introducing harmonics in a certain band of the spectrum, thus making its reading very difficult.
The ADC conversion process introduces an additional source of noise that by nature is related to the sampling and reconstruction of the signal. Noise is introduced during quantization in two ways:
Quantization error: originated from the reconstruction of every single harmonic of the signal with a finite number of samples. The result is the reconstruction of each harmonic as a segmented wave that introduces harmonics into the frequency spectrum.
Quantization distortion: caused by a reduction in the resolution of the analog signal by approximating the amplitude to the nearest discrete value.
Since it is not possible to perfectly reconstruct an analog signal from its digital equivalent, quantization noise will always be present. In many processing applications, it is desirable to obtain as much information about the signal as possible to reduce the noise as much as possible.
There are two common ways to reduce quantization noise: over-sampling the input signal or using an algorithm that reduces the effects of quantization. The architecture integrated into the Dewesoft acquisitions applies both methods of reducing the effects of quantization to obtain a signal that is as faithful as possible to the original analog.


The triangular wave represents a fitting example of the harmonics introduced by the segmentation of a wave during the signal reconstruction process. The harmonics below are the principal contributors to the generation of noise in the so-called quantization error form. The “noise floor” is thus composed of the contribution of all these factors which influence the system throughout the acquisition chain.
The key parameter with which the noise level of a signal is attributed is its RMS value. RMS is defined as the energy contribution of a signal within a certain frequency band. It is determined by integrating the power spectral density function in the observable frequency range. The band of observable frequencies is usually defined by the Nyquist frequency, which is half the sampling frequency. Dewesoft adopts different algorithms operating in oversampling, therefore the observable band in the Dewesoft modules can vary from ¼ to 1/3 of the sampling frequency.


The more the integration interval is reduced, the more one observes the specific contribution of noise in a given observation sub-band. In civil engineering, a spectral resolution of 0.1Hz is required many times since the useful signal is concentrated at low frequencies. From a computational point of view, the calculation of the RMS values of the entire spectrum requires a time given by the inverse of the frequency resolution. Therefore, too high detail leads to a slow updating of the spectrum. In the case of 0.1Hz resolution, 10 seconds are required for each processing.


The instrumentation on the market is evaluated through various parameters related to noise. Among these, we find the "Dynamic Range", the "Noise Floor" and the "SNR" ratio.
The Dynamic Range expresses the ratio between the maximum and minimum value of the undistorted perceived signal. Its equivalent in logarithmic scale is expressed in dB and provides the interval as a function of the maximum and minimum perceptible energy. This parameter is crucial in applications such as those of the civil field since the acquired signal undergoes very large variations as a function of the forcing in place.
Let us take as an example, a bridge under dynamic characterization. The displacements are very small and the accelerations are minimal, almost close to the background values of the noise floor. A car is about to cross the bridge passing near the sensors and the acceleration signal undergoes a rapid excursion from values of the order of 10 ^ (- 5) g to 10 ^ (- 1) g. A factor of 10000 separates the two acquisition moments by the intensity and, without high dynamics of the device, the result would lead to the loss of information due to signal distortion.
The Noise Floor (sometimes also defined as “Residual Noise”) represents the sum of all the components that are not part of the useful signal.
The Signal-to-Noise Rapport (SNR) is expressed in dB as the ratio between the useful and the non-useful signal, in correlation to a given sampling frequency. It is a parameter in close contact with the Noise Floor and is an indication of high performance for the instrumentation.
Dewesoft systems offer DualCoreADC product lines optimized for high dynamic signal processing, where high SNR and a low noise floor are required. The implemented technology exploits two 24-bit Delta-Sigma ADCs with oversampling and filtering techniques to reduce the quantization error. The results achieved lead to devices with very high dynamics.
Comparison of various ADC technologies
Our job is to help you choose the right technology for each application.
We carried out tests to verify in the laboratory the noise levels introduced by the various Dewesoft acquisition modules. To this end, some models with different architectures were considered to compare performance on paper and in the field to confirm the differences in signal processing. See the parameters related to the noise of the various Dewesoft models in figures 9-13.


Although many acquirers take advantage of a sampling architecture built around the Delta-Sigma converter, not all modules have the same signal-to-noise ratio. This is because the optimization of the input stages is carried out on the type of sensor that the module is designed to support. Filters and oversampling are part of the factors that together with the sensor define the quality of the measurement. Obviously, to date, a MEMS sensor cannot be expected to have an accuracy comparable to that of a piezoelectric sensor, but under certain conditions, it is necessary to provide the advantages offered by one technology rather than another. However, modern developments are pushing MEMS technology to graze band noise levels below the 1 ug / √Hz value.
From the technical datasheets, the SIRIUS HS 8xLV model is the most deficient in the relationship between signal and noise. The reasons are related to the 16-bit SAR architecture and the absence of oversampling techniques useful for decreasing the quantization error and the noise related to it. In the absence of all these factors, the noise floor below 10 kHz turns out to be around 100 dB. Something else can be said for the SIRIUS 8xACC which has all those signal optimization stages that the HS model does not have.
Let's look for a moment at the architecture that characterizes the converters integrated within these modules. The theory suggests that SAR technology is the least appropriate choice for this sector due to its lack of attention to detail. Although it does not represent one of the best ADCs available on the market, its economic nature leads it to be widely exploited in the world of measurement.
Today's developments have led to the creation of SAR converters with a resolution of 24 bits, maintaining the strengths related to the economic side and the acquisition speed. Its simple architecture makes it a very fast converter, capable of responding well to various types of signals, both natural and "artificial" [square waves, triangular waves, ...].
Delta-Sigma converters, on the other hand, are focused on precision and detail supported by oversampling techniques and ad hoc filtering using DSP filters. Quantization error and distortion are among the main potentials of this technology since they are really low due to the oversampling of the signals, well above the Nyquist-Shannon sampling criteria. The digitized signal undergoes a further phase of cleaning thanks to the second filtering system on the output bit-stream carried out through low-pass DSP filters.


Another factor that drives Delta-Sigma technology is the high dynamics thanks to which it is possible to digitize signals that have strong variations between the maximum and minimum values. The DualCoreADC technology developed by Dewesoft amplifies the dynamic potential offered by Delta-Sigma ADCs by combining the action of two ADCs with a different level of gain. The function is to process the low-level input signal with the higher gain converter and re-route the signal with greater intensity on the lower gain ADC to avoid the cut-off of the maximum values due to the overmodulation of the values in the entrance. Thanks to these characteristics it is possible to reach Dynamic Range values of 160 dB and an SNR of 125 dB.


The Dewesoft instrumentation that mounts the DualCoreADC technology is the "Sirius High Dynamic series" and is the core of the tests carried out within this analysis to compare the performance of the various hardware. To obtain an evident comparison of the effects of quantization noise on the noise floor, acquisitions were made between the Sirius High-Speed models, which integrate 16-bit SAR ADCs, and the Sirius High Dynamic models with the 24-bit DualCoreADC ΔΣ.


The results of the tests are therefore those shown in figures 19-23, where the RMS value of the noise calculated in a spectral band between 0.2 Hz and 100 Hz is specified.


As expected, the minimum noise floor values are obtained with the SIRIUS 8xACC thanks to which it is possible to carry out accelerometric analyzes even in conditions of strong rigidity of the structure. The dynamic analysis can still be carried out with the remaining modules, but in practice, there would be problems if the structure under analysis was highly rigid. In this case, the micro accelerations would be covered by the noise levels.
Comparison of various transducers
In the attempt to provide an evident key to understanding the advantages offered by sensors on the market, tests were carried out using two of the most precise transducers in the field of structural dynamics, IEPE accelerometers and servo-mechanical transducers (also known as Force Balance Accelerometers or FBA).
Although not united by the same nature of the operation, both types of transducers provide an output proportional to the acceleration perceived by the sensor. The big difference is that the conditioning of the output signal by the piezoelectric element makes the first sensor unable to measure constant accelerations, while the servo-mechanic does not have this limit.
The explanation for this lies in the capacitive behaviour of the piezoelectric crystal. When mechanical stress is applied due to the application of a force on the crystal, a potential difference is generated for the displacement of the charges inside it. These charges have a lifetime imposed by the discharge process of a capacitor, whose time constant is dictated both by the resistive-capacitive properties of the crystal itself and above all by the impedance of the measurement system.
With the application of a constant force, such as that of gravity, the signal represented by the free charges is quickly lost. Once the charges are redistributed, it is no longer possible to determine the extent of the forcing that generated them, which is why the accelerations that tend to have a frequency close to zero are not read by the IEPE sensor.
The opposite case is that of the Force Balance whose acceleration is determined by the displacement of the seismic mass present inside it. Anchored by springs and immersed in a fluid, the mass remains in a very delicate balance as long as the coil that surrounds it is not powered and the current does not clamp the mass with the force applied by the electromagnetic field generated.
Once the field is stabilized, the mass remains in equilibrium thanks to the magnetic component of the coil. As the force acting on the mass varies, the current inside the coil varies, which however remains constant in the absence of any displacement. For this reason, servo-mechanical transducers are sensitive to forces that are constant and/or close to zero frequency.
Conclusions
For applications involving large and rigid structures, the most suitable Dewesoft instrumentation is represented by Sirius with BNC channels dedicated to IEPE accelerometers. The coupling filters are defined in frequency at 0.1 Hz, providing the possibility to acquire with transparency and precision the vibration modes already from 0.5Hz (albeit with still some distortion).
The acquisition of signals with such low HP filters is very important for analyzing the typical frequencies of structures, even if most of the systems on the market are sized for higher frequencies. In the case of high pass filters at 0.5 Hz, the signals will be affected by a not negligible phase shift up to 5Hz (one decade above). Even if the filters used have a very steep Roll-Off, a cut-off frequency of 0.5Hz compromises the integrity of the signals acquired in the band of greatest interest for civil engineering
If high sensitivity is required, the PCB393B12 turns out to be one of the most suitable sensors for analysis. Thanks to its sensitivity of 10V / g it is possible to perceive the slightest vibrations without them being lost in the background noise. The same thing is true for the PCB393A03 model, although it has a sensitivity of a lower order (1V / g) and therefore is less practical in situations of high structural rigidity.
Force Balance, on the other hand, has similar background noise performances (when powered with strongly stabilized excitation) and remains the preferred choice when the frequencies to be analyzed are lower than 0.5Hz, as it can be acquired without high pass filters and therefore the signal is preserved at any frequency.