


Measuring and Evaluating the Effects of Vibration on Buildings - UNI 9916:2014 and ISO 4866:2010

February 13, 2022
The ISO 4866:2010 standard provides a guide for choosing appropriate methods of measurement, data processing, and evaluation of vibratory phenomena to allow the evaluation of the effects of vibrations on buildings, regarding their structural response and architectural integrity.
In the national arenas, the reference standards for structural monitoring are DIN 4150-3 for Germany, BS 7385 for Great Britain, SN 640 312a for Switzerland, and UNI 9916:2014 for Italy. Dewesoft provides a range of data acquisition systems and the analysis software suited to conduct the measurement of vibrations and support the evaluation
In Italy, the standard UNI 9916:2014 is applied in the presence of internal sources of excitation in buildings such as industrial plants, production machines, or rooms constantly populated by people. It is also used for external sources, for example, turbines, construction sites, vehicular and tram traffic, or airports.
In these shock vibration of buildings guidelines the specified threshold values refer to phenomena that generate at most aesthetic but no structural damage. The standard states:
In general, structural damage to the building as a whole attributable to vibratory phenomena is extremely rare and almost always derives from other causes. For vibrations to cause structural damage they must reach levels that first cause annoyance and disturbance to the occupants.
On the other hand, other forms of damage are frequent, of an entity defined as "threshold", which, without compromising the structural safety of the buildings, can lead to a reduction in their value. Threshold damage can occur in the form of cracks in the plaster, growth of existing cracks, and damage to architectural elements.
It examines vibratory phenomena, whether generated by anthropic or natural activity, of modest intensity such as to produce at most" architectural "damage. In fact, the values and simplified methodologies reported are not generally applicable to cases of onset of "major damage". For the assessment of such, it is necessary to resort to specific investigations by experts. For this reason, the effects of vibrations generated by earthquakes are outside the scope of this standard.
In this document, we will see how you can implement the required measurements following UNI 9916:2014 using Dewesoft DAQ acquisition systems and in DewesoftX analysis software.
Instrumentation
UNI 9916:2014 provides measurement guidelines and lists the general requirements for the configuration of the vibration data acquisition with particular attention to:
Choice of transducer
Speed is the reference quantity used to define the architectural damage assessment parameters. Although the use of velocity transducers is the fastest solution, it is not, in the same way, the most precise and practicable since these sensors have limits in the spectral response at low frequencies. We, therefore, recommend the use of accelerometers suitable for the spectral content being analyzed, whose signal will subsequently be integrated to obtain the speed required by the standard.
Attaching the transducer
For how to mount the sensor, we recommend viewing the relevant standard (UNI ISO 5348), which specifies the advantages and disadvantages of each mounting method and the respective variation of the spectral response of the sensor. The table in figure 1 shows an extract from the standard just mentioned.
| Resonance frequency | Temperature | Transducer's mass and mounting stiffness | Resonance amplification coefficient | Surface preparation | |
|---|---|---|---|---|---|
| Stud | ⬤ | ⬤ | ⬤ | ⬤ | ⬤ |
| Glue | ⬤ | ⬤ | ⬤ | ⬤ | ◑ |
| Bee wax | ◑ | ⭘ | ◑ | ⬤ | ⬤ |
| Tape | ⭘ | ◑ | ⭘ | ⭘ | ⬤ |
| Rapid fix | ◑ | ⬤ | ◑ | ◑ | ◑ |
| Vacum mounted | ◑ | ⬤ | ⬤ | ◑ | ◑ |
| Magnet | ◑ | ⬤ | ⭘ | ⭘ | ⬤ |
| Handheld | ⭘ | ⭘ | ⭘ | ⭘ | ⭘ |
⬤ high ◑ medium ⭘ low
Acquisition system requirements:
Acquisition with 16- or 24-bit ADC;
High pass filter at 0.5Hz or less dedicated to filtering the sensor conditioning signal;
Sampling frequency not less than 250 Hz;
Anti-aliasing filter with cut-off frequency not higher than the sampling frequency value divided by 2.56;
SNR greater than 30 dB
Simultaneous and synchronous acquisition of the signals that affect the phenomenon to be analyzed
Calibration of the measuring system:
Calibration must be carried out periodically by a certified laboratory at least once every three years. Before each test, it is however necessary to carry out a simplified calibration in the field of the end-to-end type, from the sensor to the acquirer, with the same cables that will be used for the measurements.
Dewesoft provides various solutions for the conduct of these tests thanks to the families of acquirers: SIRIUS, KRYPTON, and IOLITE. As the investigator, you can therefore choose the most suitable instrument for your needs by evaluating the number of channels, portability, power supply, and degree of environmental protection.
In parallel to the vibration measurements, Dewesoft solutions also allow the simultaneous recording of any other physical quantity.
For all technical specifications of the Dewesoft data acquisition systems please visit the product pages from the links above.
The data recording and analysis software play a key role in the tests according to UNI 9916:2014. The DewesoftX software allows you to automate all the signal processing and calculation of the required indices while still leaving flexibility to the user of a post-analysis, always having the time histories available.
Measurement and analysis
This section provides an example of data processing according to the guidelines provided by the UNI 9916:2014 standard. Among the various solutions offered by Dewesoft to carry out monitoring according to the requirements of the standard we mention for example:
IOLITEi 3xMEMS-ACC accelerometric chains


IEPE uniaxial accelerometric transducers with DAQ Dewesoft KRYPTON-8xACC


Even before carrying out the measurements, it is important to identify the building class. The standard indicates different threshold values to be considered as a function of this classification and the altitude chosen for the positioning of the sensors.
Thresold values for vibration velocity p.c.p.v. [mm/s]
| Class | Buildings | Groud floor | Groud floor | Groud floor | High floor | Roof Vertical component |
|---|---|---|---|---|---|---|
| from 1 Hz to 10 Hz | from 10 Hz to 50 Hz | from 50 Hz to 100 Hz* | All frequencies | All frequencies | ||
| 1 | Industrial buildings, industrial constructions, and similar buildings | 20 | Linear interpolation from 20 (f = 10 Hz) to 40 (f = 50 Hz) | Linear interpolation from 40 (f = 50 Hz) to 50 (f = 100 Hz) | 40 | 20 |
| 2 | Residental buildings and similar constructions | 5 | Linear interpolation from 5 (f = 10 Hz) to 15 (f = 50 Hz) | Linear interpolation from 15 (f = 50 Hz) to 20 (f = 100 Hz) | 15 | 20 |
| 3 | Construction not included in Class 1 or 2 but worth to be monitored for conservation (ex. historical buildings) | 3 | Linear interpolation from 3 (f = 10 Hz) to 10 (f = 100 Hz) | Linear interpolation from 8 (f = 50 Hz) to 10 (f = 100 Hz) | 8 | 3/4 |
To position the sensors on the building in the way that is most suitable for detecting the vibrations imposed by the source, UNI 9916:2014 requires triaxial acquisitions to be made at each point chosen for positioning the sensors. If the acquisition of a single axis is deemed relevant, a justification must be provided for this choice.
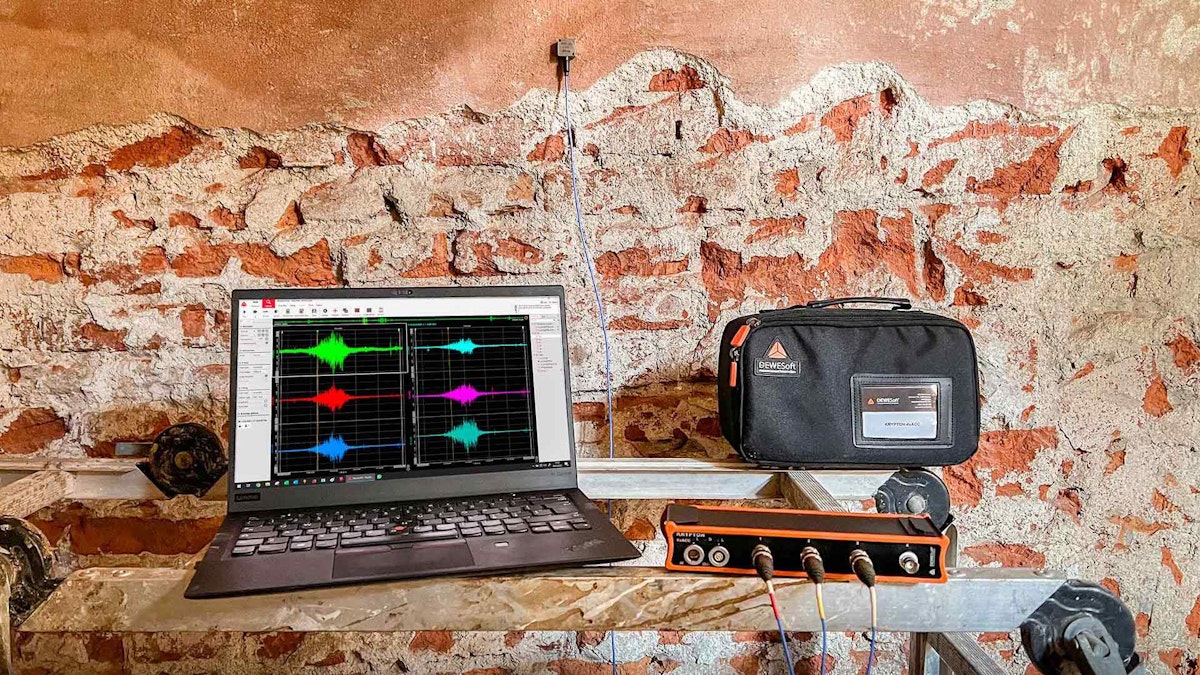
The acquired signals will appear graphically with an interface similar to the one proposed below.


The time histories of the three axes of the accelerometer are focused on a particular vibrational event to apply the first processing phase in the time domain.
The DewesoftX software interface can be configured to provide a clear view of the 3 axes of each sensor - in this case along in two distinct columns. It can also graphically highlight the period of greatest interest by zooming in.
Once the vibrational event has been identified, the initial time-domain signal processing takes place, which includes:
Filtering the signal utilizing a special high-pass IIR filter.


Integrating the acceleration signal to obtain the speed.


Figure 6 shows the details of the interface with the configuration parameters of the high pass filter applied to the original signal (Butterworth of the 6th order at 1 Hz) and the integration period to obtain the signal in speed.

Although the filtering of the sensor conditioning signal is performed a priori during the acquisition process, it is considered good practice to carry out an additional low-frequency filtering (below 1 Hz) before an integration process in the post-acquisition processing phase. The aim will be to avoid the residual continuous component due to failure to reset the absolute value of the sensor which leads to the increase of a constant continuous component along with the entire integrated signal.
Once the velocity signal is obtained, we pass from the time domain to the frequency domain employing the FFT, the parameters of which will be chosen by the experimenter and appropriately motivated in the final report. By way of example, the parameters for the case in question are shown below:

Thanks to the flexibility and real-time potential of the DewesoftX software, it is possible to view all the mathematics of interest already in the measurement phase.
Having the recording of time histories and raw data, the investigator, even in the post-analysis phase, will be able to reconsider the individual events and update the indices required by the standard.
The signals acquired and the calculations carried out can be exported in various formats for reporting purposes.
Conclusion
With Dewesoft systems, it is possible to carry out tests according to the UNI 9916:2014 standard in a few steps thanks to the graphical interface that guides the user and the already pre-configured mathematics.


The flexibility of the acquisition platform allows multiple points to be recorded at the same time, drastically reducing the time spent on-site and maintaining a linear setup with cabling reduced to a minimum, to the advantage of the signal/noise ratio.
In parallel to the disturbance perception tests, for example, tests of structural integrity and acoustic impact can also be conducted.