Table of contents
Browse categories
Browse authors
 AL
ALAlessia Longo
 AH
AHAl Hoge
 AB
ABAljaž Blažun
 BJ
BJBernard Jerman
 BČ
BČBojan Čontala
 CF
CFCarsten Frederiksen
 CS
CSCarsten Stjernfelt
 DC
DCDaniel Colmenares
 DF
DFDino Florjančič
 EB
EBEmanuele Burgognoni
 EK
EKEva Kalšek
 FB
FBFranck Beranger
 GR
GRGabriele Ribichini
Glacier Chen
 GS
GSGrant Maloy Smith
 HB
HBHelmut Behmüller
 IB
IBIza Burnik
 JO
JOJaka Ogorevc
 JR
JRJake Rosenthal
 JS
JSJernej Sirk
 JM
JMJohn Miller
 KM
KMKarla Yera Morales
 KD
KDKayla Day
 KS
KSKonrad Schweiger
Leslie Wang
 LS
LSLoïc Siret
 LJ
LJLuka Jerman
 MB
MBMarco Behmer
 MR
MRMarco Ribichini
 ML
MLMatic Lebar
 MS
MSMatjaž Strniša
 ME
MEMatthew Engquist
 ME
MEMichael Elmerick
 NP
NPNicolas Phan
 OM
OMOwen Maginity
 PF
PFPatrick Fu
 PR
PRPrimož Rome
 RM
RMRok Mesar
 RS
RSRupert Schwarz
 SA
SASamuele Ardizio
 SK
SKSimon Kodrič
 SG
SGSøren Linnet Gjelstrup
 TH
THThorsten Hartleb
 TV
TVTirin Varghese
 UK
UKUrban Kuhar
Valentino Pagliara
 VS
VSVid Selič
 WK
WKWill Kooiker
Measuring Impact Sound Reduction in Sustainable Slab Designs
Alberto Gutiérrez and Marta Herráez
University of Valladolid
October 23, 2025
Lightweight slabs are increasingly used in sustainable building design, but often fall short in impact sound insulation. We explore how linings made from End-of-Life Tires (ELT/NFU) can enhance acoustic performance while reducing environmental waste. Using Dewesoft’s SIRIUS Mini DAQ system, accelerometers, and an impact machine, researchers developed and validated a new methodology for evaluating noise reduction in lightweight slab mock-ups.
Introduction
At the School of Industrial Engineering at the University of Valladolid, we have studied the improvement of impact sound insulation achieved by using different thicknesses of ‘End-of-Life Tire’ (ELT) linings on lightweight slabs.


In 2009, the School of Industrial Engineering at the University of Valladolid (EII) established itself through the merger of several technical schools and faculties, all of which were previously part of the University of Valladolid.
The University of Valladolid is a public university in the city of Valladolid, in the Spanish autonomous region of Castile and Leon. Established in the 13th century, it is one of the world’s oldest universities. The university has approximately 30,000 undergraduate students and over 2,000 professors.


Using accelerometers, an excitation system, and Dewesoft’s SIRIUS Mini data acquisition equipment (DAQ) and its software, we measured and analyzed the acceleration level on small-sized mock-ups.
We employed a new methodology, developed from regulations and related studies on heavy slabs, to assess the impact of noise insulation in lightweight slabs. Our study facilitates the acoustic evaluation of construction proposals and provides a potential solution for treating the overextended waste ELT, thereby reducing its environmental impact.
The issue and measurement standards
Passivhaus is an international standard and a certification process for ultra-energy-efficient buildings, developed in Germany in the 1990s. The standard ensures extremely low energy consumption for heating and cooling by employing principles such as high insulation, a tight building envelope, the utilization of solar energy, and a mechanical ventilation system with heat recovery. The goal is to create comfortable and healthy buildings that use up to 90% less energy than conventional buildings.
The Passivhaus standard is an example of the evolution in construction. Based on this concept, the buildings are more sustainable and resilient in the face of adverse weather conditions. Still, a multidisciplinary research team from the University of Valladolid has established that lightweight and flexible structures in multi-story buildings have inadequate impact sound insulation performance [1].
To address this issue, we analyzed two standards outlining how to measure the impact of sound insulation in heavy concrete slabs:
ISO 10140 (1-5) for measurements in homologated rooms [2].
The ISO 10140 standard series applies to the laboratory and field measurement of sound insulation for building elements and products. It provides a unified framework for testing various components, such as walls, floors, windows, and doors. However, this testing is expensive and complex.
ISO 16251-1 for small-sized mock-ups [3].
ISO 16251-1 outlines a laboratory method for assessing the transmitted impact noise reduction of floor coverings on a small, standardized floor mock-up, offering an alternative to larger, more complex test facilities.
We aim to develop a methodology similar to that used for mock-ups in heavy slabs, adapted for so-called lightweight slabs (which are lighter in weight and used in the ‘Passivhaus’ standard), utilizing literature focused on tests of this type. Also, we use the developed method to characterize the improvement achieved in impact sound insulation from linings made from ‘End-of-Life Tire’ waste (NFU).
Preparing testing on mock-ups
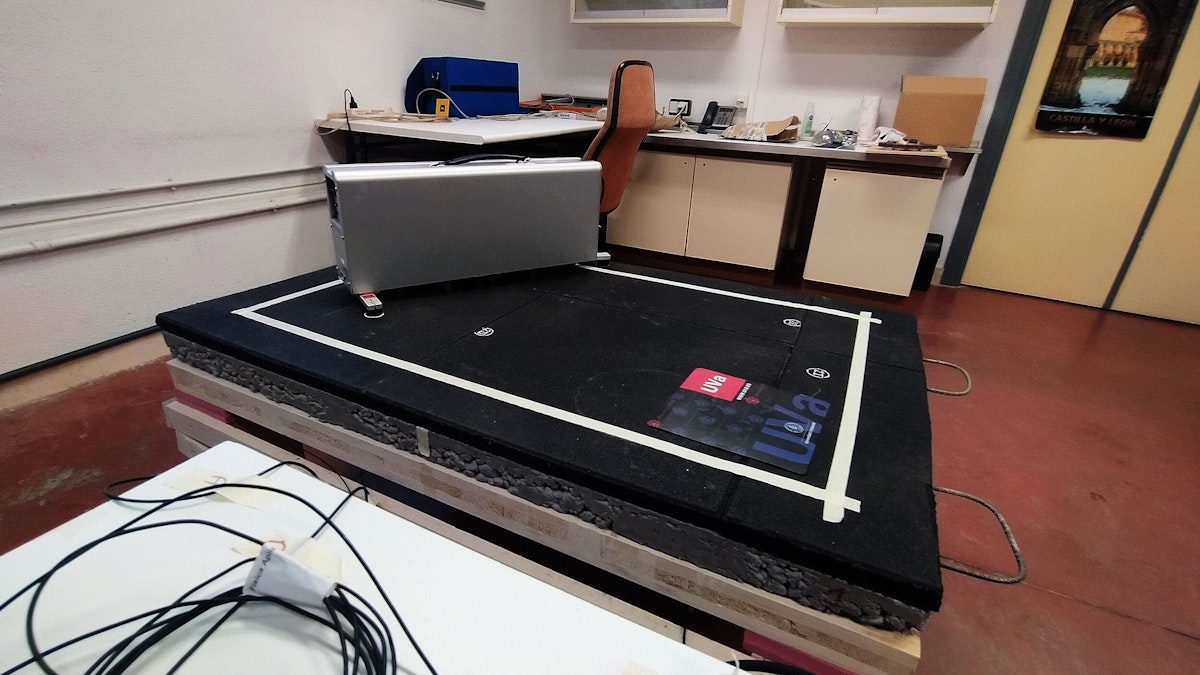
The acoustic study carried out is a signal analysis (also called dynamic analysis), comparing the different cases (mock-ups simulating a lightweight slab with linings), so only the response is measured. We created mock-ups of wood and a layer of concrete that is thinner than in traditional heavy slabs (see Figure 1).


Through these measurements, the improvement in impact sound insulation is characterized by the acceleration level, as measured using accelerometers at specific points on the underside of the mock-up in response to an excitation caused by a standardized impact machine.
By connecting the accelerometers to the Dewesoft SIRIUS Mini data acquisition equipment (DAQ) and using the software ‘DewesoftX’, we recorded the system’s vibration response in both the time and frequency domains. Figure 2 illustrates the measurement chain.


To define this methodology, we used two mock-ups: a ‘standard mock-up’ and an ‘NFU mock-up’, measuring 120 cm (±1 cm) x 80 cm (±1 cm) and weighing 102.1 kg and 85.7 kg, respectively. These mock-ups consisted of various elements (see Figure 3).
Firstly, we used a 55 mm-thick cross-laminated timber (CLT) board made of poplar. Secondly, we used two types of concrete slabs, which distinguish these two mock-ups. Finally, we applied up to three layers of ‘End-of-Life Tires’ (NFU) as a lining, with thicknesses of 4 mm, 10 mm, and 20 mm.


We created a total of six different specimens, combining the CLT board, the two slabs, and the three linings (see Figure 4).


Concerning the concrete, one of the mock-ups has the appropriate dosage to achieve ‘H25’ strength concrete, known as the ‘standard slab’. The second slab consists of NFU grit, which replaces part of the sand normally used (known as the ‘NFU slab’). Figure 5 shows images of the formwork process, concrete reinforcement (with 6mm B500S steel rods), and the final result of the slabs, with the concrete still fresh.


These mock-ups rest on wooden supports located at their four corners, measuring 13.8 cm x 13.8 cm. We arranged the wooden slats horizontally to join these supports, along with additional slats that join them diagonally to reinforce the system and restrict movement.
Finally, up to three ‘Sylomer®’ anti-vibration elastic plates have been placed on each support to decouple the mock-up/specimen from the environment. These plates are resistant to loads of up to 1000 t/m² [4], a factor to consider when placing weighty concrete slabs on top of CLT boards. Figure 6 shows the aspects described in this paragraph.


Figure 7 shows the final assembly of the support structure with one of the completed mock-ups, along with an illustration detailing the elastic supports created by the plates above, as well as the arrangement of the measurement chain in the test.

, as well as an illustration summarizing the measurement process (right).")
Vibration measurement methodology


As mentioned above, vibration levels (dBre10-6 m/s2) are determined using small, single-axis piezoelectric accelerometers manufactured by ‘Brüel & Kjær’, placed in three random positions on the underside of the CLT board (points a, c, and d). The letter ‘b’ is reserved to indicate the background noise measurement. We have marked up to eight positions for future measurements, and they have been placed, leaving a 10 cm space from the perimeter of the mock-up (see Figure 8).
The transducers’ wires have been attached to the board with masking tape, as they can interfere with the measurement if they move, and have been adhered to the surface using beeswax. This firm fastening does not introduce damping and does not significantly affect the reduction of the bandwidth due to poor fastening, as indicated in the Dewesoft ‘Vibration Measurement’ course [5].
The impact machine, which causes disturbance by imitating a ‘tapping’ motion, must be placed in two positions on the specimen, locating the hammers that generate the mechanical excitation within the previously established perimeter (see Figure 9).

Once we have described the location of the measurement chain, we define the parameters to collect during the process. Through the data acquisition system, we record the amplitude (acceleration in root mean square values, arms) affecting the mock-up at the accelerometer points. We record the amplitude for 25 seconds, relative to its equilibrium state. Using the software, we obtain the acceleration level in third-octave bands, in the range from 50 Hz to 5000 Hz.
However, we had to correct these measurements by eliminating background noise. Therefore, for each specimen, we made a background noise measurement with the lining in place and the impact machine turned off. With the lining and the impact machine turned on, we took two measurements at two disturbance positions (see Figure 10).
In addition, we must measure the acceleration level experienced by the two mock-ups (slab with CLT board, without the lining). The parameter that expresses the insulation we achieve is the difference in levels. In this way, this difference of levels (with and without the lining) is obtained in third-octave bands, in each accelerometer, ‘a’, and in the two disturbance positions ‘t’: ΔLt, a. Finally, we calculate the spatial average (accelerometers and impact machine positions) of this parameter, obtaining ΔL in each band.


After clarifying the parameters of interest and the measurement cycle, we establish the connection between the three accelerometers and the data acquisition equipment, and configure the software ‘DewesoftX’ as shown in Figure 11. Thanks to the TEDS connection, the three channels automatically recognize and set the configuration required by each accelerometer.
The dynamic acquisition rate is 15 kHz, which means that the maximum frequency the system can measure is half this value, 7.5 kHz. Considering that we use an anti-aliasing filter, the bandwidth ultimately becomes 5859 Hz.


For this study, we mainly use the ‘Octave Analysis’ submodule, found in ‘Math’, to calculate (using ‘formula’ in the software) and export the acceleration level in third-octave bands, based on the acceleration measured by the accelerometers. On the other hand, one of the advantages of the software is that it can analyze data in frequencies.
Thus, we prepared the ‘FFT Analysis’ module in case, in a future study, we need to analyze the resonance frequencies of the system. In any case, it is useful to see the fast Fourier transform when collecting measurements, as it can provide information on their consistency. We use a total of 1024 lines, representing the system’s maximum amplitude (‘Peak Amplitude’) every 7.32 Hz on a linear graph, and we apply a ‘Transient’ window.
Another great advantage of the software is its ability to display the measurements taken. It allows you to customize the appearance of the dedicated tab simply and intuitively, with a wide variety of widgets. To view the results, we use time recorders that display the acceleration measured by the transducers, as well as 2D graphs to visualize the frequency spectrum (FFT Preview) and the octave graph (Octave Preview).
Additionally, we utilize an ‘indicator lamp’ to indicate the measurement storage, and a ‘digital meter’ to display the measurement duration. Figure 12 illustrates the design for data collection, where each row represents an accelerometer (a, c, d) and observes the three types of widgets mentioned for each case (1, 2, 3).


We export the acceleration levels in each third-octave band for each accelerometer from the software to process the data and obtain the parameters related to the achieved insulation.
Main results
The most relevant results are: Firstly, the background noise compared with the noise achieved when the machine is on. Next, we present the corrected and averaged acceleration level results. Finally, we compare the insulation achieved with each sample in the same graph, in third-octave bands.
In the acceleration level spectra, each sample represents six acceleration levels. These are differentiated with the codes nfu4, nfu10, and nfu20 (depending on the lining), and whether we use the ‘standard mock-up’ or the ‘NFU mock-up’. Additionally, we have two more levels in the two mock-ups (without lining), coded sin0.


Figure 13 shows the spatial average of the acceleration level in the ‘standard mock-up + nfu4’ specimen, in two situations: when the machine is operating on the specimen, and when it is off. The figure displays only one specimen, as the shape of the graph is very similar in all.
The graph differs when no lining is applied, due to the significant increase in the acceleration level when the machine is operating. This variation highlights the validity of the measurements taken, given the apparent difference in levels. They are similar only in the highest bands, with, for example, a difference of approximately 10 dB in the 5 kHz band.
On the other hand, we investigated the repeatability of the measurement, as well as the impact of the accelerometers' position on the results. We found that the vibration response measurements are independent of time and the position of the accelerometers within the specimen.

.")
Having clarified this, Figure 14 shows the spatial average of the three accelerometer positions and the two machine positions. The values represent corrected acceleration levels, eliminating background noise, in third-octave bands, for the four possible situations (‘nfu4’, ‘nfu10’, ‘nfu20’, and ‘sin0’) of the two mock-ups. It also includes the standard deviation of the values.
Several frequency intervals are distinguishable in these spectra. At low frequencies, up to 200 Hz in the standard mock-up, and up to 125 Hz in the NFU mock-up, the acceleration level of the six samples is very similar. The differences are of 3-5 dB, in the most favorable situations, relative to the mock-up (‘sin0’).
From 250 Hz in the standard mock-up and 160 Hz in the NFU mock-up, apparent differences begin to appear between the mock-ups and the specimens. Even between the ‘nfu4’ specimen and the ‘nfu10’ and ‘nfu20’ specimens. The difference is accentuated in the higher bands, reaching up to 60 dB-75 dB between ‘sin0’ and ‘nfu10’; and up to 30.7 dB between ‘nfu4’ and ‘nfu10’.
On the other hand, we observe another trend: Above 500Hz, the acceleration level in ‘nfu20’ is higher than in ‘nfu10’. Logically, we would expect that if the lining is thicker, it will reduce vibration more and therefore isolate sound more.
Finally, Figure 15 illustrates the impact sound insulation ΔL achieved in all samples in third-octave bands.


At low frequencies (50 Hz-125 Hz), we achieve the best insulation with the ‘nfu20’ lining, about 2dB in each band. From 125 Hz to 400 Hz, the ‘nfu20’ lining in both models continues to be the best option, with the ‘nfu10’ lining in the NFU model coming close to these samples.
In the 500 Hz to 2000 Hz range, the ‘nfu10’ lining in the NFU model provides the best possible insulation compared to the other situations studied (up to 5.5 dB more than ‘standard mock-up + nfu10’ in one of the bands). For insulation from the 2000 Hz band onwards, the best option is the ‘nfu20’ lining together with the standard mock-up (a difference of up to 5 dB compared to the closest line, which is ‘standard mock-up + nfu4’).
Conclusions and related works
Through these measurements, we have developed a methodology for studying impact sound insulation using lightweight slab mock-ups. The method opens up a new line of research in the department, enabling us to test other types of floor slabs and linings. Our second achievement was to obtain interesting information about the behavior of NFU as a lining in lightweight slabs.
Concerning the acceleration level, at low frequencies (50-125 Hz), we achieved no improvement with any lining. Compared to sin0, the only differences are around 2 dB in most cases, as seen in other studies on the subject [6].
For medium and high frequencies (125-5000 Hz), the presence of the lining significantly reduces acceleration levels, reaching a reduction of up to 75 dB at 5000 Hz. Regarding the improvement in impact sound insulation, in general, at low and medium frequencies (from 50 to 2000 Hz), the NFU mock-up attenuates vibrations more effectively than the standard mock-up.
Acknowledgements
We want to thank the ‘Desafio Universidad-Empresa’ contest, held in Castile and León, Spain, for the third prize in the 2021 edition for proposing the idea of this study and boosting its realization. Alberto Gutiérrez also thanks the multidisciplinary team responsible for the project: Marta Herráez, José Antonio Balmori Roiz, Milagros Casado Sanz, and María Machimbarrena Gutiérrez, for allowing his participation..
References
In related research articles, Arenas et al. [7] conduct tests in standardized, homologated rooms [2], seeking an empirical expression that allows for the prediction of impact sound insulation. On the other hand, Foret et al. [8] conduct tests with small-sized mock-ups of heavy slabs [3] with linings, and correlate the results with those obtained using standardized homologated rooms.
Jayalath et al, ‘Airborne and impact sound performance of modern lightweight timber buildings in the Australian construction industry’, Case Studies in Construction Materials, volume 15, December 2021. Access: July 27, 2025. [Online].
‘Acoustics. Laboratory measurement of the sound insulation of building elements, International Organization for Standardization, ISO 10140-2022.
‘Acoustics — Laboratory measurement of the reduction of transmitted impact noise by floor coverings on a small floor mock-up’, International Organization for Standardization, ISO 16251-1-2014.
“Sylomer”. Antivibration solution Sylomer. Access: July 27, 2025. [Online].
Dewesoft, ‘Vibration Measurement’, Access: July 27, 2025. [Online].
Martins, P. Santos et al., ‘Acoustic performance of timber and timber-concrete floors’, Construction and Building Materials, volume 101, part 1, 684-691 pages, December 2015. Access: July 27, 2025. [Online].
J.P. Arenas and L.F. Sepúlveda, ‘Impact sound insulation of a lightweight laminate floor resting on a thin underlayment material above a concrete slab’, Journal of Building Engineering, volume 45, 103537, January 2022. Access: July 27, 2025. [Online].
R. Foret, C. Jean-Baptiste, ‘A comparison of the reduction of transmitted impact noise by floor coverings measured using ISO 140-8 and ISO/CD 16251-1’, Forum Acusticum 2011, June 2011. Access: July 27, 2025. [Online].