Table of contents
Browse categories
Browse authors
 AL
ALAlessia Longo
 AH
AHAl Hoge
 AB
ABAljaž Blažun
 BJ
BJBernard Jerman
 BČ
BČBojan Čontala
 CF
CFCarsten Frederiksen
 CS
CSCarsten Stjernfelt
 DC
DCDaniel Colmenares
 DF
DFDino Florjančič
 EB
EBEmanuele Burgognoni
 EK
EKEva Kalšek
 FB
FBFranck Beranger
 GR
GRGabriele Ribichini
Glacier Chen
 GS
GSGrant Maloy Smith
 HB
HBHelmut Behmüller
 IB
IBIza Burnik
 JO
JOJaka Ogorevc
 JR
JRJake Rosenthal
 JS
JSJernej Sirk
 JM
JMJohn Miller
 KM
KMKarla Yera Morales
 KD
KDKayla Day
 KS
KSKonrad Schweiger
Leslie Wang
 LS
LSLoïc Siret
 LJ
LJLuka Jerman
 MB
MBMarco Behmer
 MR
MRMarco Ribichini
 ML
MLMatic Lebar
 MS
MSMatjaž Strniša
 ME
MEMatthew Engquist
 ME
MEMichael Elmerick
 NP
NPNicolas Phan
 OM
OMOwen Maginity
 PF
PFPatrick Fu
 PR
PRPrimož Rome
 RM
RMRok Mesar
 RS
RSRupert Schwarz
 SA
SASamuele Ardizio
 SK
SKSimon Kodrič
 SG
SGSøren Linnet Gjelstrup
 TH
THThorsten Hartleb
 TV
TVTirin Varghese
 UK
UKUrban Kuhar
Valentino Pagliara
 VS
VSVid Selič
 WK
WKWill Kooiker
Edge Computing for Structural Health Monitoring at KTH University

A team from KTH Royal Institute of Technology, IoTBridge, and Dewesoft has partnered to monitor the dynamic behavior of a four-story building model using advanced edge computing. By deploying accelerometers and strain gauges alongside lightweight edge devices, the project explores local, real-time data processing to minimize latency and reduce bandwidth requirements. This research supports more efficient structural health monitoring and provides insights for evaluating the integrity of buildings and bridges.
Introduction
At the Royal Institute of Technology, Kungliga Tekniska Högskolan (KTH), in Stockholm, Sweden. Recently, the university has partnered with two companies, IoTBridge and Dewesoft, to study, analyze, and monitor the dynamic behavior of the building frame model. The collected data will enable students to learn how to evaluate the structural dynamic properties of bridges and refine their models.

Kungliga Tekniska Högskolan (KTH), the Royal Institute of Technology, is the largest technical university in Sweden. The Structural Engineering and Bridges division at KTH’s Department of Civil and Architectural Engineering developed this bridge monitoring project. Professor Raeid Karoumi leads the joint project, which commenced in March 2025 with the construction of an open-source bridge database as its core objective.
The joint project involves the companies IoTBridge and Dewesoft. Swedish IoTBridge specializes in structural health monitoring. It is developing its own monitoring dashboard for bridge monitoring and integration of instrumentation solutions. Slovenian Dewesoft offers monitoring tools, including sensors, data acquisition devices with software, and databases.
Within the project, KTH provided the installation and data interpretation, while IoTBridge delivered the software used to build the bridge FEM. Dewesoft supplied the accelerometers and an IP67 computer to perform Edge Computing.
Civil engineer Qing-Chen Tang, PhD Candidate, was responsible for the KTH part. At the same time, the Dewesoft side was handled by monitoring business developer Daniel Colmenares and Swedish country manager Tobias Ljunggren.
Full research team:
PhD Candidate Qing-Chen Tang
Research Scientist Dr. Imane Bayane
Professor Raid Karoumi, Department of Civil and Architectural Engineering, KTH Royal Institute of Technology,
Emil Kool, IoTBridge AB
Project summary
With the rapid advancement of sensing technologies in vibration-based monitoring systems, a wide array of devices is now interconnected through cloud computing, facilitating seamless data exchange.
Despite these technological strides, significant challenges persist in the transmission and processing of large data volumes, primarily due to latency and bandwidth constraints. To mitigate these issues, edge computing has emerged as a compelling alternative, offering localized data processing capabilities that reduce transmission delays and minimize data redundancy.
Edge computing is a computing paradigm where data processing and analysis are performed close to the source of the data, at the "edge" of the network, rather than in a centralized cloud or data center.
This study investigates the feasibility of implementing edge computing on lightweight edge devices, specifically the KRYPTON® CPU data logger and the ESP32-S3 microcontroller. These two monitoring platforms—one equipped with accelerometers and the other with strain gauges—are deployed on a four-story building frame model.
We then subject the model to varying structural mass and damping conditions that influence its dynamic response. Both systems autonomously collect and locally cache acceleration and strain data using embedded code, enabling efficient and low-latency edge processing.
Experimental results validate the systems’ ability to detect changes in dynamic behavior, demonstrating their potential for applications such as fatigue assessment and structural damage detection. The proposed approach is scalable to dense sensor networks, offering a robust solution for large-scale structural health monitoring with significantly reduced dependence on centralized cloud infrastructure.
Edge computing
Engineers use structural monitoring to check the health of buildings and other structures by collecting and analyzing sensor data. This information enables engineers to make informed decisions about repairs and maintenance. However, for those decisions to be accurate, the data collected must be reliable.
Because buildings often face harsh conditions, it’s essential to utilize robust and reliable sensor systems. Thanks to new technology, these sensors can now share data through the internet using cloud platforms. For example, accelerometers can track vibrations in concrete. By comparing this data to that from an undamaged structure, we can identify early signs of problems, such as cracks.
However, sending large amounts of data quickly to the cloud isn’t always easy. It can slow things down, especially when internet connections are limited. That’s where edge computing comes in—it allows the sensor itself to process some of the data before sending it, which reduces delays and traffic.
In this case study, we examine how edge computing works with small devices, such as the KRYPTON data logger and ESP32-S3 microcontroller. These devices collect and process data from a model of a four-story building, even under changing conditions. Each system operates independently, enabling faster and more reliable data collection and reducing the likelihood of information loss.
Methodology
This section describes the experimental setup involving an instrumented four-story frame structure. It outlines the laboratory testing procedures, equipment used, and the methods employed for setup, implementation, and data processing.
Structural model description
The physical model consists of a four-story frame assembled from six wooden slabs, each with dimensions of 480 × 240 × 18 mm³. We joined two slabs together to form the base, while the remaining four represent the structure's floors (see Figure 1). Each floor is connected using four slender steel columns positioned at the corners, restricting vertical movement. Each column has a free length of 240 mm and a cross-sectional area of 1 × 10 mm².
This configuration allows horizontal displacement only, and we can model it as a multiple-degree-of-freedom (MDOF) lumped mass system. Figures 1 and 2 illustrate the first two theoretical mode shapes. The total weight of the structure, including timber and steel components, is approximately 6.95 kg.
Testing scenarios
We considered two test configurations:
The standalone frame model (Figure 1).
The frame model with an additional sloshing tank (containing 0.5 kg of pure water) placed on the second floor (Figure 2).


Vibration testing procedures
We conducted two types of vibration tests in the laboratory:
Forced vibration test
The frame model was mounted on a test bed and subjected to external excitation using a low-force LDS electrodynamic shaker (Figure 2). Two excitation types were applied:
Sine Sweep Excitation: We used a linear frequency sweep, where the applied force had constant amplitude but a time-varying frequency. The sweep function is defined by:
Where T is the test duration, f₁ the start frequency (0.1 Hz), and f₂ the end frequency (10 Hz). We set the sweep duration to 180 seconds. This method enabled the preliminary identification of the frame’s natural frequencies and corresponding mode shapes.
Single Frequency Excitation: Following the sine sweep, excitations at the identified natural frequencies were applied to determine the corresponding damping ratios. The shaker provided a constant-amplitude force at a fixed frequency for each test.
Free vibration test
In the second test, we removed the shaker. The top floor was manually displaced laterally to a controlled position using a ruler and then released, allowing the structure to oscillate freely until the motion ceased. This process was repeated for both testing scenarios (with and without the sloshing tank) to analyze the system’s free vibration response.


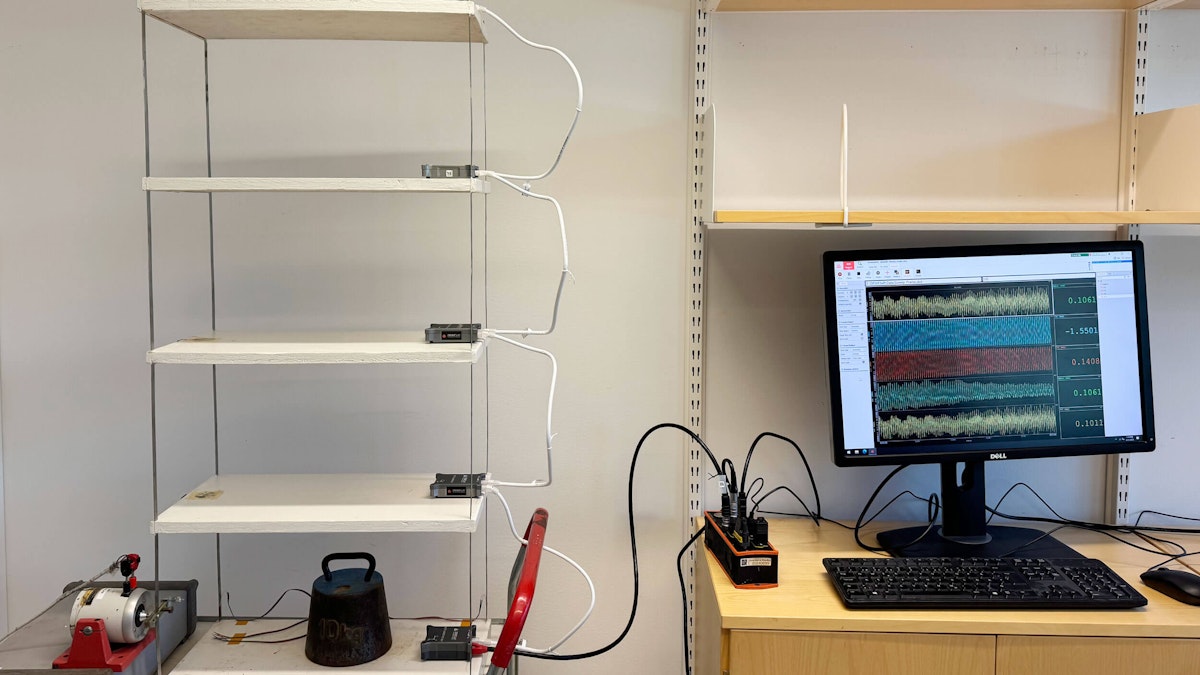
Structural health monitoring system
During the initial testing phase, we deployed low-noise IOLITE® 3xMEMS accelerometers (Figures 4, 5, and 6) at the edges of each floor of the frame model.
IOLITEi-3xMEMS-ACC is a 3-axial, low-noise (25 μg√Hz spectral noise density) accelerometer with an integrated DAQ and EtherCAT interface. It is fully waterproof and protected to IP67 standards. The device can measure structural accelerations in the X, Y, and Z directions.


IOLITEi-3xMEMS-ACC-INC is a 3-axial, low-noise (25 μg√Hz spectral noise density) accelerometer with an integrated DAQ and EtherCAT interface. It is fully waterproof and protected to IP67 standards. You can use it for static inclination monitoring of structures, such as bridges, viaducts, high-rise buildings, and wind turbines. It measures roll and pitch angles (about its X and Y axes) with the Z axis positioned vertically.
Inclinometer specifications:
Measurement range: +-15 deg
Resolution: 0.001 deg
Relative accuracy: 0.01 deg
Sample rate: 1 Hz
Bandwidth: <0.1 Hz
Offset temperature drift: 0.0001 deg/degC (typ.), 0.0005 deg/degC (max.)
Temperature range: -55 °C… 60 °C


IOLITEiw-3xMEMS-ACC-T is a 3-axial, low-noise (25 μg√Hz spectral noise density) accelerometer with an external digital temperature sensor, integrated DAQ, and EtherCAT interface. The device is fully waterproof with IP67 protection.
The device can measure structural accelerations in the X, Y, and Z directions, as well as temperature. Only the dedicated temperature sensor is compatible and ordered separately. It is a digitized temperature sensor with an accuracy of +-0.5 °C, a measurement range of -55 to 125 °C, and IP66 protection.
The 1-wire protocol enables communication between the sensor and the 3xMEMS-ACC device. The name of the sensor product is DS-TEMP-1WIRE-M8-Xm, where “X” denotes the cable length, with three options available: 2 m, 5 m, and 10 m. The maximum cable length is 10 m.
DS-TEMP-1WIRE-M8 temperature sensor specification:
Measurement range: -55 °C… 125 °C
Accuracy: +-0.5 °C (in the range of -10 °C to 85 °C)
Resolution: 0.063 °C
IP rating: IP66
DewesoftX 2023.4 and later releases support IOLITEi-3xMEMS-ACC-T

The sensors, weighing a combined 497 g, were securely mounted using double-sided adhesive to minimize signal drift and ensure stable, high-quality data acquisition. Each accelerometer was oriented so that its x-axis aligned with the direction of the frame’s horizontal displacement.
The accelerometers perform analog-to-digital conversion internally, thereby eliminating the noise typically introduced by analog cabling. The sensors were interconnected using high-quality CAT6 cables via an EtherCAT interface in a daisy-chain configuration (Figure 7). This setup reduces signal interference and minimizes data transmission errors.


Leveraging the modular IOLITE DAQ platform, each accelerometer operates with integrated data acquisition capabilities, achieving precise time synchronization with an accuracy of within 1 μs using distributed clocks. The processed acceleration data is then transmitted to a rugged, IP67-rated KRYPTON® CPU at the edge layer, enabling real-time, on-site data processing.
KRYPTON CPU is the smallest, highly portable, and extremely rugged IP67 data logger and data processing computer for data recording and analysis in extremely harsh environments with a wide operating temperature range of -40 to +70°C. It perfectly complements the KRYPTON data acquisition modules to form a stand-alone DAQ system (Figure 8).


We recorded data at a sampling rate of 100 Hz to ensure accurate capture of dynamic responses while preventing aliasing or signal distortion.
In the second round of testing, two HBM CLY41-3L linear strain gauges were attached to the surface of the steel columns at the base of the frame to measure strain during controlled free vibration (Figure 9).


The strain monitoring system includes two strain gauges, two amplifiers, two analog-to-digital converters (ADCs), and an ESP32-S3 microcontroller (MCU), as shown in Figure 10.


To accurately calculate strain values, the system amplifies and reads the voltage difference across a Wheatstone bridge circuit. Since this setup employs a quarter-bridge configuration, it cannot fully compensate for temperature changes, resulting in a strain that includes both standard and bending components. We calculate the effective strain (ε) using the following formula:
Where ε is the effective strain; εn is the normal strain; εb is the bending strain; εs is the apparent strain; k is the factor corresponding to HBM CLY41-3L linear strain gauge; Vo is the voltage difference between the bridge legs; Vs is the excitation voltage.
After amplification, the signal is digitized by external analog-to-digital converters (ADCs) and sent to the microcontroller unit (MCU) via the I²C communication protocol. Both strain gauges share the same MCU, which processes the data locally. We chose the ESP32-S3 for its compact size, low power use, and powerful dual-core LX7 processor. One core handles ADC sampling and data transfer, while the other processes the data in parallel. This setup ensures real-time performance without data loss. The ESP32-S3 also supports floating-point operations, which are essential for accurate strain calculations.
Additionally, the MCU can synchronize data from both strain gauges using its internal timer. When an ADC completes a reading, it notifies the MCU, which then timestamps the data for alignment during analysis.
Once the system has calculated the strain, each data point is timestamped and transmitted via USB to a laptop. There, a Python script processes the data and formats it into a .csv file for further analysis.
Signal processing
After the frequency sweep test, we use edge computing on the KRYPTON® CPU to analyze the collected acceleration data. Using Fast Fourier Transform (FFT), we converted the time-based acceleration signals into the frequency domain. This domain displays the vibration spectrum of the structure, including the amplitude (strength) and phase (timing) of vibrations.
From the peaks in the spectrum, we calculated the damping ratio for each natural frequency using the half-power bandwidth method. For lightly damped systems, the damping ratio (ζ) is:
Where fn is the natural frequency corresponding to the resonance peak; fl and fr are the left and right frequencies at which the peak drops to half power of the resonance peak (-3 dB, or 1/√2 amplitude in the spectrum), respectively. For free vibration tests, you can also find the damping ratio by looking at how the vibration amplitude decreases over time, using the logarithmic decrement method:
Where A(t) and A(t+nT) are the amplitudes corresponding to time t and t+nT, respectively; T is the natural period; n is any integer number of successive, absolute peaks. Assume the structure is linearly elastic with small deformation, and there is a linear relationship between the strain and displacement in one dimension, allowing the application of the logarithmic decrement method to the strain signals.
Assuming the structure behaves elastically with small deformations, strain amplitude can be used in these equations instead of displacement. Filtering is applied to isolate the first mode before using the formulas above. Following the strain time series, the Rainflow counting method analyzes strain cycles. Then, the rain-flow histogram is obtained statistically for future fatigue assessment.
Testing results
Figure 11 shows the accelerations from the second floor and the fourth floor with and without the sloshing tank on each floor.


The analysis of the time-history acceleration data from each floor reveals that resonance occurs when the sweep frequency approaches the natural frequencies of the frame model. Due to the proximity of the excitation to the first floor, the horizontal acceleration on this floor is more pronounced compared to the fourth floor.
Notably, when the sweep frequency coincides with the natural frequency of the first mode (approximately 1 Hz), the sloshing tank on the second floor has a negligible effect on reducing the frame’s response across the floors. This effect can be attributed to the relatively small modal amplitude of the second floor in the first mode, as illustrated in Figure 1.
Conversely, when the sweep frequency reaches the natural frequency of the second mode (around 3 Hz), the sloshing tank demonstrates a significant reduction in the vibration response of all floors.
In this mode, the first, second, and fourth floors exhibit the largest displacements, optimizing the damping effect of the sloshing tank. However, the third floor experiences minimal displacement in the second mode, limiting the tank's impact at this location. Beyond the second mode, the effectiveness of the sloshing tank in mitigating structural vibrations becomes less pronounced.
Analysis of the acceleration FFTs presented in Figure 12(a) reveals two prominent peaks, corresponding to the first two natural frequencies of the frame model. Figure 12(b) further illustrates that the sloshing tank is more effective in damping vibrations at the second mode.
Additionally, in the vicinity of the second mode, the FFT spectrum exhibits several smaller peaks compared to the scenario without the tank. This behavior suggests that the sloshing tank attenuates the primary peak in the second mode, fragmenting it into multiple smaller peaks, a phenomenon akin to the functioning of a tuned mass damper.
The added mass and damping provided by the sloshing tank cause a slight decrease in the natural frequencies of each mode. However, the reduction in the peak corresponding to the first mode is notably less pronounced than that in the second mode, as seen in Figure 12(a). We can attribute this discrepancy to the shaker's positioning.
As shown in Figure 1, the maximum displacement in the first mode occurs at the top floor, whereas the shaker is positioned at the base of the steel column, leading to a reduced displacement in the first mode. Additionally, the limited duration of the frequency sweep excitation during the test prevented the frame from accumulating sufficient energy to establish a stable first-order modal response.


Figure 13 shows the dynamic strains of the frame model under controlled free vibration, measured by strain gauge 1, which exhibit approximately sinusoidal behavior across the entire frequency spectrum. Furthermore, with the sloshing tank installed on the second floor, the frame model exhibits reduced oscillations, indicating enhanced damping performance.


Figure 14 presents the FFTs of strain gauge 1. As observed, the initial disturbance on the top floor has effectively excited the first mode. Additionally, the sloshing tank placed on the second floor reduces the structural responses in the second mode, not the first mode, as previously explained.

.")
Table 1 and Table 2 present the natural frequencies of the frame model with and without the sloshing tank, corresponding to the acceleration and strain FFTs, identified through the peak-picking algorithm within the range of 0-4 Hz.
| Mode | Sweep | Single | Free |
|---|---|---|---|
| 1 | 1.04 | 1.03 | 0.99 |
| 2 | 3.00 | 2.99 | 2.96 |
Note: Sweep indicates the sweep test; Single the single frequency excitation test; and Free the controlled free vibration test.
| Mode | Single | Free |
|---|---|---|
| 1 | 0.73 (0.78) | 0.75 (0.79) |
| 2 | 0.24 (0.34) | 0.27 (0.34) |
Note: Sweep indicates the sweep test; Single the single frequency excitation test; and Free the controlled free vibration test.
The results presented above demonstrate that the natural frequencies of the frame model, as measured in various vibration tests, exhibit a high degree of consistency, with a maximum error of less than 5%, which falls within the acceptable range of measurement error.
The natural frequency obtained during controlled free vibration is the most accurate, as it reflects the actual frequency of the system in the absence of external excitation from the shaker.
In contrast, during frequency sweeps and single-frequency excitations, various factors, such as excitation conditions, coupling effects, and phase lag, can significantly influence the results. We based the identification of the natural frequency of the frame model on resonance peaks, which typically align with the system's natural frequencies.
However, in the presence of damping or slight nonlinearity, the resonance peak may experience a minor shift. Additionally, in a multiple-degree-of-freedom (MDOF) system, mode interactions and coupling effects can lead to shifts in the observed resonance peaks, even if the actual natural frequencies of the modes remain unchanged.
Theoretically, single-frequency excitation results in fewer errors compared to frequency sweep excitation, as it allows for more time to establish a stable response at a specific mode. In contrast, during frequency sweep excitation, the natural frequency may be traversed before the system has fully established a steady-state response, leading to a response lag and a slight overestimation of the natural frequency.
Table 3 presents the damping ratios obtained from both single-frequency excitation and free vibration tests. As observed, the results show excellent agreement, indicating that the measurements from these two testing methods are consistent, thus confirming the reliability and accuracy of the data.
The damping ratio for the first mode is notably higher than that for the second mode, suggesting that the frame model dissipates energy more rapidly in the first mode due to its higher damping characteristics. Furthermore, the sloshing tank contributes significantly to the overall damping, particularly in the second mode, where it induces a damping increase of 0.07–0.10%. This increase indicates that the sloshing tank has a more pronounced effect on vibration mitigation in the second mode compared to the other modes.
| Mode | Single | Free |
|---|---|---|
| 1 | 0.73 (0.78) | 0.75 (0.79) |
| 2 | 0.24 (0.34) | 0.27 (0.34) |
Conclusion
This study investigates the integration of edge computing into various lightweight edge devices, specifically the KRYPTON® CPU data logger and the ESP32-S3 microcontroller. In each monitoring system, we strategically deployed sensor nodes to collect measurement data, including accelerations and strains, from a four-story building frame model under two distinct scenarios, which involve variations in structural mass and damping.
The experimental results confirm that these monitoring systems are capable of detecting changes in the structural dynamic properties under vibration, providing a solid foundation for future fatigue assessment and structural damage detection.
Furthermore, the proposed methodology is scalable, enabling the deployment of dense sensor networks that can aggregate data from multiple locations within large-scale structures. As such, edge computing plays a crucial role in reducing the volume of data transmitted to cloud servers, thereby enhancing the efficiency of structural health monitoring systems and facilitating more robust and timely assessments of structural integrity.
Reference
Tang, Q.-C., Kool, E., Colmenares, D., Bayane, I., & Karoumi, R. (2023). Exploration of edge computing for monitoring a four-story building frame model. Proceedings of the 13th International Conference on Structural Health Monitoring of Intelligent Infrastructure (SHMII-13).