Table of contents
Browse categories
Browse authors
 AB
ABAlberto Boffi
 AL
ALAlessia Longo
 AH
AHAl Hoge
 AB
ABAljaž Blažun
 BJ
BJBernard Jerman
 BČ
BČBojan Čontala
 CF
CFCarsten Frederiksen
 CS
CSCarsten Stjernfelt
 DC
DCDaniel Colmenares
 DF
DFDino Florjančič
 EB
EBEmanuele Burgognoni
 EK
EKEva Kalšek
 FB
FBFranck Beranger
 GR
GRGabriele Ribichini
Glacier Chen
 GS
GSGrant Maloy Smith
 HB
HBHelmut Behmüller
 IB
IBIza Burnik
 JO
JOJaka Ogorevc
 JR
JRJake Rosenthal
 JS
JSJernej Sirk
 JM
JMJohn Miller
 KM
KMKarla Yera Morales
 KD
KDKayla Day
 KS
KSKonrad Schweiger
Leslie Wang
 LS
LSLoïc Siret
 LJ
LJLuka Jerman
 MB
MBMarco Behmer
 MR
MRMarco Ribichini
 ML
MLMatic Lebar
 MS
MSMatjaž Strniša
 ME
MEMatthew Engquist
 ME
MEMichael Elmerick
 NP
NPNicolas Phan
 OM
OMOwen Maginity
 PF
PFPatrick Fu
 PR
PRPrimož Rome
 RM
RMRok Mesar
 RS
RSRupert Schwarz
 SA
SASamuele Ardizio
 SK
SKSimon Kodrič
 SG
SGSøren Linnet Gjelstrup
 TH
THThorsten Hartleb
 TV
TVTirin Varghese
 UK
UKUrban Kuhar
Valentino Pagliara
 VS
VSVid Selič
 WK
WKWill Kooiker
What Is Condition Monitoring and Why Is Preventing Machinery Failures Important?

September 30, 2025
Machines break, that’s inevitable. Using condition monitoring, engineers can accurately predict when this is likely to happen. In this article, we will learn:
Why do machines fail?
What types of machine maintenance exist?
Why is preventing machine failures critical?
What machine condition monitoring really is?

Why do machines fail?
Machines fail for various reasons, and not all failures are the same. Machinery fails or loses its usefulness when it stops functioning as designed.
This loss of usefulness is broken down into three main categories:
surface degradation
obsolescence and
accidents
Surface degradation of machine parts results in the machine’s loss of usefulness in the vast majority of cases and comprises mainly mechanical wear and corrosion.
Why is preventing machinery failures critical?
Every unexpected stop in production, due to equipment failures, has a significant influence on the company's productivity, repair and other costs, revenue, profits, and finally competitiveness. It is estimated that downtime costs automotive manufacturers around 22 thousand USD per minute or 1.4 million USD per hour. This is why facility owners are constantly seeking ways to eliminate failures while keeping maintenance costs at the lowest possible level.
This is the point where Condition Monitoring as a basis for predictive maintenance kicks in. Proper Condition Monitoring helps companies to:
Lower repair costs
Reduce maintenance costs
Increase plant life
Increase personnel safety
Increase revenue
Increase profitability
Types of machinery maintenance
Several different types of machinery maintenance exist, but in general, we divide them into two categories:
Preventive maintenance
Corrective maintenance
What is corrective maintenance?
Corrective maintenance is a technique where correction is done after the failure occurs. It is used for machines that are very low cost, easy to replace, and whose malfunctioning does not significantly affect productivity.
What is preventive maintenance?
Preventive maintenance is a technique where maintenance is performed before failure occurs. The most renowned preventive maintenance techniques are:
Time-based Maintenance (TBM)
Predictive Maintenance
Condition-Based Maintenance (CBM)
In 1736, when he was advocating for better fire prevention in Philadelphia, Benjamin Franklin famously advocated, “an ounce of prevention is worth a pound of cure.” Surely it is better to prevent a fire than to try to extinguish one. This common-sense approach is at the centre of preventative maintenance.
Time-based maintenance (TBM)
Time-based maintenance is performed at regular intervals. Refers to the replacement of an item regardless of its real condition. Typically, it is performed at intervals prescribed by the machine manufacturer and used as the basis of the Mean Time Between Failure (MTBF) data.
Predictive maintenance
The predictive maintenance goal is to predict when a failure will occur, based on the data obtained from the condition monitoring system. When engineers are alerted that a problem is developing, they can take steps to move the affected system out of a critical position while maintenance is performed. When the issue is resolved, they move it back seamlessly afterward. Therefore, predictive maintenance can not exist without Condition Monitoring.
Condition-based maintenance (CBM)
Condition-based maintenance (CBM) is a maintenance strategy that monitors the actual condition of an asset to determine the necessary maintenance. CBM dictates that maintenance should only be performed when specific indicators show signs of decreasing performance or upcoming failure.
What is machine condition monitoring?
Machine condition monitoring is a process of checking the status of the machinery during its regular operation. It consists of data acquisition, data processing, and data comparison with trends, baseline, and representative data from similar machines.
Machine condition monitoring background
Humans are subject to condition monitoring when visiting a doctor for a health check. To determine a patient's general health status and track disease progression, various examinations are conducted, depending on the patient's age and condition.
Generally, a check-up includes:
An interrogation: the doctor asks the patient to describe the symptoms he feels.
Auscultation: Using a stethoscope, the doctor listens to body sounds such as heartbeat, waterborne sounds, and carotid and femoral artery sounds.
An electrocardiogram or ECG: This examination corresponds to the electrical activity of the heart via electrodes placed at the ankles, the handles, and on the chest.
X-ray of the chest: Detects possible problems in the chest, lungs, and heart.
In industry, the condition monitoring of machines is performed by machine doctors called predictive maintenance engineers (PdM's). Their role is to use diagnostic systems to prevent unexpected production downtime and catastrophic failures with minimum production stops and minimum maintenance costs. What parameters do they check? Numerous parameters can be checked, including visual inspection, oil levels, oil debris, temperatures, corrosion, vibration, and pressures.
The development of condition monitoring started long ago with simplified measurements. In 1850, railway maintenance technicians used wheel-tapping hammers to check the state of the wheels on locomotives. By hitting the wheels and analyzing the sound, they assessed the wheels' state. For example, a dull sound indicated a cracked wheel.
Progress in electronics and software development is dramatically changing machine condition monitoring, making it more straightforward to use, replacing subjective analysis with objective observations.
Condition monitoring applications
Condition monitoring applies to thousands of applications, but the best-known include:
Industrial plant and facilities of all types: Gearboxes, UPS, AC, electric motors, fans, and pumps.
Pulp & Paper: Blowers, conveyor belts, chippers, chip classifiers, refiners, pressure screens, screw conveyors, agitators, nip monitoring, felt rollers, etc.
Iron & Steel: Raw material handling machines, conveyor belts, ship unloaders, galvanization plants, stack reclaimers, continuous casters, cranes, rolling mills, annealing machinery, and also pumps, fans, gearboxes, etc.
Automotive: Wind Tunnels, Air handling units, and pumps in paint shops, as well as presses and transfer presses, etc.
Cement: Crushers, gearboxes, conveyor belts, separators, fans, raw mills, ball mills, elevators, and blowers.
Power generation plants: gas turbines, steam turbines, water pumps, etc.
Machine condition monitoring steps
To successfully implement a machine monitoring program, it is essential to follow a well-structured approach in the following steps:
STEP 1: Set up the equipment register
STEP 2: Assessment of machinery status and its criticality for the facility operation
STEP 3: Identification of appropriate machine condition monitoring techniques for each of the available assets
STEP 4: Selection of available technologies on the market
STEP 5: Installation of the condition monitoring system
STEP 6: Data collection and data interpretation
STEP 7: Maintenance tasks determination
Let's look at each of the steps in detail.
STEP 1: Set up of equipment register
The register usually includes:
Process drawings
Wiring diagrams
Exact details of each machine (type, speed, coupling, power, etc.)
Asset position for easy asset finding
Unique ID number
STEP 2: Assessment of machinery status and criticality
A review of past asset failures, including analysis of MTBF (Mean Time Between Failures) and MTTR (Mean Time to Repair), as well as the average costs of repair and replacement, the cost of downtime, and the risk of secondary damage, should be conducted. This helps identify and select optimal machine condition monitoring techniques and technologies.
STEP 3: Identification of appropriate techniques for each asset
Several machine condition monitoring techniques are used for the assessment of machine conditions. Let's take a look at the ones used most frequently:
Temperature monitoring
It has been adopted for machine health assessment over the last decades. Several methods of temperature monitoring range from passive, non-contact Infrared (IR) cameras to active sensor-based (using thermocouples and RTDs).
IR cameras provide a good overview of machines or control electronics and indicate overheating problems. Contact measurement is very useful for the early detection of lubrication-related issues, but not for detecting physical damages such as bearing cracks and spalls.
Check out Dewesoft Temperature Data Loggers
Vibration monitoring
It is a very old and the most commonly used method for assessment of the machine's condition. It helps us detect the failure and understand its root cause. Accelerometers are used to monitor changes in amplitude across a wide frequency range. Vibration monitoring permits you to understand phenomena such as misalignment, unbalance, looseness, gear tooth issues, or bearing wear before failure.
Acoustic emission
Acoustic emission sensors are increasingly being used for condition-based monitoring due to their numerous advantages in early fault detection. However, it is not a suitable method for permanent monitoring installations due to its massive data storage requirements, which stem from its high-frequency operation (a few kHz to MHz), and its high prices compared to other available solutions on the market. It is also difficult to pinpoint the source of the sounds that the sensors measure.
Ultrasound testing
It is a very cost-efficient technology used especially to answer the initial question of whether a machine is healthy or not. Ultrasound detectors typically measure sound pressure waves in the frequency range between 30 kHz and 40 kHz.
Pressure waves are measured using a resonant sensor, which transforms waves into a small electrical charge. It is typically used alongside vibration monitoring techniques. Technicians use ultrasound to filter good machines from bad machines and then perform an in-depth vibration analysis of the bad equipment to find the root cause of the issues.
Oil analysis
This is performed in laboratories using chemical tests to determine the state of the oil. Nowadays, tribology sensors for permanent oil quality monitoring exist. The results indicate whether the oil should be changed. This technology is very rarely used to assess the condition of the asset and is more focused on determining the condition of the lubricant (viscosity, basicity, etc.). However, tracking oil levels and quality is crucial to prevent costly repairs.
STEP 4: Selection of available technologies
As we learned so far, there is a wide range of available techniques for machine health monitoring. The best strategy for every maintenance technician would be to use a combination of all of them to gain the best results. However, due to budget and time limitations, vibration diagnostics in combination with temperature measurements have proven to be the most effective so far.
STEP 5: Installation of condition monitoring sensors
The installation of the condition monitoring sensors is vital for their performance. Incorrect mounting will most probably give you data that relates not only to a change in conditions but also to the instability of the sensor itself. Therefore, this makes the sensor’s data unreliable.
Several different mounting methods exist:
Wax mounting: Convenient, but not recommended for mounting accelerometers. The inconsistency in thickness and the damping effect (low rigidity) of the wax lead to unreliable results at higher frequencies.
Adhesive mount: Good when a stud mount is impractical or not possible (i.e., when drilling is not permitted).
Magnet mount: Appropriate for troubleshooting or periodical measurements. Magnetic mounting adapters are used to attach accelerometers to the ferromagnetic material.
Stud mount: Ideal for permanent and high-frequency vibration monitoring.
Vibration sensors should be mounted in locations that ensure the measurement of vertical, horizontal, and axial movement:
To detect imbalance and bearing issues, horizontal measurements need to be taken. In this case, the sensors should be mounted as close as possible to the motor bearings and pump bearings. To detect looseness and problems with structural rigidity or foundation, vertical measurement needs to be taken with sensors placed close to the motor and pump drive end bearings.
To detect misalignment between the motor and the load, axial measurements need to be done. In this case, sensors should be attached close to the motor and pump drive end bearings.
Accelerometers should be mounted as close as possible to the source of vibration. Mounting on a clean, smooth, flat, unscratched surface via a drilled and tapped hole is highly recommended to obtain a stable position of the sensor, especially when measuring high-frequency vibrations. Make sure that the screw is not longer than the threaded hole. There should be no spacing between the sensor and the measured object. When drilling holes is not allowed, strong glue with metallic properties can be used. This ensures good vibration transmission.
STEP 6: Data collection and analysis
Machines communicate via their vibrations (and temperatures) when running. Therefore, it is essential to understand vibration to be able to assess the machine's condition. But how do we do that?
Sensors
Data Acquisition Hardware
Condition Monitoring Software
Sensors
Sensors are devices connected to the measurement point whose purpose is to detect physical phenomena, events, or changes and translate them to proportional electrical values. Various sensors are used in condition monitoring and range from displacement transducers to accelerometers, shock-pulse transducers, and velocity transducers. Each of them fits the purpose for which they have been developed. The main difference is the accuracy they offer in a specific frequency range:
Displacement transducers are helpful in the frequency range from 0 to 200 Hz.
Velocity transducers are ideal for mid-range frequencies from 2 Hz to 1 kHz.
Accelerometers are the best in the range from 5 Hz to 20 kHz.
In addition to their accuracy and frequency response, there are several other factors to consider when selecting a transducer:
Temperature range
Weight
Size
Dynamic range
Sensitivity
Price
Isolation
Mounting possibilities
IP – Ingress protection
Wireless or wired
Eddy current proximity probes measure the displacement of stationary signals (DC) or very low-frequency signals. They detect the inhomogeneities of metal material by sensing changes in a magnetic field generated by a reference coil. Proximity probes are used for non-contact displacement measurements and usually need to be permanently mounted on the machine.
The most commonly used sensors to measure vibration are accelerometers. There are several types of accelerometers. The most frequently used are:
Capacitive MEMS
FBA (Force Balance Accelerometers)
Piezoelectric Accelerometers (IEPE accelerometers)
Accelerometers can be wireless or wired. Wireless accelerometers are very easy to mount, since no cables are required, but are not at all appropriate where dynamic (high-speed), real-time measurements are needed due to their battery life limitations.
Data collectors – data acquisition hardware
Data Acquisition (DAQ) systems convert sensor outputs into digital values that can be displayed in a variety of graphical ways, stored to disk, and analyzed.
The key elements of a DAQ system are:
Signal conditioning
Analog-to-Digital Converters (ADC)
Computer with display, data storage, and DAQ software
Signal conditioning
Signal conditioning is the part of the data acquisition unit circuitry that prepares the analog signal coming from the sensor to be ready to be acquired by the ADC. The signal conditioning circuitry transforms the signal by amplifying, filtering, attenuating, and possibly isolating it.
Analog to digital converters (ADC)
ADCs convert the analog signals from the signal conditioners to the digital domain so that the computer can process them. The main characteristics of ADC converters are their vertical resolution (expressed in bits) and sampling rate (expressed in samples per second). DAQ systems like SIRIUS DualCore, for example, have 24-bit sigma delta ADCs that can sample up to 200 kS/s per channel, simultaneously. SIRIUS XHS provides sampling rates up to 15 MS/s per channel.
Computer with display, data storage, and DAQ software
A Windows computer is almost always either built into a DAQ system or connected to it via USB, EtherCAT, or Ethernet. Running DAQ software, this computer manages the operations of the DAQ system, providing data display to the users, allowing mathematical functions like filtering and other computations to be performed, data storage, and post-processing tasks.
Some DAQ systems, including the Dewesoft OBSIDIAN, have an internal embedded ARM processor and software for data processing, storage, display, and analysis.
Condition monitoring software
Condition monitoring software is available for monitoring specific machines, while more general analysis tools are configurable to handle a variety of machines.
The best DAQ and condition monitoring software packages are powerful and yet easy to use. Dewesoft Data Acquisition systems, with their wide range of analog and digital inputs, offer support for almost any kind of third-party sensor. Digital and analog output devices provide the ability to drive actuators or switches.
All EtherCAT-compatible devices (IOLITE, KRYPTON) can be connected to the same network, allowing users to build a virtually unlimited channel chain by using a single cable delivering power, synchronization, and data. The whole EtherCAT chain is synchronized to 1 microsecond, regardless of the distance. Node-node distances can be up to 100 meters.
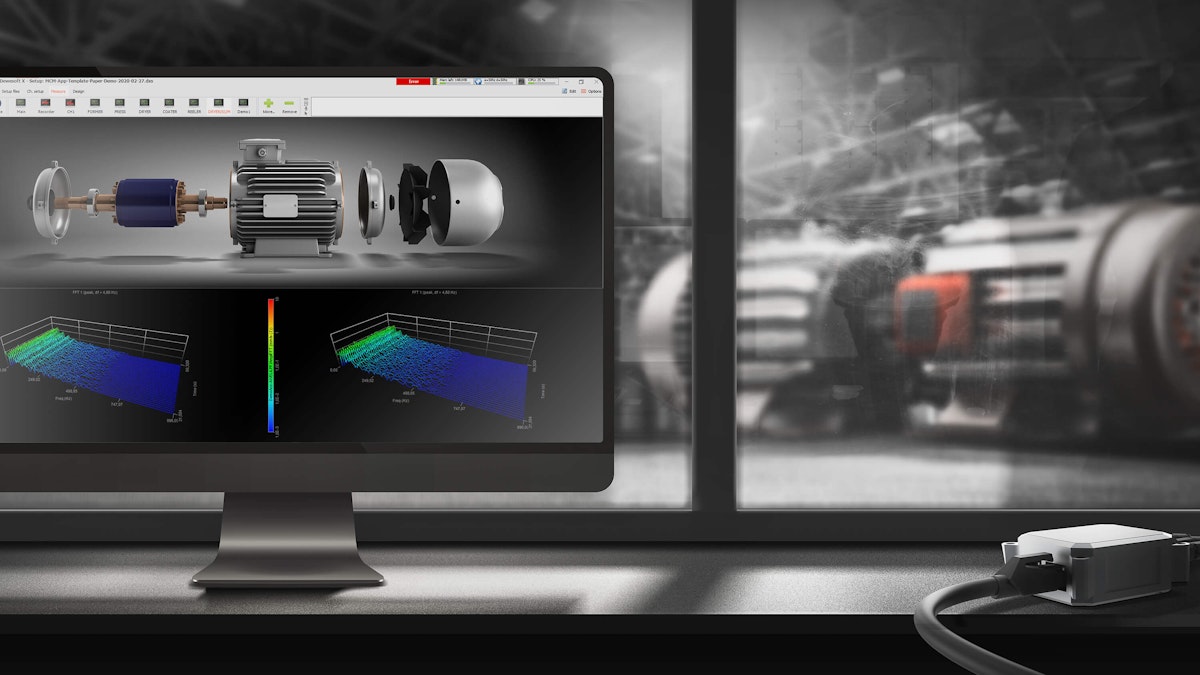
All the raw data from data acquisition devices are collected and processed by measurement units running the DewesoftX Machine Condition Monitoring software. Processed data is sent over the TCP/IP network to the server. Data can be accessed and viewed on the client PC or stored in the time series database (Historian) and served to SCADA systems or Cloud Software using standard interfaces such as OPC UA to support Industry 4.0 applications.
Software features and typical machine faults
| Typical Machine Faults | Misalignment | Loose foot/foundations | Stator eccentricity | Rolling Bearing defects | Journal Bearing wear out | Gear tooth failure | Cavitation | Turbine blades wear | Structural resonances | |
|---|---|---|---|---|---|---|---|---|---|---|
| Baseband FFT | ✓ | ✓ | ✓ | ✖ | ✓ | ✓ | ✓ | ✓ | ✓ | ✖ |
| Envelope Detection | ✖ | ✖ | ✖ | ✖ | ✓ | ✖ | ✓ | ✖ | ✖ | ✖ |
| Order Tracking | ✓ | ✓ | ✓ | ✖ | ✓ | ✖ | ✓ | ✓ | ✓ | ✖ |
| Cepstrum Analysis | ✖ | ✖ | ✖ | ✖ | ✓ | ✖ | ✓ | ✖ | ✓ | ✖ |
| Frequency Response Function | ✖ | ✖ | ✖ | ✖ | ✖ | ✖ | ✖ | ✖ | ✖ | ✓ |
| Orbit Plot | ✓ | ✓ | ✖ | ✖ | ✖ | ✓ | ✖ | ✖ | ✖ | ✖ |
| Shaft centerline plot | ✓ | ✓ | ✖ | ✖ | ✖ | ✓ | ✖ | ✖ | ✖ | ✖ |
| Two-plane balancing | ✓ | ✖ | ✖ | ✖ | ✖ | ✖ | ✖ | ✖ | ✖ | ✖ |
| Displacement, Velocity, Acceleration | ✓ | ✓ | ✓ | ✓ | ✓ | ✓ | ✓ | ✓ | ✓ | ✓ |
| RMS, Peak-Peak, Peak | ✓ | ✓ | ✓ | ✓ | ✓ | ✓ | ✓ | ✓ | ✓ | ✓ |
| Tolerance Curves | ✓ | ✓ | ✓ | ✓ | ✓ | ✓ | ✓ | ✓ | ✓ | ✓ |
| Analysis Bandwidth and Resolution | ✓ | ✓ | ✓ | ✓ | ✓ | ✓ | ✓ | ✓ | ✓ | ✓ |
| Multi-Analysis | ✓ | ✓ | ✓ | ✓ | ✓ | ✓ | ✓ | ✓ | ✓ | ✓ |
| Tachometer & trigger | ✓ | ✓ | ✓ | ✓ | ✓ | ✓ | ✓ | ✓ | ✓ | ✓ |
| Time Data Recorder | ✓ | ✓ | ✓ | ✓ | ✓ | ✓ | ✓ | ✓ | ✓ | ✓ |
| Time Data Editing | ✓ | ✓ | ✓ | ✓ | ✓ | ✓ | ✓ | ✓ | ✓ | ✓ |
| Operating Deflection Shapes | ✖ | ✖ | ✖ | ✖ | ✖ | ✖ | ✖ | ✖ | ✖ | ✓ |
STEP 7: Maintenance tasks determination
Once the data is collected, it must be interpreted to extract meaning and thus value from it. There are two ways to do it:
Manually, by a qualified Predictive Maintenance Engineer (PdM). They can be employed or outsourced from companies offering PdM services.
Automatically, using commercially available predictive maintenance software.
Both options have their benefits and drawbacks. Qualified PdMs are generally expensive and spend a lot of time analyzing the data. However, once they know the machine in detail, they can very reliably predict its failure and set appropriate scheduled maintenance tasks well in advance.
Automated predictive maintenance software solutions are way less expensive but far less reliable. Consider the vast array of equipment types and the diverse environments and conditions in which they operate. Because of that, it is impossible to set a unique baseline for all of them and set unique thresholds for alarms. The best solution is often a combination of automatic analysis of non-critical machines and manual analysis for mission-critical machines.
Conclusion
The efficiencies of mechanical equipment can be increased by using top-notch Machine Condition Monitoring solutions. Dewesoft system integrators work with each company to deliver customized, turn-key solutions that improve the reliability, safety, and efficiency of your production plant.
More information


