Table of contents
Browse categories
Browse authors
 AB
ABAlberto Boffi
 AL
ALAlessia Longo
 AH
AHAl Hoge
 AB
ABAljaž Blažun
 BJ
BJBernard Jerman
 BČ
BČBojan Čontala
 CF
CFCarsten Frederiksen
 CS
CSCarsten Stjernfelt
 DC
DCDaniel Colmenares
 DF
DFDino Florjančič
 EB
EBEmanuele Burgognoni
 EK
EKEva Kalšek
 FB
FBFranck Beranger
 GR
GRGabriele Ribichini
Glacier Chen
 GS
GSGrant Maloy Smith
 HB
HBHelmut Behmüller
 IB
IBIza Burnik
 JO
JOJaka Ogorevc
 JR
JRJake Rosenthal
 JS
JSJernej Sirk
 JM
JMJohn Miller
 KM
KMKarla Yera Morales
 KD
KDKayla Day
 KS
KSKonrad Schweiger
Leslie Wang
 LS
LSLoïc Siret
 LJ
LJLuka Jerman
 MB
MBMarco Behmer
 MR
MRMarco Ribichini
 ML
MLMatic Lebar
 MS
MSMatjaž Strniša
 ME
MEMatthew Engquist
 ME
MEMichael Elmerick
 NP
NPNicolas Phan
 OM
OMOwen Maginity
 PF
PFPatrick Fu
 PR
PRPrimož Rome
 RM
RMRok Mesar
 RS
RSRupert Schwarz
 SA
SASamuele Ardizio
 SK
SKSimon Kodrič
 SG
SGSøren Linnet Gjelstrup
 TH
THThorsten Hartleb
 TV
TVTirin Varghese
 UK
UKUrban Kuhar
Valentino Pagliara
 VS
VSVid Selič
 WK
WKWill Kooiker
Frequency Stabilization: Primary Control of Hydro Turbines - Part II

The previous article on this issue provides background and introduction to the topic, including the testing of frequency measurement transducers, which are a crucial part of the control system. This article will cover the development of test methods for validating governor performance and trouble-shooting or optimization of turbine governors.

See also:
The TSO and requirements
The Transmission System Operator (TSO) has the overarching responsibility for the stability of the grid. This responsibility is managed through rules and regulations - requirements manifested by so-called Grid or Network Codes and supporting documents - and through follow-up of those requirements by testing and validation. In Sweden, Svenska Kraftnät (SvK) is the TSO. In Europe, the European Network of Transmission System Operators for Electricity (ENTSO-E) is the association for the cooperation of the European TSOs. 39 member TSOs representing 35 countries are participating.
A simple explanation of how this works is that the EU issues a regulation - normally after consulting or involving ENTSO-E. The ENTSO-E then interprets and integrates the regulation requirements into the grid codes, whereafter each TSO makes the necessary adaptions to specific local conditions.
The grid codes are constantly evolving. In the Nordic regional group, new requirements for primary regulation (primarily FCR, see Part I, are expected to be released after many years of development, testing, and validation.
This article is based on Swedish conditions under draft Grid Codes by SvK. However, similar requirements and test methods exist or are to be implemented in most European synchronous grids over time.
Tests
The basic concept is that the provider of an ancillary service shall provide a theoretical, unit-specific model that with a reasonable (stated) accuracy can predict the unit’s behaviour. The model must be verified by unit-specific tests, each unit must be tested, and the tests and their evaluation is in detail described by the TSO (SvK).
The service under scrutiny in this article is FCR-N and FCR-D. FCR stands for Frequency Containment Reserve, basically a type of primary regulation. N denotes normal regulation and D denotes disturbed regulation. FCR-N is in operation in the frequency span of 49.9 – 50.1 Hz and its purpose is to handle minor disturbances which are always present on a grid. FCR-D is in operation below 49.9 Hz and shall be fully activated at 49.5 Hz. Its purpose is to handle major disturbances, the faults, which dimensions the size of the reserve is a trip (disconnection) of the largest producer or HVDC transmission in the synchronous area – typically one of the largest nuclear units.
Primary regulation needs to be fast and must also respect the stability requirements of the grid. These two requirements are to some extent contradictory - speeding up the regulation often decreases stability - and involve unit-specific optimization that will always be a trade-off.
The tests aim at identifying a transfer function from a frequency(deviation) to the power response of the unit. Hence the actual grid frequency, which the governor uses as input for its regulation, is replaced with a synthetic frequency signal that can be manipulated according to the test requirements, and the power response can be studied simultaneously. The steady-state response of FCR-N is tested with a step sequence prescribed by SvK. The steady-state response of FCR-D is tested with a ramp sequence.
Stability is evaluated for both FCR-N and -D using sine tests – a test where the frequency is varying with, in this case, ±100 MHz with a period of between 10 and 300 seconds. Basically, the frequency of the frequency. The results are then used to define the parameters for a transfer function.
If the sine signal is generated internally in the governor, the transfer function shall be multiplied by the transfer function of the frequency measurement transducer. The testing of this transducer is described in Part I. Alternatively, a “synthetic” frequency signal can be injected into the frequency measurement transducer of the turbine governor to identify the transfer function of the complete governor system, including the frequency measurement part.
For the analysis, the transfer function for the generating unit will be multiplied by the power system transfer function provided by SvK. The Nyquist curve of the system can then be examined by plotting the open loop system in the complex plane. Details on this and the requirements are in the grid code.
The idea behind the stability requirement is basically, that if your tested unit and its characteristics are representatives of every unit in the grid, the grid will be stable. Each unit must contribute to the overall stability - at least on the average required level.
The “synthetic” frequency signal
The grid frequency signal - typically three-phase 110 VAC - is replaced with a “synthetic” frequency signal. The test protocol allows the frequency signal to be created digitally internally in the turbine governor for testing purposes. However, in such cases, the performance of the associated frequency measurement device must be validated. Otherwise, the TSO provides values for dead time and phase lag that must be applied in evaluating the measurement results.
These standard values correspond to a very low-performing frequency measurement transmitter. Using those values will lead to an underestimation of the FCR capacity of the unit. To maximize the validated performance of the governing system there are good reasons to inject a synthetic frequency signal before the frequency measurement device or to validate the device’s actual performance. The latter validation is described in Part I, while this article describes the former method.
The basis of the measurement system is a Dewesoft Sirius with 8 STGM+ analog in (AI) and 8 channels analog out (AO). A voltage amplifier was developed to amplify the ±10 VDC signal from the AO to a suitable level for the frequency measurement device (typically 110 V). DSI-V-200 is used to measure the actual output from the voltage amplifier, see Figure 2.
The function generator module of DewesoftX is applied to generate three sinus signals with 120° phase shifts simulating the grid voltage. DewesoftX is used to control the AOs and evaluate the recorded data. Validation of this setup is described in the previous article about frequency measurement transmitter testing. The frequency measurement transducer feeds the turbine governor control loop controlling the unit power.
Some results
The results from the sinus-sweep test are shown here. The frequency during the test is swept periodically in the range of 50±0.2 Hz. The DewesoftX is used to define the signal actually comprising three periodic signals with 120° phase shift between - emulating a three-phase system as the frequency measurement transmitter uses all three phases to improve speed and accuracy. The frequency is derived from the voltage signal using DewesoftX’s “Direct Frequency”-function. The frequency deviation from 50 Hz is then calculated for one of the phases and shown in Figure 2 with dark pink colour.
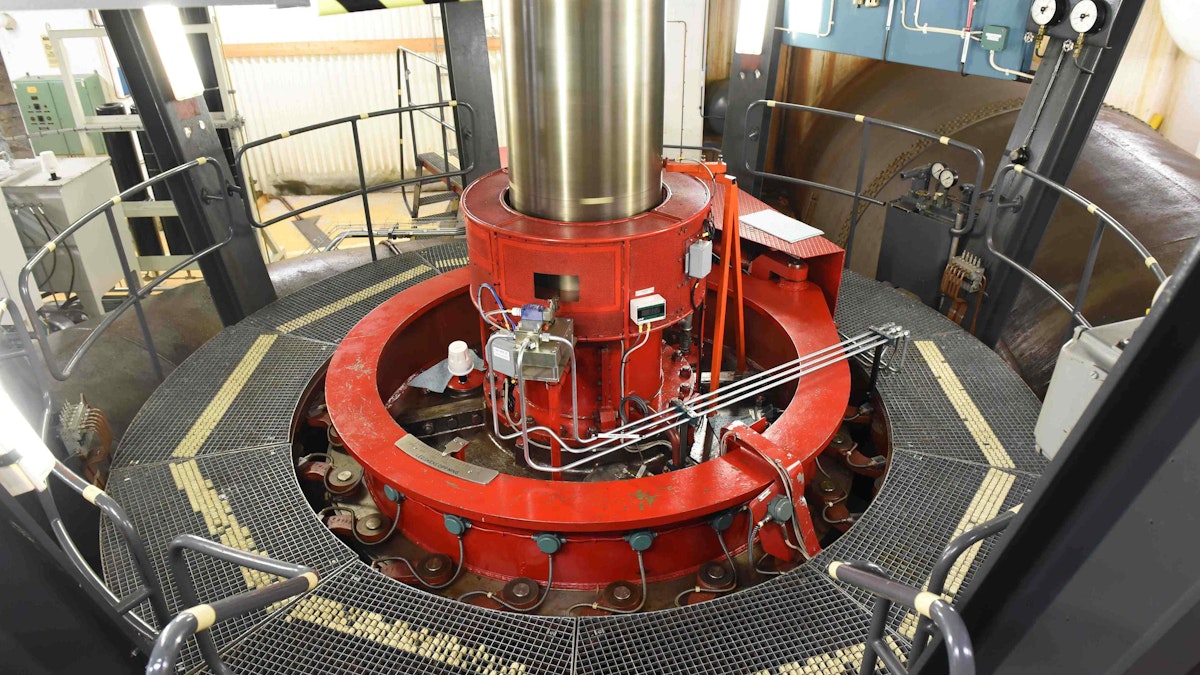
So, what else is in the figure? The dark blue curve is the servomotor position. The servo motor controls the guide vane angle - which determines the turbine’s power output - via a mechanical system comprised of one guide vane operating ring connected via links to one lever on each guide vane - see also Figure 3. As the frequency deviation increases (the pink curve increases), the turbine governor reduces the power output lowering the guide vane angle by decreasing the servo motor position.
In a theoretically perfect world, the dark blue curve would be the perfect Sinus-curve just like the frequency deviation curve. However, in this case, a turbine governor and an oil-hydraulic regulating valve come between perfection and reality. The regulating valve of this unit does not have linear characteristics through zero (see Figure 3), which contributes to some hysteresis seen as the flat part of the curve at the turning point. The control signal to the valve reduces gradually as the change of frequency deviation decreases. Finally, when the derivative of the frequency deviation shifts sign (changes direction), the valve spool has to pass its center position that is more or less “dead”.
The grey curve shows the position of the lever. There are disturbances of the signal that can be overlooked. However, it is important to notice: There is still some slack between the change of direction of the servomotor stroke and that of the lever. This slack is caused by the mechanical dead band due to (necessary) clearances in the sliding bearings of all the mechanical connections and the guide vane operating ring radial bearing.
The light blue curve is the power output. The power is a consequence of the guide vane angle and hence the general power behaviour follows the guide vane lever (and servomotor). However, the peak and valleys of the curve differ somewhat due to other dynamic phenomena of the runner and water passage. An unfiltered curve is seen in Figure 6. The latter indicates one of the challenges with evaluating these tests – to enable finding the gain and phase lag, the measured data needs to fit a sinus function. The TSO (SvK) does provide a tool for this. The gain and phase lag is calculated consistently from a measurement consisting of at least five periods
From the results of Sinus-sweeps with different period times (10-300 seconds, 50 ± 0.1 Hz), combined with step tests, the transfer function for the complete turbine system, including the governor, water passage dynamics, etc., can be identified. The reason to do the sinus sweep, instead of relying only on step tests, is, first of all, the influence of any dead band. The dead band can be caused by the regulating valve, the mechanical system, or the digital governor system included. This is not the case when only step tests are done. The presence of a dead band on the stability can be significant.
Conclusion
These tests were performed during the development of the TSO’s requirements for the FCR ancillary services. The results were used in discussion with the TSO to adjust and improve these requirements.
One observation known before the testing is the significant influence of the dead band. Here, the flexibility of the Dewesoft measurement system comes in very handy. The system can easily be re-configured to troubleshoot and search for what causes dead-band in the system, be it mechanical, hydraulic, or in the electrical governing system. Even comparably minor improvements can lead to better FCR performance allowing for increased revenue streams from ancillary services for the plant owner.
The Dewesoft Sirius again proves to be a very flexible and versatile system to be used even for testing and validating a complete turbine/generator set in the field.
