


Frequency Stabilization - Primary Control of Hydro Turbines - Part I

Electricity is special in that aspect that it must be produced at the same instant as it is consumed. Unbalance in supply and demand will manifest itself as a deviation in frequency. To maximize the performance of the governing system and ensure stable grid frequency the power supplier Uniper asked the consulting company N63 AB to help develop test methods based on Dewesoft Sirius.
Uniper ranks among large power generation and trading companies in Europe, which is one of the world’s most important energy markets. Uniper operates a range of assets in Sweden, including low-carbon hydro and stakes in nuclear power stations. It also operates several gas-fired and oil-fired generating units used primarily as reserve capacity to ensure grid stability.
Together with nuclear power, hydroelectricity meets Sweden’s baseload needs. From Sundsvall, Uniper manages 76 run-of-river plants, located from Lycksele in the North to Kristianstad in the South. The plants have a combined capacity of about 1,600 MW and an average annual output of 8 TWh - about 12% of Sweden’s total hydropower production. Uniper’s low-carbon hydro plants provide both stability and flexibility to the country’s energy system.


N63 is a consulting company providing engineering-related services, from strategic to operative level. It is located in the village of Ytterån in the region of Jämtland in northern Sweden, a sparsely populated highland region with large forests, mountains, and Sweden’s fifth-largest lake. The region has two larger rivers, Ljungan and Indalsälven - both emanating in the Scandinavian Mountain range and flowing east to the Baltic Sea.
Frequency stabilization
One of the necessary functions in a large synchronous power system is frequency stabilization - the others being voltage stabilization and rotor angle stability. Frequency stabilization is realized at different levels and time scales, starting with primary control which is implemented in each unit’s turbine controller. It then continues with secondary and tertiary control which can be more or less automated, and are controlled centrally by a digital controller or manually via the dispatch centre.
Due to the energy transition, with accelerating amounts of renewable energy sources being commissioned and a reduction of thermal and nuclear power units, the remaining frequency primary control resources are put under pressure from several directions. The reduction of nuclear power, and also thermal, leads to less inertia in the system - the inertia is the energy that is stored in rotating machines connected synchronously to the grid.
Renewable energy sources do in general have little or no possibility to provide primary regulation services. In addition, electricity production is more difficult to forecast. On top of this comes a surge in electricity demand, the general electrification to replace fossil energy sources.
To compensate for this, the frequency primary control must become faster, both in terms of dead time and response, and more accurate. The Transmission System Operators (TSO) are meeting this with increased requirements for the primary control services.
FCR and FFR
Most synchronous areas have similar functionality in terms of primary control. In the Nordic synchronous area - Sweden, Norway, Finland, Estonia, Latvia, Lithuania, and parts of Denmark - the primary control products are FCR (Frequency Containment Reserve) and FFR (Fast Frequency Response).
FFR is a very fast product that primarily can be realized with batteries – it can to some extent be seen as a replacement of inertia. FCR is the conventional primary regulation product, divided into N, normal regulation which is in the 50±0.1 Hz band, and D, disturbed regulation which is below 49.9 Hz and down to 49.5 Hz. As the term “product” implies, these are services that are traded on a market, and as the demand is increasing, the revenue potential is high.
Figure 3 illustrates how FCR-N and -D are complementing each other. Allocated to the products is also a certain volume of production. Today approximately 600 MW of reserves are available for FCR-N in the Nordic synchronous area. For FCR-D, this number is about 1400 MW. FCR-N is dimensioned to handle variations during normal operation whereas FCR-D is dimensioned for the largest single fault in the system, such as the loss of an HVDC transmission or a nuclear power unit. FCR-D shall be fully engaged at 49.5 Hz.

 and sections FCR-N and -D.ecuencia medida (azul) y tramos FCR-N y -D.")
On this background, it should be rather straightforward to realize the consequence of operating in normal operation outside the FCR-N-span.
In Figure 2, the frequency drops below 49.9 seconds for about 10 seconds. During this time, FCR-D is activated. The maximum deviation outside the FCR-D-span is about 0.05 Hz. FCR-D is activated below 49.9 Hz and it should be fully activated at 49.5 Hz. This means that 0.05 Hz / (49.9 – 49.5) = 12.5 % of the FCR-D-reserves are used to handle an event that should have fallen under normal regulation (FCR-N).
This may seem unimportant, but it is not. In our case, this corresponds to 175 MW which would be missing if a nuclear generating unit would trip during the period when the frequency is below 49.9 Hz. The consequence of diving below 49.5 Hz is that the risk of automatic load shedding to protect the grid stability increases which would lead to local blackouts.
Technical challenges
Hence, the accumulated time spent outside the FCR-N span is an important quality measure of the frequency regulation capabilities of the system. Figure 4 shows the development of this quality measure over time – there has been a continuous increase of time spent outside the normal regulation band. This can be attributed to the increase of production from renewable energy sources, the reduction of the number of nuclear power plants, and fewer synchronous motors in the industry.

.")
This development has triggered an advance of both the requirements related to regulation services from generating units and of methods to validate that these requirements are fulfilled. This naturally imposes increased technical challenges. Some - or probably even many - of the existing units, which have provided FCR in the past, may not handle the new requirements, or they might deliver less of the specific product. The existing equipment, both mechanical, hydraulic, and electrical governor may not have sufficient performance or may at least benefit from improvements and optimization.
The frequency measurement device
One critical element in the control chain is the frequency measurement device. Primary frequency control is by its nature local, handled by each local turbine governor. The input for the control action is the frequency of the grid, which is then compared to a setpoint value.
The difference - the error - is then fed to the control algorithm which calculates the control signal which in its turn controls a hydraulic servo system with a regulating valve and servo motor(s). As no chain is stronger than the weakest link, the frequency measurement transmitter must then be both fast (very fast) and accurate.
Testing of the FCR capacity of a generating unit is done by replacing the grid frequency signal - typically three-phase 110 VAC - with a “synthetic” frequency signal. The test protocol allows the frequency signal is created digitally internally in the turbine governor (for testing purposes). However, in such cases, the performance of the associated frequency measurement device must be validated, otherwise, the TSO provides values for dead time and phase lag that shall be used for the evaluation of the measurement results.
These standard values correspond to a very low-performing frequency measurement transmitter and using those values will lead to an underestimation of the FCR-capacity of the unit. So, to maximize the validated performance of the governing system there are good reasons to either inject a synthetic frequency signal before the frequency measurement device or validate the performance of the actual device to be able.
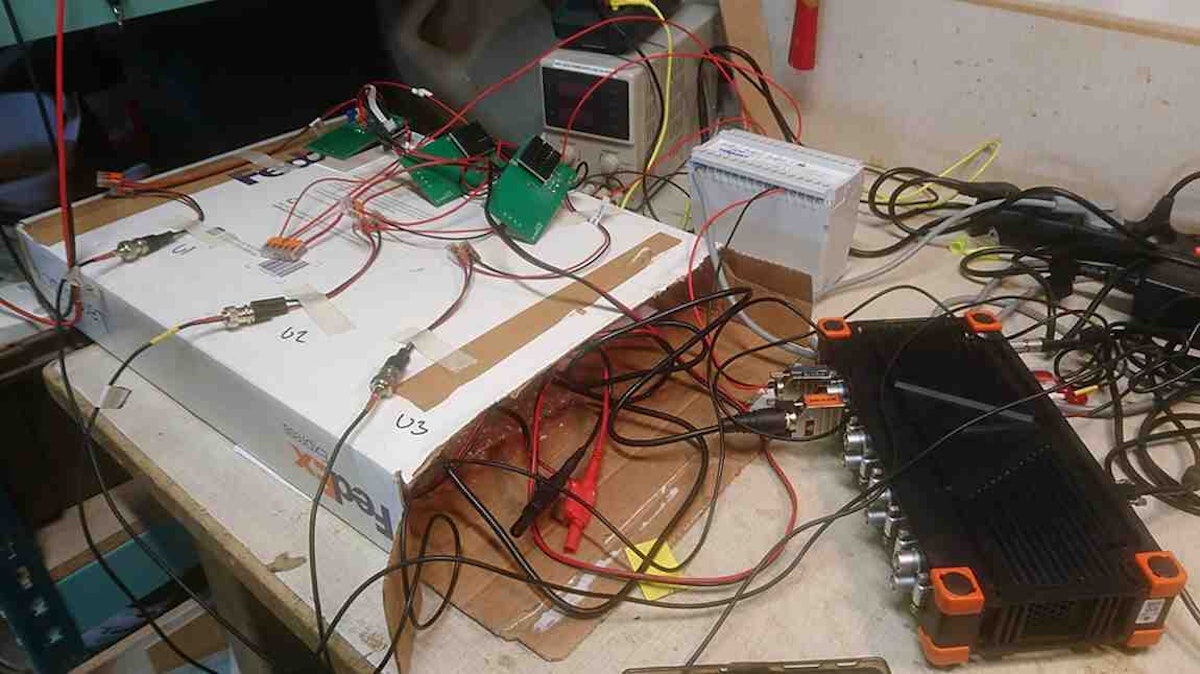
N63 has developed and validated test methods and hardware for both latter cases. The measurement system is based on a Dewesoft Sirius data acquisition system with 8 STGM+ analog in (AI) and 8 analogs out (AO) channels.


A voltage amplifier has been developed to amplify the ±10 VDC signal from the AO to a suitable level for the frequency measurement device. DSI-V-200 are used to measure the actual output from the voltage amplifier, see Figure 6. The function generator module of DewesoftX is used to generate three sinus signals with 120° phase shifts simulating the grid voltage. DewesoftX is used to control the AOs and evaluate the recorded data.


Set-up performance validation
Step one was to validate the performance of the set-up. First, the inter-channel phase shift accuracy was evaluated by using “correlation math” in DewesoftX. The phase shift of the three channels deviates less than 0.01° from the setpoint value. This is of course within Dewesoft specifications but also of the same accuracy level as the benchmark, a dedicated relay test system.

, and the frequency transducer measured frequency (green) at the upper left during a step-test.")
The next validation test did give a rather unexpected result. The objective was to test the frequency measurement transmitter’s response time (how fast it can react to a step-change in frequency). The first transmitter that was tested was a beta-version optimized for the shortest possible response time (sacrificing some accuracy).
The result of the test is shown in Figure 8. The orange line is the setpoint value to the function generator in DewesoftX. In the graph, a typical step-test is shown where the frequency is changed from 50 Hz to 49.9 Hz in a stepwise manner.
The blue line is the measured frequency (measurement point after the voltage amplifier), evaluated with an in-house developed Python script. The frequency evaluation method is rather simple, based on zero crossing of the signal, and by using data from all three phases a response time of less than 6.7 ms can be achieved.
The method is optimized for fast detection of a frequency change. The repetitive pattern of frequency variation is caused by the small phase shift deviation between the channels. With a slower method, these can easily be cancelled but accuracy was not the main target of the method. For accurate frequency determination, the built-in “Exact Frequency” of DewesoftX is more than satisfactory.

 vs frequency of the output channels (blue).")
The interesting result is that the frequency evaluation method seems to have “psychic” abilities. It seems to be able to detect a frequency change on the Aos of the Dewesoft Sirius about 20 milliseconds before even the setpoint value to the function generators controlling the Aos is changed.
Even though Dewesoft measurement equipment is known for its abilities, they cannot see into the future – this must be a matter of the internal signal processing of the Sirius device. This rather unexpected finding led to using the Python script to evaluate response time based on the data exported from DewesoftX instead of relying on the change in setpoint value as reported by DewesoftX.
Transducer testing
Over to the tests. Two frequency transducers from the same supplier were tested. They were equipped with different firmware whereof one was optimized for fast detection of frequency changes.
Both used the voltage of all three phases for the frequency measurement. Five-step changes in each direction between 50.000 and 49.000 Hz were made. The time constant - the time from the initiation of the step-change until the measured frequency has reached 63% of the setpoint delta - was evaluated, see one example in Figure 9. The faster of transducers had a time constant of 45±4 milliseconds and the standard version had a time constant of 86±3 milliseconds.

, measured frequency as evaluated by the Python script (blue), and frequency transmitter output signal (green).")
The speed of the first device does come at a cost. The accuracy of the standard version was 6 mHz with a signal-to-noise ratio (SNR) of 82 dB whereas the accuracy of the faster version was 10 mHz with an SNR of 75 dB. Higher speed results in lower accuracy and lowers SNR although in both cases the results are acceptable and according to the requirements of the TSO.
Noteworthy is that most of the accuracy errors were of systematic character, with a constant shift towards “measured lower than actual”. One possible explanation was that the frequency transducers required quite a long time to reach the thermal steady state, and until the thermal steady state was reached the signal slowly drifted corresponding to about 5 mHz between cold and warm. Improvement potential for the equipment supplier!
Conclusion
The transducer tests revealed a larger measurement error than what was specified in the calibration protocols from the supplier indicating that it might be so that the supplier calibration of the devices was done before the thermal steady-state was reached.
The measurement also validated the accuracy and response time of both frequency transmitters hence providing Uniper with sufficient data for the validation of FCR performance.
One conclusion is that there are good reasons to make extended tests of critical components in-house! Even when working within quality standard systems such as ISO 9001. Measurements and in-house validation lead to an increased understanding of the functionality of any electronic device and such testing may reveal flaws that have gone unnoticed even by the component supplier!
Based on the test results, Uniper could make an educated selection of proper frequency transducers based on each specific generating unit’s requirements. By having a detailed characterization of the different transducers, it is also possible for Uniper to simplify the test protocol of turbine governors. With the data now available it is acceptable to inject the simulated grid frequency in the software of the turbine governor and adjust the result by using the tested characteristics of the frequency transducer. This simplifies the testing significantly.
The tests also gave rise to two improvement suggestions. One to the frequency transducer manufacturer regarding the thermal drift of the frequency signal and the second to Dewesoft, regarding the usefulness of a “fast frequency”-function to complement the “exact frequency”-function in DewesoftX.
Another conclusion is that the Dewesoft Sirius again proves to be a very flexible and versatile system that can be used also for turbine governor testing and validation of components in the governor system. A second article will follow with some notes from the testing of a complete water turbine governor system.