


Operational Modal Analysis (OMA) and Long-Term Structural Monitoring of a Jetty Structure

Modal analysis is vital to understand and optimize the inherent dynamic behavior of structures. The influence of sea waves on a jetty structure is now continuously monitored at the Italian harbor of Vado Ligure.
The system enables to control its structural conditions over time, detecting its dynamic response employing a series of integrated signal conditioners with built-in MEMS accelerometers – IOLITE 3xMEMS-ACC Dewesoft IOLITEd DAQ devices - all arranged on the structure and connected to constitute the measurement chain.
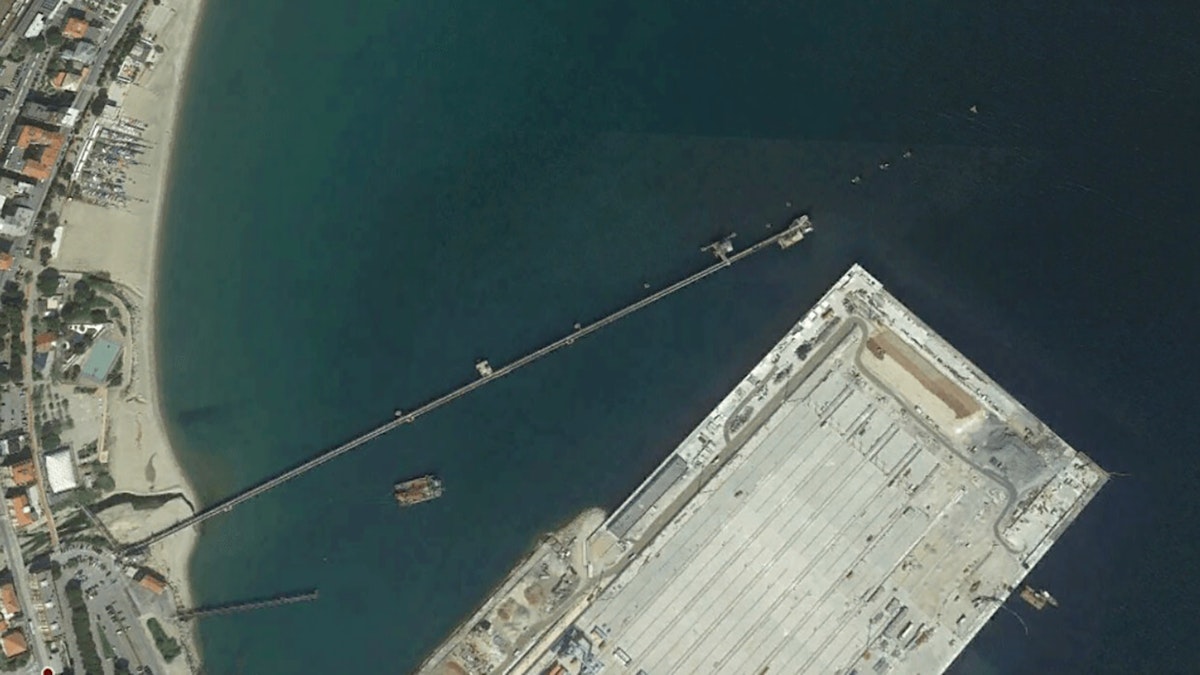
The Italian port of Savona Vado or Vado Ligure in the North-Western Italian region of Liguria is located west of Genoa in the Northernmost part of the Mediterranean Sea. This large industrial and commercial port has piers for the loading and unloading of coal and oil, and a terminal that provides ferry services connecting Savonna Vado with the islands Corsica and Sardinia.
Here, the structural health monitoring systems are installed on an 800 meters long jetty in Vado Ligure to verify the behavior of the structure when subjected to the influence of significant sea waves.
The jetty is owned by Esso Italiana S.r.l. and allows tank ship loading and unloading. It connects via a pipeline to a berth from which base oils for blending purposes are pumped to a lubricant plant for manufacturing processes, packaging, storage, and distribution.
Modal analysis and OMA
Modal analysis is vital to understand and optimize the inherent dynamic behavior of structures. In structures, almost all vibration problems are related to structural weaknesses associated with resonance behavior, natural frequencies being excited by operational forces.
For many civil engineering and mechanical structures, it is difficult to apply excitation using either hammer or shaker due to their physical size, shape, or location. Also, civil engineering structures are loaded by ambient forces, such as waves, wind, or traffic. These natural input forces cannot easily be controlled or correctly measured. However, in some cases, it is preferable to use this natural excitation of the structure under true operating and boundary conditions to determine its modal properties.
Operational Modal Analysis (OMA) is based upon measuring only the responses of test structures for accurate modal identification under actual operating conditions – with no artificial excitation – and is often used in situations where it is difficult or impossible to control an artificial excitation of the structure.


The methodology is known as OMA - Operational Modal Analysis, whose approach is also called "Output Only" as it is the only response of the structure to be analyzed without having forced nature or known trends generated on it. These data, treated with appropriate modal extraction algorithms, allow the proper modal parameter identification.
The complete dynamic behavior of a structure can be viewed as a set of individual modes of vibration, each having a characteristic natural frequency, damping, and mode shape. By using these dynamic properties of systems in the frequency domain, the modal parameters, to model the structure, problems at specific resonances can be analyzed and subsequently solved.
A modal identification determines the modal parameter’s characteristics of a structure. These parameters are the specific frequencies of the structure with the related damping and modal forms. Knowing the modal parameters enables the prediction of the response of the structure as a function of external excitation.
The structure's vibration modes in fact provide information about the relative motion of the elements which make up the structure when it is stressed at that particular frequency. If the structure is subjected to an action that excites more than one frequency, the way the structure vibrates would result from the combination of exciting vibrating modes.
These parameters thus constitute a sort of dynamic "identity card" of the structure that can be used for the validation of calculation models, for their calibration, or diagnostic purposes – providing a base-line in long-term structural monitoring.
Measurements
The detection of dynamic parameters makes it possible to verify the persistence of the structural conditions with reference to a precise instant of time T0. Generally, this time T0 for new structures can be taken at the time of testing, whereas for existing structures it can be taken as the time instant in which an assessment of the structural safety conditions is carried out and in which the first measurements are made.
In this particular case, the data were recorded by the system on two separate days straddling the completion of repair work on one of the poles on December 28, 2018. This made it possible to evaluate the effects of the rehabilitation interventions and to have an up-to-date picture of the dynamic properties of the structure after the repair intervention. This picture was then used as a reference for the control of its state of preservation over time.
The dynamic magnitude chosen for the measurements is the response of the structure in terms of acceleration in some points arranged on the surface of the platform at the head of the pier. In particular, the points at the four vertices of the plan shape of the jetty platform, which were named with the letters A – D, were instrumented.
Each measurement point was instrumented with an IOLITE 3xMEMS-ACC, a three-axis accelerometer with axes XY oriented according to the directions of the horizontal plane and the vertical Z-axis. In particular, with reference to the plan layout of the platform, the X-axis is orthogonal to the development axis of the jetty and the Y-axis is parallel to the latter.


For the dynamic characterization of the structure, the accelerometric measurements acquired in two separate days were done on December 6, 2018, and January 4, 2019, before and after the rehabilitation of the B1 pole of the platform. For each day, the signal was acquired from the sensors for a 60-minute period and the modal characteristics of the structure were determined based on the accelerometric response within this interval.
The measurements were carried out with a sampling frequency equal to 100 samples/s. The appropriate anti-aliasing analog filter was used and a consequent bandwidth up to about 40 Hz. This allowed having a more than adequate frequency band concerning the expected frequencies for the investigated structure.


A simple geometric model, a single-line diagram, relative to the measurement points corresponding to nodes arranged in the space, and linked together by lines – makes the perception of the shape more immediate.
To improve the visualization of the modal forms additional points are added to the simplified single-wire diagram (wireframe) with the measured physical points A – D, simulating the base sections of the supporting poles.


The summary of the results of the measurements performed on 6 December 2018 and 4 January 2019, enables a quick comparison of the analysis attained in terms of frequency, damping, and prevalent direction of the associated modal form.
| Form | f [Hz] 6/12/2018 | f [Hz] 4/01/2019 | z [%] 6/12/2018 | z [%] 4/01/2019 |
|---|---|---|---|---|
| Translational X | 1,171 | 1,224 | 1,15 | 1,10 |
| Torsional | 1,303 | 1,385 | 1,22 | 2,27 |
| Roto translational Y | 1,453 | 1,514 | 1,69 | 1,85 |
| Translational Y | 1,717 | 1,845 | 2,24 | 1,78 |
The frequencies determined starting from the measurement of the accelerometric response on 4 January, following the repair operation performed on the B1 pole, are higher than those determined on 6 December, with an increase of between 4 and 7%. The modal forms do not appear to change between the two elaborations. Therefore, the modal parameters of this study of the structure show an increase in rigidity following the restoration of the poles.


Conclusion
This method provides for the calculation at regular intervals of the specific frequencies of the structure and therefore the continuous structural monitoring and comparison with the data obtained at the initial time taken as reference.
Due to its very low costs and short realization times, the methodology of Operational Modal Analysis (OMA) is increasingly used in the civil engineering sector to characterize the dynamics of a structure.
Learn more:


