


Validating the Dynamic Performance of a Single-Span Steel-Concrete Pedestrian Bridge

A collaboration between the Cracow University of Technology and Dewesoft Poland investigated the structural behavior of a single-span steel-concrete composite bridge under pedestrian loads. The research included dynamic monitoring and refining a mathematical model to enhance simulations. Critical phases of the study involved creating a finite element (FE) model, conducting operational modal analysis (OMA), and verifying FE predictions against field test data. Testing included a user-induced sweep and pedestrian loading to measure the bridge’s natural frequencies, mode shapes, and damping ratios under dynamic loads.
One of Cracow's most crucial recent engineering projects is the Łagiewnicka Route, aiming to efficiently support traffic distribution, being an element of the city’s southern bypass. The project is a set of road infrastructure with a total length of 3.5 km, of which 2.1 km is in tunnels. The space above the tunnels is available for local traffic. The investment, a total cost of approximately PLN 178 million, was created with the support of EU Funds from the Infrastructure and Environment Operational Program (POIiŚ).
The stretch will create:
5.3 km of new pedestrian routes
3.2 km of new bicycle paths
3.1 km of combined pedestrian and bicycle paths.
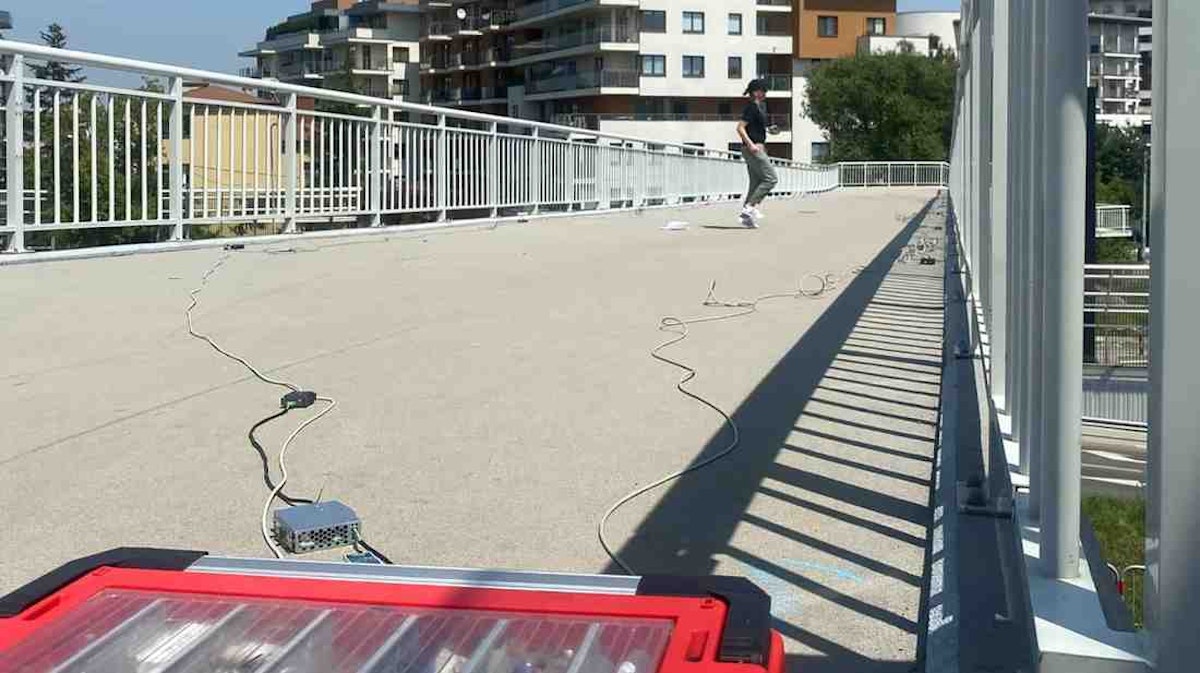
A single-span steel-concrete composite pedestrian bridge is an essential part of this infrastructure system - see Figure 1. It spans the main transportation route and facilitates pedestrian crossing.
Measurement campaign
In June 2024, the structural and material mechanics chair at Cracow University of Technology (CUT) and Dewesoft Poland began cooperating. Together with Izabela Drygala, a bridge engineer with a Ph.D. in structural dynamics, we developed a research program for the footbridge.
The investigation focuses on two main issues:
Dynamic monitoring of the structure and
Development of an MSD (Mass, Spring, and Damper) mathematical model to improve numerical simulations.
Engineer Izabela Drygala says:
This data is critical for understanding the structure's dynamic characteristics, such as natural frequencies, damping ratios, and mode shapes. Additionally, it provides the data for calibrating and validating the SMD mathematical model, ensuring that numerical simulations closely reflect the actual behavior of the structure.
The MSD mathematical model
The MSD mathematical model is a framework for describing and analyzing mechanical oscillations in systems with mass (M), spring (S), and damper (D) elements.
This model is fundamental in vibration analysis and mechanical engineering because it represents the behavior of oscillatory systems. Engineers widely utilize it in applications such as automotive suspension analysis, vibration control in mechanical systems, and seismic analysis for building structures.
The model provides insights into how systems respond to various forces, enabling engineers to design systems that manage oscillations, mitigate vibrations, and enhance stability.
Components of the MSD model
Mass (M): Represents the inertia of the object. It resists acceleration and deceleration.
Spring (S): Provides a restoring force proportional to displacement, governed by Hooke's Law. The spring constant, k, determines the stiffness.
Damper (D): Represents a damping element that provides a resistive force proportional to velocity. Engineers typically describe this damping by a coefficient c, which expresses how quickly the system's motion diminishes over time.


The single-span footbridge
The single-span structure, spanning 48 meters between supports, is a steel truss integrated with a 14-20 cm thick deck slab. The steel components are S355 grade steel, while the reinforced elements of C30/37 concrete are composite with the steel structure. See the structural details in Figures 3 and 4.


The builders finished the structure in the autumn of 2021, successfully completing static and dynamic load testing. In the summer of 2024, we undertook an experimental campaign to assess the structure after three years of service. We developed the field test program in close collaboration with Trasa Łagiewnicka SA, the structure's general administrator.
The set of field tests focused on evaluating the dynamic performance of the footbridge under human-induced dynamic loading. We conducted these tests at the environmental temperature of 36°C, representing one of the hottest conditions recorded in Cracow, Poland.
The critical stages of our research program were as follows:
Initial FE modeling
Operational Modal Analysis (OMA)
FE modeling verification
Structural Serviceability under user-generated dynamic loadings
Initial FE modeling
We assembled the Finite Element model of the footbridge with the ABAQUS/Standard software program. See a general view of the model in Figure 6.


![Mode no.1; 2.06 [Hz]](https://www.datocms-assets.com/53444/1739180292-mode-no-1-2-06.png "Mode no.1; 2.06 [Hz]") |
![Mode no.2; 3.76 [Hz]](https://www.datocms-assets.com/53444/1739180319-mode-no-2-3-76.png "Mode no.2; 3.76 [Hz]") |
![Mode no.3; 5.56 [Hz]](https://www.datocms-assets.com/53444/1739180344-mode-no-3-5-56.png "Mode no.3; 5.56 [Hz]") |
| Mode no.1; 2.06 [Hz] | Mode no.2; 3.76 [Hz] | Mode no.3; 5.56 [Hz] |
![Mode no.4; 6.52 [Hz]](https://www.datocms-assets.com/53444/1739180369-mode-no-4-6-52.png "Mode no.4; 6.52 [Hz]") |
![Mode no.5; 11.85 [Hz]](https://www.datocms-assets.com/53444/1739180399-mode-no-5-11-85.png "Mode no.5; 11.85 [Hz]") |
![Mode no.6; 12.23 [Hz]](https://www.datocms-assets.com/53444/1739180414-mode-no-6-12-23.png "Mode no.6; 12.23 [Hz]") |
| Mode no.4; 6.52 [Hz] | Mode no.5; 11.85 [Hz] | Mode no.6; 12.23 [Hz] |
![Mode no.7; 15.72 [Hz]](https://www.datocms-assets.com/53444/1739180437-mode-no-7-15-72.png "Mode no.7; 15.72 [Hz]") |
![Mode no.8; 19.71 [Hz]](https://www.datocms-assets.com/53444/1739180476-mode-no-8-19-71.png "Mode no.8; 19.71 [Hz]") |
![Mode no.9; 20.62 [Hz]](https://www.datocms-assets.com/53444/1739180496-mode-no-9-20-62.png "Mode no.9; 20.62 [Hz]") |
| Mode no.7; 15.72 [Hz] | Mode no.8; 19.71 [Hz] | Mode no.9; 20.62 [Hz |
Operational modal analysis (OMA)
The modal parameters of the pedestrian bridge were assessed experimentally through measurements and analysis of vibrations induced by ambient loadings. To this end, we collected data from various control points (see Figure 7 left).
We collected data for all control points in three coordinates, sampling the signals at 500 [Hz]. For the final signal processing, we used 1800 [s] segments. Figure 7 shows an example of the acceleration and frequency history in the time domain.
Monitoring setup
The field measurements were carried out to study the bridge's dynamic properties and dynamic response due to different human-induced dynamic loadings. We placed the sensors along the bridge deck following an FE model to have a calibrated idea of the system’s expected dynamic properties. To address the system’s longitudinal, lateral, and vertical behavior, we uniformly distributed seven triaxial accelerometers on both sides of the bridge deck. The total number of control points on the structure equals 14 - see Figure 7 right.
Monitoring instrumentation
During the monitoring campaign, we used the Dewesoft IOLITEiw-3xMEMS-ACC 3-axial, low-noise (25 μg√Hz spectral noise density) accelerometer with an integrated DAQ and EtherCAT interface. The device is fully waterproof and protected by IP67. It can measure structural accelerations in X, Y, and Z, as well as static inclinations and displacements - see Figure 7 right.
Hardware and software used
FlexPro
Simcenter Testlab
We used DewesoftX software for signal processing, data recording, analysis, and visualization in the monitoring. The recorded data were also easily exported to FlexPro and Simcenter Testlab, Lab, and Dewesoft Artemis OMA, which directly supports reading DewesoftX data files.
 the configuration of measurement points from 1 to 14 on the deck, and to the right,")


 direction.")
We calculated the footbridge’s modal frequency and damping values using the least square complex exponential (LSCE) and stochastic subspace identification (SSI) methods. These methods helped estimate the natural frequencies of the experimental modal model.
We also conducted a sensitivity analysis of the different modal models based on this approach. The results from the summer 2024 experimental campaign were first compared with those from the dynamic proof loading test conducted in autumn 2021 - see Figure 9.


We obtained the experimental modal model using the Least Squares Complex Exponential (LSCE) method as a reference. Figure 10 presents the leading indicators used for modal model compilation and validation.


We developed the second experimental modal model using the seismic soil-structure interaction (SSI) method, in which we studied the structure using the response spectrum method (RSM). An SSI model considers the coupling of the structural foundation's horizontal and rocking motions.
We used Dewesoft Artemis OMA, a software suite for analyzing structural dynamics at this stage. It is designed for civil engineering structures, operating machinery, and other structures that are difficult to excite in a controlled manner.
Modal parameters, such as mode shapes, natural frequencies, and damping ratios, can be determined for the operating structures, acquiring only the output response data. Figure 10 presents the stabilization diagram for this approach. Table 2 and Figure 11 provide the natural frequencies and damping values.


| Mode | LSCE | SSI | Difference [%] | |||
|
f [Hz] |
δ [%] |
f [Hz] |
δ [%] |
f |
δ |
|
|
1V |
2.03 |
1.20 |
2.10 |
1.74 |
3.30 |
45.17 |
|
2H |
3.62 |
1.81 |
3.68 |
2.04 |
1.77 |
12.76 |
|
3V |
5.76 |
0.59 |
5.81 |
0.48 |
0.85 |
18.81 |
|
4T |
6.03 |
0.35 |
5.86 |
0.54 |
2.80 |
53.71 |
|
5V |
11.75 |
0.36 |
12.04 |
0.59 |
2.49 |
63.61 |
|
6T |
13.06 |
0.58 |
13.72 |
0.41 |
5.08 |
28.97 |


FE modeling verification
Based on the experimental modal models, we evaluated the similarity between the FE analysis and in-field tests. The results of the sensitivity FE modeling analysis are in Table 3.
We used the experimental results obtained with the LSCE method to compare the structure's experimental and numerical modal models. By comparing the natural frequencies and mode shapes, we conducted the sensitivity analysis of the FE model. To compare the modes
from the FE analysis - see Figure 5 - with those from OMA, we applied the Modal Assurance Criterion (MAC) and the Normalized Modal Difference (NMD).
The Modal Assurance Criterion (MAC) and the Normalized Modal Difference (NMD) are tools for assessing the correlation and quality of mode shapes in structural dynamics.
Modal Assurance Criterion (MAC): MAC is a statistical indicator used to compare two mode shapes by evaluating their similarity. It ranges from 0 to 1, where 1 means a perfect correlation (identical mode shapes), and values close to 0 indicate little or no similarity. MAC is commonly used to validate the accuracy of experimental mode shapes against analytical or numerical models.
Normalized Modal Difference (NMD): NMD also compares mode shapes but quantifies the difference between two mode shapes as a percentage, offering insight into their dissimilarity. Unlike MAC, lower NMD values indicate higher similarity, with 0% meaning the mode shapes are identical.
MAC and NMD are essential for validating and refining modal analysis. They ensure accurate comparisons between measured and calculated mode shapes.
| Mode [-] |
Frequency |
Error [%] | |||
| LSCE | FE model | ||||
|
1V |
2.03 |
2.06 |
1.48 |
0.96 |
0.20 |
|
2H |
3.62 |
3.76 |
3.87 |
0.93 |
0.27 |
|
3V |
5.76 |
5.56 |
3.47 |
0.95 |
0.23 |
|
4T |
6.03 |
6.52 |
8.13 |
0.92 |
0.29 |
|
5V |
11.75 |
11.85 |
0.85 |
0.96 |
0.20 |
|
6T |
13.06 |
12.23 |
6.36 |
0.89 |
0.35 |
|
7V |
15.71 |
15.72 |
0.06 |
0.95 |
0.23 |
|
8T |
18.71 |
19.71 |
5.33 |
0.88 |
0.37 |
|
9V |
20.79 |
20.62 |
0.82 |
0.94 |
0.25 |
Structural serviceability under user-generated dynamic loadings
Resonant conditions are states used to evaluate the dynamic behavior of footbridges regarding comfort standards. Consequently, periodic loads generated by pedestrians, matching the frequency of the most critical mode, were analyzed.
Using the footbridge's experimental and numerical modal models, we adjusted crucial aspects of pedestrian movement, such as frequency, for further analysis. Additionally, with the outcomes from field tests, we aimed to assess the bridge's dynamic response to pedestrian traffic.
We experimentally examined three types of user motions on the footbridge:
A user-induced sweep (frequency range: 1.5-3.5 [Hz])
A passage of pedestrians
A passage of runners
Figure 13 shows the results of the user-induced sweep with a frequency range of 1.5-3.5 Hz in the time domain. The Short-Time Fourier Transform (STFT) analysis revealed that seven natural frequencies were excited during this experiment. It is important to note that we observed the first two vertical modes under resonant conditions.
STFT analysis is a technique used to analyze the frequency content of non-stationary signals over time. By dividing the signal into small overlapping time segments (windows), STFT calculates the Fourier Transform for each segment, allowing for the observation of how the frequency components change over time. A spectrogram often represents the output, where color intensity indicates the amplitude of frequency components at each time step.
![Figure 13. The user-induced sweep (1.5-3.5 [Hz]). Spectrum results in time and frequency domain for control point 13 in the vertical (Z) direction.](https://www.datocms-assets.com/53444/1739178823-user-induced-sweep.jpg?auto=format&fit=max&w=1024 "Figure 13. The user-induced sweep (1.5-3.5 [Hz]). Spectrum results in time and frequency domain for control point 13 in the vertical (Z) direction.")
Conclusion
We can conclude that the single-span steel-concrete composite footbridge, integral to Cracow’s Łagiewnicka Route, demonstrates stable and reliable performance under dynamic loading conditions. Through comprehensive field testing and finite element (FE) modeling, we thoroughly evaluated the bridge’s natural frequencies, mode shapes, and damping ratios.
The successful alignment between experimental data and FE model predictions confirms the design’s robustness and accuracy. We can conclude that the bridge can handle pedestrian-induced vibrations without compromising safety or comfort.
Engineer Izabela Drygala says:
The measurement campaign was essential to collect dynamic data about the footbridge's behavior under various loading and environmental conditions. Such an approach is crucial for assessing the footbridge's safety, performance, and durability over its lifespan.
These results highlight the effectiveness of the bridge’s composite steel-concrete construction and validate the monitoring setup and analytical techniques used. Our study’s findings ensure the bridge’s serviceability and resilience over time and offer valuable data to refine dynamic models and enhance future structural health monitoring. This research sets a precedent for using such methods to assess similar infrastructure, ultimately contributing to safer and more durable pedestrian bridges.