


Dewesoft ARTeMIS OMA (Operation Modal Analysis)

October 17, 2022
Introduction
Operational Modal Analysis (OMA) is often used as an advantage when analyzing the structural dynamics of civil engineering structures, operating machinery, and other structures being difficult to excite in a controlled manner.
Technique
OMA only uses measured output response signals - no input excitation signals. When performing OMA the measured structures are brought to motion by natural loads that cannot easily be controlled and measured, such as wave loads (offshore structures), wind loads (buildings), traffic loads (bridges), or operating machine loads.
Best in class
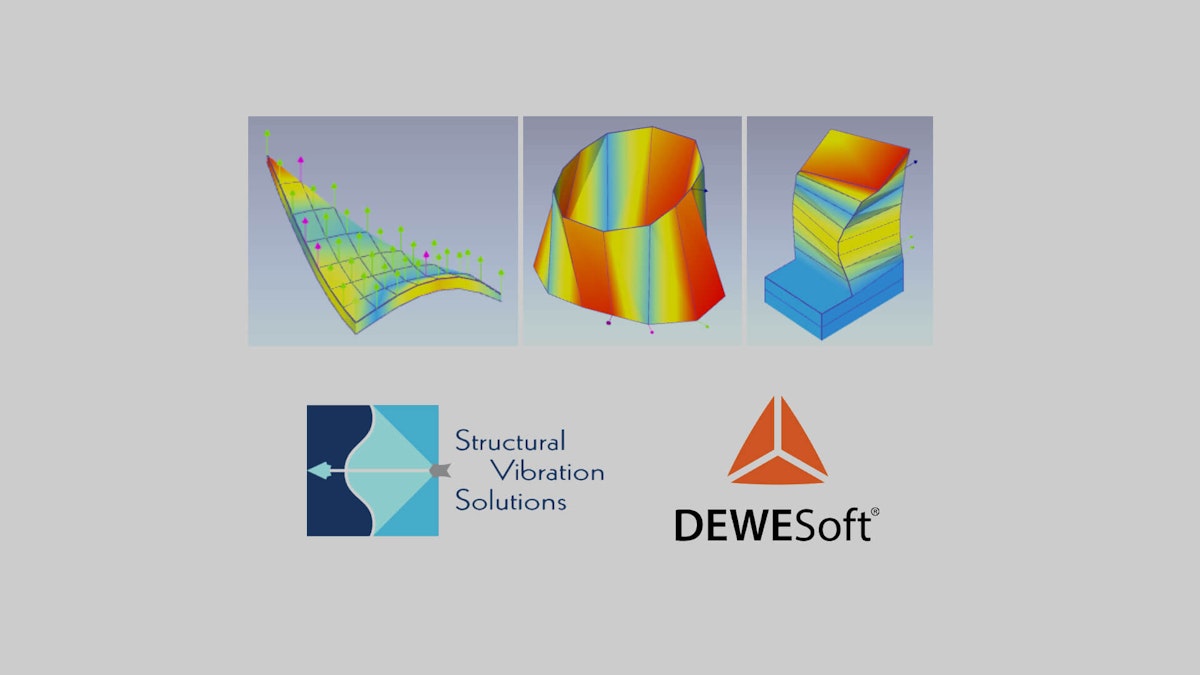
With Dewesoft ARTeMIS OMA and its extension options, you have one of the best and most advanced OMA products on the market.
Results
With the Dewesoft ARTeMIS OMA software, the full set of modal parameters can be estimated for such operating structures where only the output response data have been acquired. The modal parameters are the mode shapes, the natural frequencies, and the damping ratios.
License for life
Exceptionally with Dewesoft, you will get product licenses with no expiration date. No maintenance fee or other yearly fees, just a one-time purchase.
Multipurpose hardware
Dewesoft supports a broad range of advanced monitoring and analysis tools that can be used while acquiring the time data. In this way, you can perform multi-physics investigations to estimate the time for maintenance and easily detect critical events.
Easy workflow
You can open time data files acquired with Dewesoft (DXD files) directly into the Dewesoft ARTeMIS OMA application and run the analysis. In the same way geometries from Dewesoft can be imported via UNV files.
OMA vs. ODS
OMA is not just another name for ODS (Operating Deflection Shapes) since OMA enables estimations of modal models from the operational data, whereas ODS is limited to providing deflection shapes.
OMA names
OMA is also referred to as output-only modal analysis, ambient response analysis, ambient modal analysis, in-operation modal analysis, and natural input modal analysis.
Product options
The primary core license for Dewesoft ARTeMIS OMA contains the basic features required to succeed with OMA in most situations. If extended analysis and more results are desired then additional options can be added to the product. The validation of the results will be greatly enhanced by applying multiple estimators for comparison.
Base product:
DEWESOFT-ARTEMIS-OMA
Product extensions:
DEWESOFT-ARTEMIS-OMA-CFDD
DEWESOFT-ARTEMIS-OMA-SSI-UPC
DEWESOFT-ARTEMIS-OMA-SSI-UPC-UPCX
DEWESOFT-ARTEMIS-OMA-HDR
DEWESOFT-ARTEMIS-OMA
This is the core/base software pack, including the standard set of OMA functionalities. The software supports estimating natural frequencies, damping ratios, estimation and animation of mode shapes, estimation of normal mode shapes, Frequency Domain Decomposition (FDD) & Enhanced Frequency Domain Decomposition (EFDD).
DEWESOFT-ARTEMIS-OMA-CFDD
Adds a second estimator (CFFD - Curve-fit Frequency Domain Decomposition) that also provides damping ratios - allowing you to make a better validation of the damping of the structure being tested.
All FDD estimators (including FFD and EFDD that are part of the core SW suite) should only be used in case of lightly damped, well-separated, and well-excited modes. I.e. modes having distinct sharp peak peaks in the frequency domain.
In addition, FDD estimators rely on the estimation of a distinct mode shape. Therefore, they should only be applied when multiple channels are measured simultaneously on the structure.
DEWESOFT-ARTEMIS-OMA-SSI-UPC
Adds Crystal Clear Stochastic Subspace Identification (SSI-UPC) option to the standard OMA software.
The SSI estimators are general tools that can be used for all types of modes. Each global mode (natural frequency, damping ratio, mode shape) is computed as an average of the stable modes found through the stabilization diagram at different state space model orders.
The SSI estimators work automatically in most cases, but settings can be modified manually if needed. They work for lightly and heavily damped modes. For well-separated and for closely spaced modes. Even for repeated modes that are encountered when testing circular structures like disc brakes.
DEWESOFT-ARTEMIS-OMA-SSI-UPC-UPCX
Adds Crystal Clear Stochastic Subspace Identification with covariance (SSI-UPC + SSI-UPCX) option to the standard OMA software.
SSI-UPCX is probably one of the most advanced estimators you can get and as such the preferred workhorse as it also performs well in case of noisy measurement.
Due to applied uncertainty estimations, it is possible to compute the global modes based on weighted averaging of all the stable modes at different model orders.
Using a weighting with the inverse of the computed covariance suppresses the most uncertain modes and enhances the influence of the most certain modes.
In addition, the modal estimates can be reported with mean values as well as standard deviations. This is in general a very convincing way to inform about the quality of the test performed. I.e. one can report that a frequency was found at 20 Hz +/- 0.001 Hz instead of only stating that it was found at 20 Hz.
DEWESOFT-ARTEMIS-OMA-HDR
Adds Harmonic Detection and Reduction option to the Dewesoft ARTeMIS OMA base product.
The HDR option should be used together with the FDD estimators, especially when dealing with measurements taken on a structure having rotating components during the test.
This tool can do two things:
It can detect the frequencies of the rotating components, which allows the FDD methods to disregard the spectral information at the rotational frequencies.
It can also suppress the rotational components and in some cases even remove these completely from the measurements. This allows all our estimators to better focus on the estimation of the structural modes.


The SSI estimators are not so sensitive to the rotational components. However, in the case of very high-energy rotational components, it can also be beneficial to apply the reduction tool before using the SSI estimators.
Regardless of the options added to the core OMA software, Dewesoft ARTeMIS OMA, there will always be native support for DewesoftX Datafiles (DXD) and software maintenance will be included in the price - one-time purchase, same as the DewesoftX software.
Estimators
FDD
The idea of the Frequency Domain Decomposition (FDD) technique is to perform an approximate decomposition of the system response into a set of independent single-degree-of-freedom (SDOF) systems, one for each mode.


The FDD technique involves the main steps listed below:
Estimate spectral density matrices from the raw time series data.
Perform singular value decomposition of the spectral density matrices.
If multiple test setups are available, then average the first singular value of all test setups and average the second, etc.
Peak pick on the average singular values. For well-separated modes always pick on the first singular value. In case of close or repeated modes, pick on the second singular value, the third singular value, etc. as well.
Optionally, if multiple test setups are available, inspect the singular values of each test setup and edit the peak picking position if necessary.
EFDD
Compared to Frequency Domain Decomposition (FDD), the enhanced version adds a modal estimation layer. The modal estimation is now divided into two steps. The first step is to perform the FDD Peak Picking, and the second step is to use the FDD-identified mode shapes to identify the Single-Degree-Of-Freedom (SDOF) Spectral Bell functions and from these SDOF Spectral Bells estimate both the frequency and damping ratio.
The identification of the SDOF Spectral Bell is performed using the FDD-identified mode shape as a reference vector in a correlation analysis based on the Modal Assurance Criterion (MAC).


Besides storing the singular values that describe the SDOF Spectral Bell, the corresponding singular vectors are averaged together to obtain an improved estimate of the mode shape.
The natural frequency and the damping ratio of the mode are estimated by transforming the SDOF Spectral Bell to the time domain. What we then obtain is an SDOF Correlation Function, and by simple regression analysis, we obtain the estimates of both the natural frequency as well as the damping ratio.
These modal estimates will be good if the correlation function decays to a sufficiently small level of correlation. This can be accomplished by having sufficient frequency resolution. In this case, the bias of the natural frequency and the damping ratio will be small.
CFDD
The Curve-fit Frequency Domain Decomposition (CFDD) adds a modal estimation layer to the FDD Modal Estimation just like the EFDD does. The modal estimation is therefore divided into two steps. The first step is to perform the FDD Peak Picking, and the second step is to use the FDD-identified mode shapes to identify the Single-Degree-Of-Freedom (SDOF) Spectral Bell functions and from these SDOF Spectral Bells estimate both the frequency and damping ratio using a frequency domain curve fitting technique.


The identification of the SDOF Spectral Bell is performed using the FDD-identified mode shape as a reference vector in a correlation analysis based on the Modal Assurance Criterion (MAC).
Besides storing the singular values that describe the SDOF Spectral Bell, the corresponding singular vectors are averaged together to obtain an improved estimate of the mode shape.
The natural frequency and the damping ratio of the mode are estimated by curve fitting the SDOF Spectral Bell using frequency domain least-squares estimation. Since the SDOF spectral bell is free of the influence of other modes there is only a single eigenvalue and residue to fit. The natural frequency as well as the damping ratio are then extracted from the eigenvalue.
SSI-UPC
In the Stochastic Subspace Identification (SSI) techniques a parametric model is fitted directly to the raw times series data. A parametric model is a mathematical model with some parameters that can be adjusted to change the way the model fits to the data. In general, we are looking for a set of parameters that will minimize the deviation between the predicted system response of the model and the measured system response (measurements).
A stabilization diagram is an engineering tool used to handle bias errors in the estimates of modal parameters, considering the order of the system is unknown. The system order determines the size of the eigenstructure of the system.


The singular values (the yellow horizontal bars) indicate the rank of the weighted common SSI input matrix. What you are doing when you estimate a state space model is to specify what subspace of singular values of this matrix to include in the estimation. This subspace should at least include all singular values significantly different from zero. This means all the ones that look yellow in the diagram.
SSI-UPCX
Stochastic Subspace Identification with eXtended Unweighted Principal Component, or in short SSI-UPCX. A unique aspect of the SSI-UPCX technique is that uncertainty estimation of the modal parameters is performed in a fast and memory-efficient way. The uncertainty estimation makes SSI-UPCX stand out, compared to today's modal analysis estimation techniques. Some of the benefits are:
More precise estimates of modal parameters than when using conventional "mean value" based clustering techniques,
Effective elimination of computational (noise) modes and other unstable modes,
Automatic modal estimation becomes more reliable.


In general, modal estimation methods that make use of Stabilization Diagrams only present the estimates of the modal parameters. With the SSI-UPCX it is possible to visualize the uncertainty of the individual estimates, in terms of confidence intervals around the estimated modal parameters. An example of this is shown below. For a chosen 95% confidence level, the confidence interval level illustrated by the gray horizontal bars clearly shows the uncertainty for each mode in the Stabilization Diagram.