


Suspension Force Measurements On a Racecar
Carsten Frederiksen & Stefano Maniero (Member of the Vehicle Dynamics Department) and Giulia Brunori (Head of the Vehicle Dynamics Department)
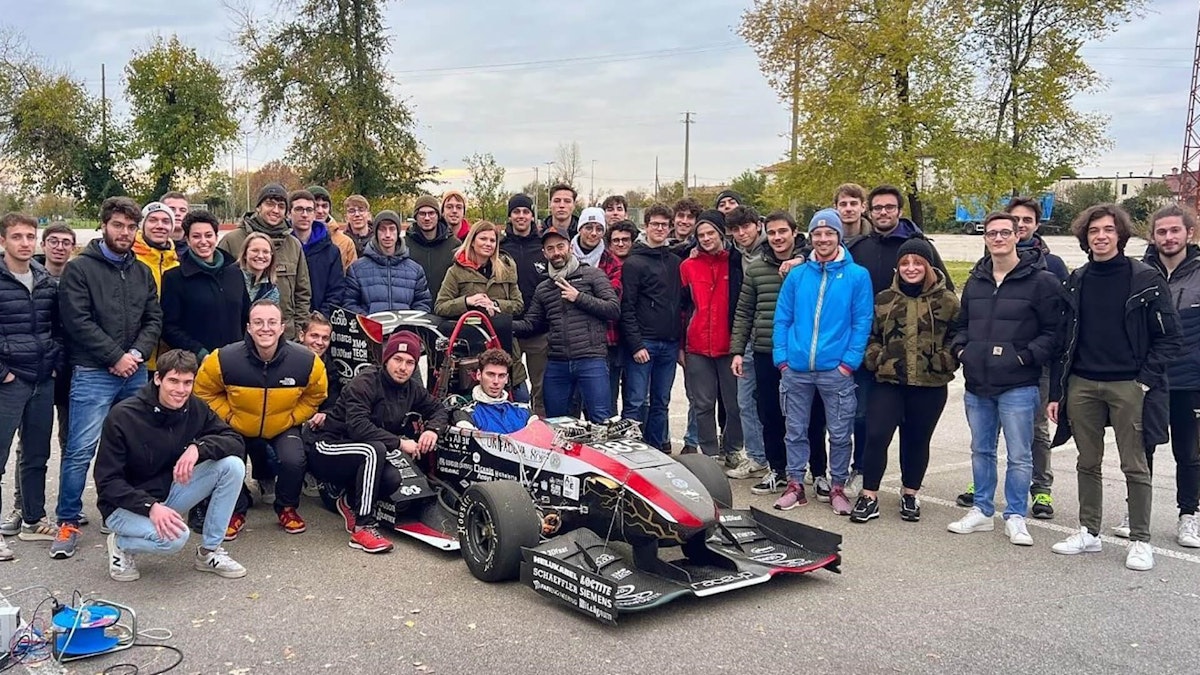
Race UP Team Electric, Università di Padova, Italia
May 25, 2023
For the season 2022/23, the Race UP Team Electric switched to low aspect ratio tires on its racecar, which created a need to redesign the suspension kinematics. To ensure the correct sizing of the mechanical components, the team had to validate its tool for estimating the stresses acting on the suspension arms. The team has developed a dynamic predictive model. During a track test campaign, they measured the actual suspension system loads with the support of Dewesoft and Deltatech Italia.
Formula SAE and Race UP
Formula SAE is a worldwide competition born in 1981, in which single-seated race cars, designed and built entirely by university students compete each year. The final ranking is drawn up based on both the evaluations of the leading experts in the sector on design, cost management, and the creation of an economically sustainable production model (Static Events), as well as the performance of the cars in track races (Dynamic Events), in particular:
Acceleration - a 75 m straight;
Skid pad - Figure 8 track that tests the lateral grip of the car;
Autocross - A qualifying lap where the car’s maximum potential can be unleashed without any limitations aimed at reducing energy consumption;
Endurance - the "Queen" test of the competition consisting of a 22 km timed race and evaluates the reliability and efficiency of the vehicle.
Consequently, the competition requires skills spanning various disciplines, representing an excellent testing ground for students from multiple faculties.
Within the University of Padua, the competition was introduced in 2003 by Professor Giovanni Meneghetti. Initially, the Race UP team took part only in the category dedicated to cars with internal combustion engines, while since 2016, parallel development of an all-electric single-seater has begun.
The electric single-seater took part in Formula ATA and FS East in the 2022 season, obtaining in both competitions sixth place in the overall standings and second place in the "Acceleration" event – furthermore setting the Italian record with a time of 3.614 s.


The electric car is equipped with a 4-wheel drive system and powered by four AMK motors with 35 kW of power each. The suspension scheme is a double wishbone with a pushrod, which connects to the shock absorber and regulates the vertical movement, and a tie rod, which constrains the rotation around the steering axis.


For the 2023 season, the car will adopt 16x7.5-10 Hoosier tires to replace the previously used 18x7.5-10 Hoosier. For this reason, the suspension system will have a new geometry, whose kinematics we designed to increase the steering angle and reduce the effort required to steer the car.
To implement this change optimally - minimizing the structural risks due to incorrect sizing of the suspensions - we decided to validate the tool for estimating the loads acting on the suspension arms, a dynamic predictive model developed internally by the team. The forces acting on the suspension arms of the 2022 car were measured experimentally, comparing the data with the values returned by the model.
The contribution of Dewesoft was fundamental, providing instrumentation and technical support in the acquisition and processing of experimental data.
Measurement instruments
To directly measure the forces to the arms, we applied strain gauges to the right side of the car, both at the front and rear. These were Micro Measurement 350 Ohm gauges supplied by Deltatech Italia, already composed of two orthogonal resistive grids. By glueing two of them per arm, it was possible to obtain an entire Wheatstone bridge, with a consequent increase in sensitivity and compensation of temperature effects and bending moment - the latter not negligible, in particular, in the upper triangle arms.
The electronics department then dealt with the configuration and wiring of the connectors as required by the acquisition interface made available by Dewesoft, i.e., the SIRIUSe-HD-16xSTGS, which allowed us, in synergy with the Krypton CPU also supplied by Dewesoft, to acquire data with a sampling frequency set to 1000 Hz.


In parallel to the measurements performed with Dewesoft acquisition systems, we also logged data with a self-produced logger embedded in the control unit. In particular, the most relevant quantities used in the generation of the estimates to be validated are:
Real speed - calculated as the average of the four wheels;
Triaxial accelerations and angular velocities - measured by the IMU module (Inertial Measurement Unit) installed at the vehicle's center of gravity;
Suspension compression - measured by linear potentiometers mounted in parallel to the spring-shock absorber systems.
These measurements were stored on an SD card by the control unit with a frequency of 25 Hz.
Data acquisition
The test campaign took place on 11/30/2022, with the presence and support of the Dewesoft Italia team.
Once we had calibrated the strain gauges and the team's internal control unit, a series of dynamic manoeuvres were carried out:
Track laps (figure 6), clockwise and counterclockwise;
Skidpad (figure 7);
Slalom;
Lane change (figure 8);
Acceleration + hard braking on a 75m straight.


Model
The model developed by the Race UP Team and validated through the test campaign uses the measured values of speed and acceleration of the car to estimate the stresses acting on the suspension arms.
Initially, we calculated the vertical forces on each wheel. These forces have a static component, given by the vehicle mass, and a dynamic component, due to the accelerations to which the vehicle is subjected and its speed, which gives rise to aerodynamic forces.
In particular, we have:
where CLA and CDA are the lift and drag coefficients per area, ⍴ is the air density, v is the speed of the vehicle relative to the atmosphere, while zG, tf/r, and w represent the height of the center of mass, the vehicle front and rear track and wheelbase, respectively.
The terms determined above are the lift (Equation 1) and drag force (Equation 2) acting on the vehicle, load transfers due to longitudinal (Equation 3) and lateral acceleration (Equation 4), and transfers due to drag force (Equation 5). From these, we obtain the vertical forces acting on the individual wheels:
where wf is the front weight distribution percentage, and aa is the percentage of aerodynamic force at the rear.
We could now define the horizontal and lateral forces working on each wheel through Pacejka's Magic Formula - as a function of tire parameters and a series of variables, including vertical force, camber, side slip, and longitudinal slip.
Given the complexity and high cost of the instruments that allow the direct measurement of the two slips, possible through optical or inertial methods, we decided to proceed with a simplification, i.e., to consider the friction coefficient of the tire as constant. In this way, we obtain at every instant:
i.e., Fx and Fy on each wheel are directly proportional to the vertical force, and, in the x direction, added the contribution of the drag force, which must be beaten to produce the acceleration in question.
To evaluate any inconsistencies, we successfully verified that, in this case, the theoretical friction coefficient was always lower than the maximum obtainable when the vertical load varies.

 and the maximum obtainable friction coefficient (curves).")
Subsequently, we performed the study of the kinematics, carried out in the MATLAB environment using geometric analysis methods, obtaining a matrix containing the unit vectors of each arm for each n-th position along the degree of freedom of the wheel. In this phase, we neglected the contribution of the steering for simplicity.


Once the forces on the wheel and the positions of the arms are known, the forces are calculated.
The basic assumption of the analysis is to have, in every instant, full statics of the kinematics, with the consequent validity of the static equations:
We chose to neglect the displacements of the wheel unit and its rotations induced by the system of forces and moments. They would not have been obtainable from the data without adding a larger uncertainty than that already included due to the hypothesis of the instantaneous static nature of the assembly.
The starting point is the known positions of the assembly at all n points where it has been solved geometrically. The MATLAB environment represents these positions by a series of matrices.
As many as the points with n lines of three-dimensional vectors - each relating to a particular configuration. These are useful to define the forces in three-dimensional space and then solve the equilibrium. I note that for each arm:
we obtain the six equations with six variables, expressed in matrix form \(A_x=b\):
Finally, it’s time to choose which of the n configurations to adopt. Initially, this step was for each configuration to determine the force required by the shock absorber to balance the wheel assembly and to choose the one that guarantees equilibrium, uniquely defined by construction. Alternatively, you can cross-reference this data with the actual position measured by a potentiometer that detects how far the shock absorber extends.

 and the force expressed by the shock absorber along its stroke (red).")
Through the described procedure, we reached the final solution in the form of a vector containing the six forces along the arms.
Data analysis
Once we completed the phase of data collection, we first assessed the quality of the acquisitions: the results were satisfactory. The very high sampling frequency obtainable with Dewesoft hardware also allowed us to carry out data filtering operations without losing accuracy. Figure 12 shows an analysis of the right front wheel as an example.


Once we processed the data from the control unit, we compared the predictive model results with the acquisitions of the strain gauges. The excellent data correspondence confirmed the validity of the estimates used up to now.
Figure 13 shows an example of the model’s consistency. You may notice how the stresses recorded by the strain gauges are described almost perfectly by the physical model created in the MATLAB environment.


The accuracy decreases in the same comparison on a stretch that is no longer straight but with active steering. The first iteration of the model doesn’t yet include the wheel movement in steering and, therefore, probably cannot provide a completely accurate balance of the forces. Nevertheless, the general trend is respected and the model is accurate in its design conditions.

We then adopted a different approach, generating normalized histograms for the study of fatigue life: only the instants in which the car was moving were isolated from the data and acquisitions, and then the two force frequencies histograms, measured and calculated, were compared. We note that:
if the lower and upper limits on the horizontal axis coincide, the model correctly estimates the limit forces for dimensioning;
if the shapes of the histograms coincide with fair accuracy, the load history is also accurately estimated, and the histogram is usable for fatigue sizing.
This step was essential to optimize the study of the duration of our arms - a key objective of the analysis in question.
An example of comparing these histograms is shown below, also referring to the rear arm of the lower triangle of the front wheel, as in the two previous figures.

It’s plain to see how the model follows with excellent accuracy the shape obtained by evaluating the measured forces. Furthermore, it overestimates the tensile load by a factor of 1.5. It is thus a tool valid for a safety study, especially considering that tensile stress is the most dangerous stress type for bonded joints.
The model accuracy, in terms of the similarity of the histograms, is also verified for all the arms constituting the triangles and for the pushrod.
Conversely, in the case of the tie rod, the forces are very different and underestimated by a factor of 2.5 by the model, which doesn’t yet implement the steering study. This information was extremely useful, as it led to an increase in the design effort of the steering, avoiding risks related to the bond life at the steering assembly.
Conclusions
Having had the opportunity to validate the calculation tools was of fundamental importance to the Race UP Team.
Indeed, verifying the accuracy of the model in predicting a load history and maximum forces acting on the suspension allowed the team to use it to estimate the force variation between the kinematic configuration of the 2022 car and the modified one for the 2023 car, as well as to size and verify the glueing of the new carbon arms based on the load history.
Furthermore, this experience allowed us to identify the model’s limits, providing the starting point for its improvement.
Sincerest thanks from the Race UP team to Riccardo Petrei, Samuele Ardizio, Alessia Longo, and the entire Dewesoft company, not only for the hardware but above all for the availability, collaboration, and technical support provided.