Table of contents
Browse categories
Browse authors
 AB
ABAlberto Boffi
 AL
ALAlessia Longo
 AH
AHAl Hoge
 AB
ABAljaž Blažun
 BJ
BJBernard Jerman
 BČ
BČBojan Čontala
 CF
CFCarsten Frederiksen
 CS
CSCarsten Stjernfelt
 DC
DCDaniel Colmenares
 DF
DFDino Florjančič
 EB
EBEmanuele Burgognoni
 EK
EKEva Kalšek
 FB
FBFranck Beranger
 GR
GRGabriele Ribichini
Glacier Chen
 GS
GSGrant Maloy Smith
 HB
HBHelmut Behmüller
 IB
IBIza Burnik
 JO
JOJaka Ogorevc
 JR
JRJake Rosenthal
 JS
JSJernej Sirk
 JM
JMJohn Miller
 KM
KMKarla Yera Morales
 KD
KDKayla Day
 KS
KSKonrad Schweiger
Leslie Wang
 LS
LSLoïc Siret
 LJ
LJLuka Jerman
 MB
MBMarco Behmer
 MR
MRMarco Ribichini
 ML
MLMatic Lebar
 MS
MSMatjaž Strniša
 ME
MEMatthew Engquist
 ME
MEMichael Elmerick
 NP
NPNicolas Phan
 OM
OMOwen Maginity
 PF
PFPatrick Fu
 PR
PRPrimož Rome
 RM
RMRok Mesar
 RS
RSRupert Schwarz
 SA
SASamuele Ardizio
 SK
SKSimon Kodrič
 SG
SGSøren Linnet Gjelstrup
 TH
THThorsten Hartleb
 TV
TVTirin Varghese
 UK
UKUrban Kuhar
Valentino Pagliara
 VS
VSVid Selič
 WK
WKWill Kooiker
Dynamic Characterization of a Two-Span Pedestrian Bridge

Rok Mesar && Daniel Colmenares, Ph.D. and Civil Engineer, Dewesoft Sweden and Jernej Sirk, Application Engineer, Dewesoft HQ.
Kungliga Tekniska Högskolan
August 28, 2025
At the technical university, Kungliga Tekniska Högskolan (KTH), in Stockholm, Sweden, a pedestrian bridge spans a road and a railway. Recently, the university has teamed up with two companies, Strusoft and Dewesoft, to study, analyze, and monitor the dynamic properties of the bridge. The collected data will help students learn how to evaluate the structural dynamic properties of bridges and fine-tune models.
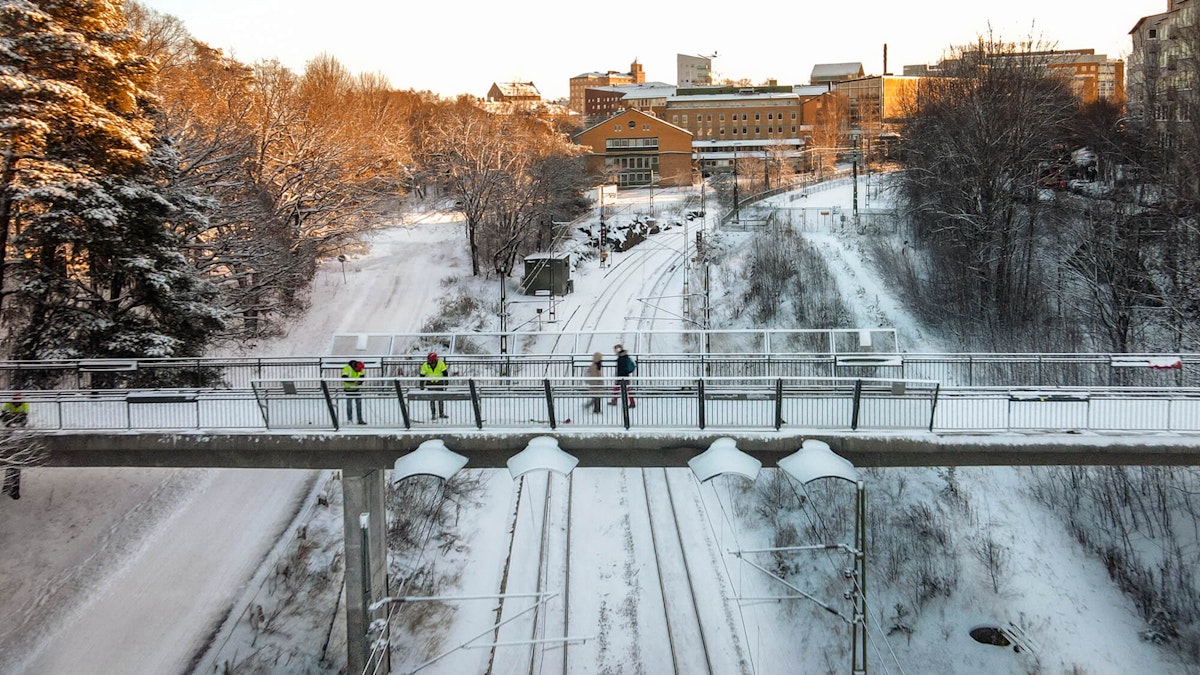
Kungliga Tekniska Högskolan (KTH), the Royal Institute of Technology is the largest technical university in Sweden. The Structural Engineering and Bridges division at KTH’s Department of Civil and Architectural Engineering developed this bridge monitoring project. Professor Raeid Karoumi heads the joint project, which started in September 2023 with the building of an open-source bridge database as a core objective.
Future Ph.D. students can use these data to learn how to perform EMA/OMA and calibrate mathematical FE (Finite Element) models on real-life data. They can experience how different conditions and loads affect the bridge’s dynamic performance and how to assess bridge health and plan maintenance.



The joint project involves Strusoft and Dewesoft. Strusoft is a Swedish software company. They are developing structural design software to help engineers analyze, design, manufacture, and assemble buildings and other structures. Dewesoft is a Slovenian provider of monitoring tools, such as sensors, data acquisition devices with software, and databases.
Within the project, KTH provided the installation and data interpretation, while Strusoft delivered the software used to build the bridge FEM. Dewesoft supplied the accelerometers, temperature sensors, data acquisition, the IEPE input to perform hammer testing, and analysis software, including Experimental Modal Analysis (EMA) and Operational Modal Analysis (OMA).
Civil engineer Daniel Colmenares Herrera, Ph.D., was responsible for the KTH part, while M.Sc. in civil engineering and urban planning, Shaho Ruhani, that of Strusoft. The Dewesoft side was handled by monitoring business developer Rok Mesar and Swedish country manager Tobias Ljunggren.
The bridge monitoring
The KTH two-span bridge provides safe passage for pedestrians in the Albano area. It connects the KTH campus and Stockholm City by passing over a vehicle road and the train lines.
As the structure is at the KTH university campus, a highly crowded area of Stockholm city, the criteria for comfort are more severe. Assessing the dynamic performance of the bridge becomes an important task.
The bridge presents several natural frequencies below 6 Hz. Such bridges may show poor dynamic behavior when subjected to human-induced loads and possibly surpass the serviceability limit state.
Moreover, the bridge may present different dynamic properties - frequencies and damping, for winter and summer weather conditions. Making a dynamic assessment at operational and near resonance conditions improves engineering decision-making on maintenance.
Monitoring allows KTH to reliably determine the dynamic properties of the system, frequencies, damping, and mode shapes. These properties enable the calibration of a complete Finite Element (FE) model for different weather conditions. The university can track the system’s inherent properties and compare these over time to make more realistic assessments of the bridge's status. All in all, engineers can identify bridge damages and make rational decisions on maintenance at an early stage.
The KTH bridge
The pedestrian bridge at KTH consists of a continuous 2-span post-tensioned concrete girder, as shown in Figure 2. The spans are 34.75 m each, with a column support in the center that is 9 m long. The bridge deck has support at the end of both spans.
The cross-section of the bridge deck varies, as shown in Figure 3. Figure 4 shows the variation of the cross-section inertia and area. The bridge deck consists of class K45 and the support column of K40 concrete. We haven’t studied the effect of the post-tensioned cables.
Rough eigenvalue analysis
We estimated the bridge's dynamic properties using handbook formulas. For the longitudinal mode of the bridge described, we lumped the mass at the top of the support column. We included the column's modal mass in the equivalent lumped SDOF system (24.24 % of the column's mass). See the results in Table 1.
For the first bending mode, we assumed the support column would behave as a pin support, conforming to a 2-span beam system. We could then estimate its first bending mode as a full sine function (the second bending mode of a simply supported beam system). See the results in Table 1.
| L_b [m] | 69.5 |
| E_b [Pa] | 3.40E+10 |
| (assumed) I_b [m^4] | 0.3 |
| L_c (free length) [m] | 7 |
| m_b [kg] | 440160 |
| m_c [kg] | 31104 |
| 24,24 % m_c [kg] | 7539.6096 |
| E_c [Pa] | 3.30E+10 |
| I_c [m^4] | 0.0768 |
| k_c | 3 E_c I_c / L_c^3 |
| f1_long [Hz] | 1.12 |
| f1_bending [Hz] | 1.65 |
Results from previous measurement tests
Table 2 shows the results of the measurement campaign performed in autumn weather conditions (15.4°C). We will compare these results with the new measurement campaign conducted in winter weather (-5°C).
| Mode | Natural frequency [Hz] | Damping [%] |
|---|---|---|
| 1 (Bending) | 1.77 | 1.4 |
| 2 (Bending) | 2.68 | 1.1 |
| 3 (Lateral) | 2.81 | 0.6 |
| 4 (Bending) | 5.61 | 1.1 |
| 5 (Lateral) | 5.37 | 0.7 |
| 6 (Bending) | 7.27 | 2.5 |
Monitoring setup
The field measurements were carried out to measure and study the dynamic properties and dynamic response due to different loading scenarios. We placed the sensors along the bridge deck following an FE model to have a calibrated idea of the system’s expected dynamic properties.
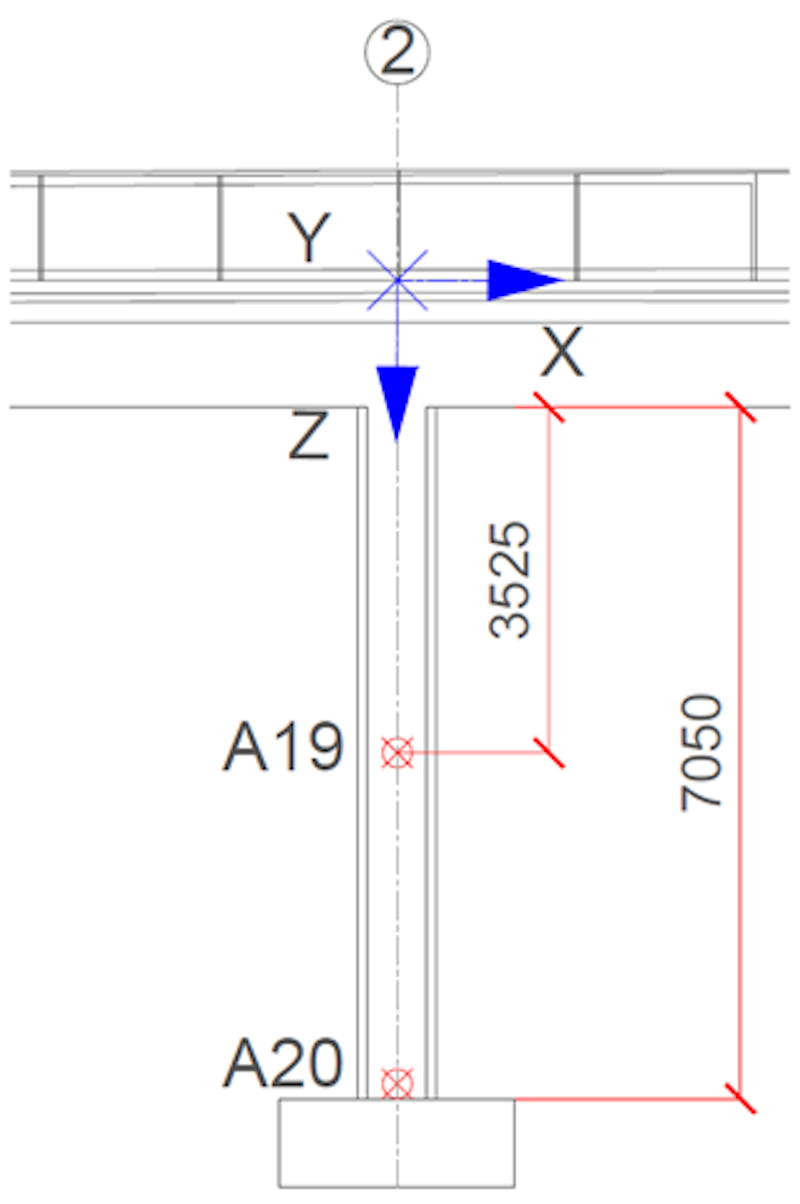
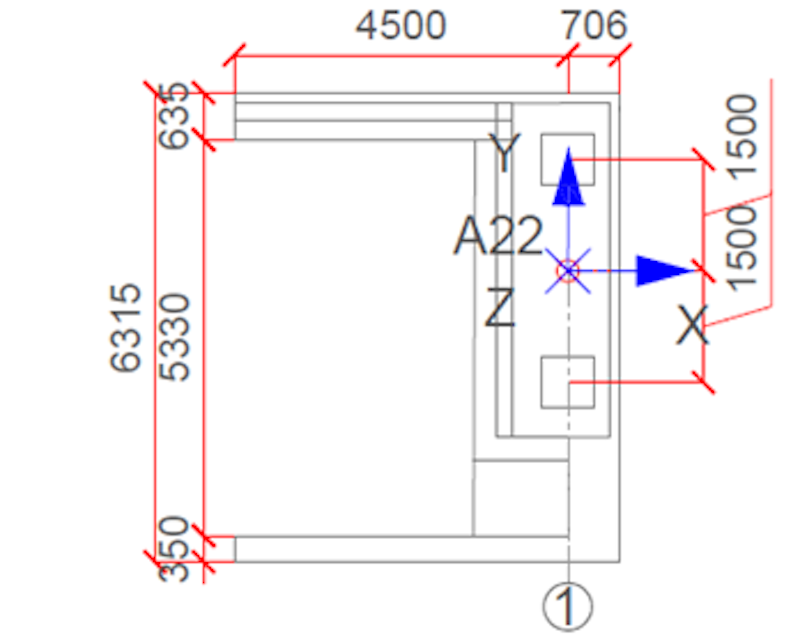
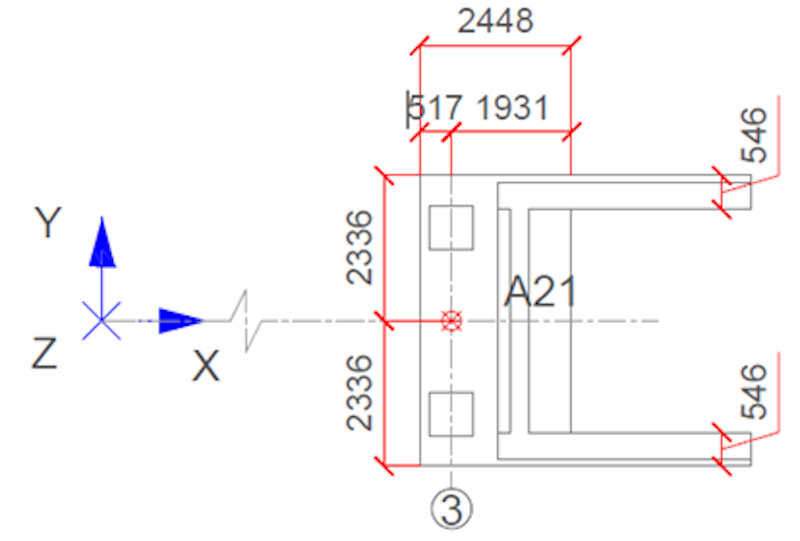
To address the system’s longitudinal, lateral, and vertical behavior, we uniformly distributed 18 triaxial accelerometers on both sides of the bridge deck. Two triaxial accelerometers located at the vertical support column of the bridge include and assess its dynamic behavior and role in the global system.
One triaxial accelerometer was placed in each abutment to assess the potential train-induced vibration and calibrate the model for the possible soil-structure interaction (SSI) effect. Figure 5 shows a schematic of the measurement plan. Figure 6 shows the layout of the bridge's instrumentation. The selected number of accelerometers and their distribution facilitates the avoidance of spatial aliasing for high-order vibration modes.
We performed a hammer test in the F1 and F2 locations in our initial experimental campaign. We applied a force and an exponential window to the impact and response signal, respectively, to improve the coherence function of the frequency response function (FRF) estimator.
We estimated the FRFs by computing the input’s auto-power spectral density and the cross-power spectral density between input and output signals, following the H1 estimator. To improve the quality of the FRFs, we averaged the results of several impact hammer hits.
We applied digital signal processing to the measured data. We used a zero-phase bandpass filter to process the signals (0.1 to 25 Hz) for the hammer test. The force and exponential windows enhanced the coherence function by consistently improving the recorded signals’ causality.
This way, we minimized double ringing and reduced inherent noise in the data. A correction factor was applied to obtain the proper damping ratio estimator since the exponential window adds artificial damping.

Monitoring instrumentation
IOLITEiw-3xMEMS-ACC is a 3-axial, low-noise (25 μg√Hz spectral noise density) accelerometer with an integrated DAQ and EtherCAT interface. It is fully waterproof and protected by IP67. The device can measure structural accelerations in X, Y, and Z, as well as static inclinations and displacements.
IOLITEiw-3xMEMS-ACC-T is a 3-axial, low-noise (25 μg√Hz spectral noise density) accelerometer with an external digital temperature sensor, integrated DAQ and EtherCAT interface. The device is fully waterproof with IP67 protection. The device can measure structural accelerations in X, Y, and Z, as well as static inclinations and displacements.
IOLITE-1xACC is a high-quality signal conditioner for IEPE sensors. In this case, we used it to read the data from the Dytran impulse hammer.
Dytran 5803A is an IEPE Impulse Sledge Hammer with a definable impulse force for exciting larger structures, enabling studies of their dynamic behavior.
Installation
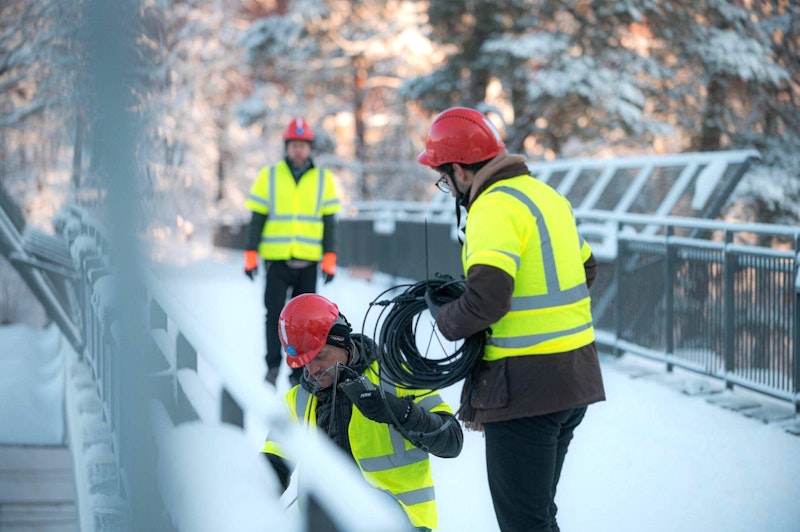
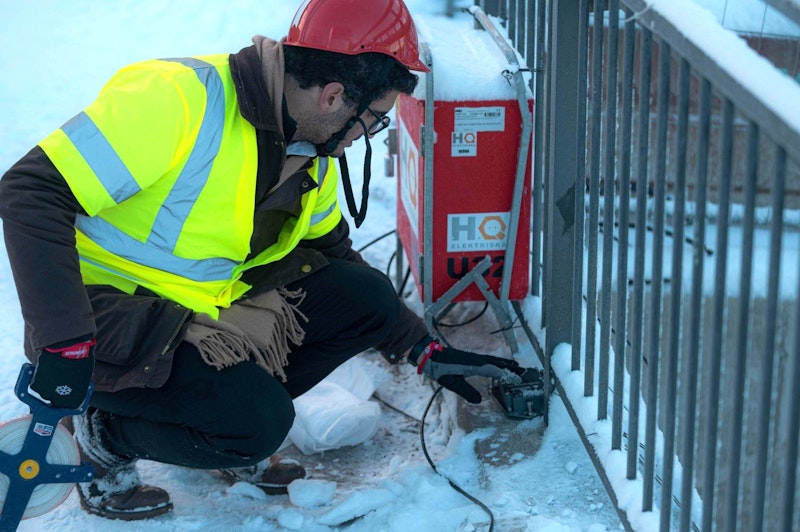
On November 28th, 2023, we installed the system in challenging weather conditions marked by temperatures as low as -5°C and snow.
We used specially designed robust mounting brackets to position the accelerometers on the deck. We designed two specific mounting bracket types up front to expedite the process. These brackets helped effortlessly accommodate the device placement without screwing or adhesive bonding.
A specialized silica-based adhesive securely affixed the units installed on the columns.
Monitoring software
The solution is a combination of several software products:
DewesoftX data acquisition software: Test and measurement acquisition software for data recording, signal processing and analysis, and data visualization.
Dewesoft Historian: Software service for long-term and permanent monitoring, including storage in an InfluxDB time-series database.
Dewesoft Artemis OMA: A software suite for analyzing the structural dynamics of structures, operating machinery, and any structure that is hard to excite in a controlled manner. Modal parameters, such as mode shapes, natural frequencies, and damping ratios, can be determined for the operating structures by acquiring only the output response data.
Dewesoft Modal Testing and Modal Analysis: A software suite for the structural dynamics analysis of civil engineering structures, operating machinery, and any structure artificially excited in a controlled manner using a hammer or shaker. Modal parameters, such as mode shapes, natural frequencies, and damping ratios, can be determined for the operating structures acquiring input/excitation and output/response data. The software features Experimental Modal Testing (EMA), Operational Deflection Shapes (ODS), and Operational Modal Analysis (OMA).
Strusoft FEM-Design: An advanced and intuitive structural analysis software that supports all structural engineering requirements. The software includes 3D modeling, design, and finite element analysis (FEA) of concrete, steel, timber, composite, masonry, and foundation structures. All calculations follow Eurocode standards, with some specific National annexes.
Measurement setup - OMA (operational modal analysis)
For analyzing accelerations, we used a system with Dewesoft Artemis OMA software, an IP65 cabinet with an industrial PC, DewesoftX software, UPS, PWIN, and power supply, and
low-noise density capacitive triaxial MEMS sensors.
The IOLITEiw-3xMEMS-ACC EtherCAT device embeds these accelerometers. Where temperature and acceleration had to be measured, we installed IOLITEiw-3xMEMS-ACC-T, which, in addition to the accelerometer, also includes a temperature sensor. A microprocessor inside the IOLITE 3xMEMS device transmits the samples to DewesoftX software running on Windows or any EtherCAT master controller.
We acquired the data at a 200 S/s sample rate and stored them in a 4-hour DXD file. We later imported this file into Dewesoft Artemis OMA for analysis.
OMA steps
We used DewesoftX software for data acquisition, geometry, and degrees of freedom (DOF) assignment. DewesoftX generated a UNF file format for geometry export and a DXD file for the data, which we imported into Dewesoft-Artemis OMA.
In the analysis/preparation of the data section, we selected decimation to 20Hz and used the EFDD (Enhanced Frequency Domain Decomposition) method.
OMA results
We performed an Operational Modal Analysis to extract bridge natural frequencies, damping ratios, and mode shapes.
| Mode | Frequency (Hz) | Damping (%) |
|---|---|---|
| 1st (bending) | 2.22 | 2.1 |
| 2nd (bending) | 3.03 | 2.2 |
| 3rd (lateral) | 6.09 | 0.9 |
| 4th (bending) | 6.97 | 0.8 |
| 5th (bending) | 8.32 | 0.8 |
| 6th (lateral) | 11.39 | 2.1 |
Measurement setup – EMA (experimental modal analysis)
We applied the Dytran 5803A, an IEPE impulse sledgehammer, for artificial excitation. The two spots, F1 and F2, were identified to excite the structure - see Figure 6.
The system included Dewesoft Modal Testing and Modal Analysis software, an IP65 cabinet with an industrial PC, DewesoftX software, UPS, PWIN, power supply, low-noise density capacitive triaxial MEMS sensors, and a modal impact hammer.
EMA steps
In the Dewesoft Modal Testing module, we selected the Impact Hammer excitation and the Roving Hammer option, which allowed us to excite the structure at multiple points. We also needed to define the correct frequency resolution to determine the size of the time domain data block for calculating one block. The main results from the MT module are frequency response function - FRF and coherence function.
According to the bridge measurement plan, we should excite the structure at two points, so we created two excitation channels (nr. 23 and nr. 24) for the Impact hammer testing. The trigger level was set to 50N, meaning the software does not recognize impacts below this level. We also needed to determine the direction and orientation of the excitation channels.
We measured the responses at 22 points with triaxial accelerometers and created 66 response channels - 22 points in three directions. Node IDs, directions, and orientation needs to be defined for each location accordingly.
We designed the KTH bridge geometry in the Geometry Editor. You can do geometries by defining and combining objects, importing UNV files, or individually positioning each coordinate point.
We could animate the structure geometry based on acquired FRFs by selecting frequency.
We used the Modal analysis module to extract modal parameters from the measured data. For calculation, we could use all the FRFs, and in the modal analysis setup, we defined the bandwidth and maximum order of polynomial fittings.
We could calculate the mode shapes by manually selecting the stable poles on the stabilization diagram.
EMA results
| Mode (ID) | Dampened frequencies (Hz) | Damping Ratios (%) |
|---|---|---|
| 1 | 2.25 | 0.861 |
| 2 | 3.10 | 0.956 |
| 3 | 6.96 | 0.923 |
| 4 | 8.30 | 1.315 |
| 5 | 13.91 | 1.225 |
| 6 | 15.83 | 1.393 |
Lateral modes were not identified as the input when performing the Hammer test in the vertical direction. Hence, vertical and torsional modes are activated.
Finite Element Modeling
The FE model gave us an idea of the uncertainty associated with the system. We studied the influence of temperature changes and their effects on the system’s dynamic properties.
The four aspects studied are:
the variations of the elastic modulus of concrete,
the influence of the elastic boundary conditions,
the influence of the mechanical properties of the asphalt layer, and
the influence of the expansion joint on the system properties.
In this case, we made two models:
The shell-based model (engineering model).
The solid model (research model).
For our engineering model, we modeled the bridge deck and column with 9-noded 3D shell elements (Mindlin–Reissner elements) with an average mesh size of 0.1 m. We modeled the edge beams with 2-noded 3D beam elements (Timoshenko) with a division number of 20. We didn’t include the effect of prestressed concrete in the FE model.
We performed a convergence analysis concerning the system’s natural frequencies to investigate the convergence of the selected mesh - without considering the railings. See the shell-based model in Figure 20.
We used the engineering-based model to understand the influence of the concrete material property uncertainty on the system’s dynamic properties. We focused on the combination with the boundary conditions' effect on the structure, as the roller bearings may not be active in its operational conditions due to friction at the supports.
See the parametric analysis results of the system’s natural frequencies as a function of the elastic modulus of the concrete material and the boundary conditions (- roller-roller and - pin-pin) in Figure 21.
We made the research model using a 10-node quadratic tetrahedron element having an initial mesh size of 0.6 m. For the steel railings extending four meters from the bridge deck to the abutment (KTH side), we used 3D Euler-Bernoulli beam elements having an initial 0.2 m mesh size. Finally, the asphalt layer has a constant thickness of 75 mm over the bridge deck with no continuity after the bridge deck. See a picture of the model in Figure 22.
We evaluated three aspects of the model:
The influence of the boundary conditions.
The influence of material properties of the asphalt.
The influence of the expansion joint.
We considered the influence of the boundary by assuming a linear spring in the longitudinal direction of the bridge to account for the friction at the bearing support in the bridge's operational condition. The results are in Figure 23.
The bridge’s natural frequencies change when varying the spring stiffness K_b, exposing the system’s dynamic properties as a function of the selected parameters. See the mode shapes of the system using the full 3D in Figure 24.
The influence of the asphalt layer is captured by varying the mechanical properties of the asphalt layer on the bridge as a function of temperature. See the estimated material properties of the asphalt layer in warm and cold conditions in Table 5.
| T (°C) | v (-) | P (kg/m^3) | E (Gpa) |
|---|---|---|---|
| 40 | 0.40 | 2450 | 1 |
| 0 | 0.20 | 2450 | 17 |
Hence, we computed the dynamic properties of the system by varying the properties of the asphalt layer on the FE model. Figure 25 shows the parametric analysis results of the system’s natural frequencies as a function of the asphalt layer’s elastic modulus.
We could see the effect of the asphalt layer was not as pronounced as the bearing stiffness of the bearing supports of the system. We quantified the influence of the expansion joints on the system’s dynamic properties. We assumed a linear spring linking the bridge ends with their corresponding abutments following the expansion joint geometry over a length of 4.35 m (width of the bridge).
See the results of the parametric analysis of the system’s natural frequencies as a function of the expansion joint’s elastic spring stiffness in Figure 26. The expansion joints affect the system’s first and fifth vibration modes the most.
Result comparison
See the changes in the system’s natural frequencies following autumn and winter weather conditions in Figure 27.
We saw how the seasonal temperature effect shifts the line of the system’s natural frequencies upwards, leading to a stiffer structure. Moreover, the influence of the previously mentioned aspects affects the bridge’s natural frequencies. See the change ranges accounting for asphalt properties, expansion joint, and bearing spring stiffness vs. the changes due to the temperature effect in Figure 28.
Finally, we quantified the system’s changing damping ratio in autumn and winter weather conditions - see the results in Figure 29.
Conclusions
We established why performing measurements is needed. It is not otherwise possible to define a clear trend of the modal ratio as a function of temperature.
We can explain the magnitude of the changes in the system’s natural frequencies due to temperature effects. It is a weighted sum of the changes in the asphalt layer properties, expansion joint stiffness, and the spring stiffness at the bearing supports. In this way, we could present the complete system sensitivity analysis. For future studies, we could do a full calibration of the FE model to precisely quantify the uncertainties of the system following a physics-based approach.
The results show how weather conditions can have a significant influence on the dynamic behavior of the system. Our case demonstrates the need for more reliable models supported by measurement camps on infrastructures. Monitoring structural systems can help detect early-stage damages. It can also provide a fuller understanding of the actual properties of the built system and calibrate FE models to improve the design of bridge management systems.
We made a comparison concerning the engineering mode and the full 3D model. We exposed the problem of the unicity of the solution to calibrate the models and their corresponding limitations. We may need more measurements to improve and further calibrate the FE models. For example, monitoring the bearing displacements adds valuable system information to the models.
The value of this work lies in:
Demonstrating the significant influence that weather conditions can exert on the dynamic behavior of the system,
The uncertainties that can arise upon FE-models both in an engineering and research context and
Monitoring is essential in evaluating the system’s performance and improving the current engineering practice for bridge management systems.