


What is Signal Processing?

February 21, 2022
Signal processing involves converting or transforming data in a way that allows us to see things in it that are not possible via direct observation. Signal processing allows engineers and scientists to analyze, optimize, and correct signals, including scientific data, audio streams, images, and video.
In this article you will learn about signal processing with enough detail that you will:
Understand what signal processing is at the top level
Learn how signal processing is performed
See how signal processing is applied in DAQ (data acquisition) applications
Companies spend millions of dollars every year buying test equipment so that their engineers and technicians can record test data. This investment in equipment and manpower to conduct tests is for one purpose: to understand how their products will work in the real world. This understanding can only come from capturing and analyzing high-quality, objective data.

But the data itself is only step one. To understand what the data means, we need to analyze it. Analysis has several components, including:
Making observations - by recording data and then reviewing it
Making comparisons - one of the fundamental elements of analysis is comparing A versus B, e.g., “how much torque does the drive shaft increase when we increase the speed from 100 to 200?” or “how does the current change with respect to voltage?”
The above methods are direct observations. We apply sensors of many kinds and then operate the machine or process while recording their responses. Then we look at the data and compare parameters during different phases of operation. But there’s another data analysis tool that we can use:
Signal processing - transforming data in a way that allows us to see things that are not possible by direct observation or comparison.
Signal processing (aka digital signal processing), takes several forms depending on the application. In the data acquisition (DAQ) world, we use signal processing in order to analyze measured data.
How is signal processing done?
Historically, signal processing was performed entirely in the analog domain. For example, signal filters were built using discrete components like resistors, capacitors, and inductors. This is still done, of course, but since the late 20th century, data of all types have become increasingly digitized. As a result, signal processing has necessarily transitioned from the analog to the digital domain.
Today, digital signal processing is done primarily in software. Signal processing software can run on the processor or graphics card of a desktop computer, or in a smart device. For more demanding applications it runs on dedicated DSPs (Digital Signal Processors), ASICs (Applications Specific Integrated Circuits), or FPGAs (Field Programmable Gate Arrays), and on powerful computer mainframes.


The original DSP chips were developed in the 1960s, and used for improving RADAR and SONAR in military applications. They were later applied to geophysical applications like oil exploration, space applications like data compression, and for medical imaging applications like CAT or “C.T.” (computed tomography) and MRI (magnetic resonance imaging) human body scanning.
Today, the power of even notebook computers is far greater than the biggest mainframes from the past, and a huge array of signal processing functions can be performed both in real-time and post-processing by PC-based DAQ systems.
Many systems employ a combination of host computer processing and DSP processing to perform signal processing functions. DSP hardware is very fast and can be dedicated to common functions. For example, DSPs are used in analog-to-digital converters (ADCs) for filtering, combining digital bit streams, and more. They can handle a lot of data very quickly.
Signal processing applications
Signal processing is applied across numerous industries and applications, including:
Audio compression and signal processing
Data acquisition and signal processing
Digital image and graphics processing
Video compression and signal processing
Speech recognition and processing
RADAR, SONAR, and LiDAR signal processing and signal optimization
Seismic studies and data analysis
Geophysical applications, including oil exploration
Data transmission, including error detection and error correction
Economic modeling and analysis
Medical applications, especially imagery (CAT and MRI)
Weather forecasting
Oceanography, including undersea acoustic performance predictions
Signal processing operates on both linear and nonlinear systems, however, most systems fall into the nonlinear camp, i.e., those whose values change over time, often in unpredictable ways, where a change in output is not linearly proportional to a change in the input.
Nonlinear signal processing can be implemented in several domains, including:
The Time domain, i.e., amplitude points plotted against time
The Frequency domain, i.e., frequencies plotted against their magnitudes
Spatio-temporal domain, i.e., across both space and time. For example, monitoring the routes of hundreds of aircraft all around the world, or thousands of satellites orbiting the Earth
Types of signal processing
Filtering
Filtering is one of the most basic and important signal-processing techniques. It has been used since the very beginning of analog recording, to enhance our ability to see the true signal by suppressing “noise” and other interferences. Filtering was (and is) used for applications from adjusting the bass and treble response of your music player to adjusting the channel frequency of a radio, and improving sound quality on telephone lines.


In DAQ systems, analog filters were used to attenuate signal content higher or lower than a certain frequency, to reduce “noise” in the signal. These filters were normally part of the DAQ system’s signal conditioners or preamplifiers.
The four basic filter types include:


Filters are also defined by how many poles they have. The more poles, the steeper the roll-off they are capable of performing on the signal. This roll-off or slope simply means how many decibels of the signal can be rolled off per octave. The specification of the filter in question will typically give the maximum roll-off in dB/Q.
Filter prototypes
No filter is perfect. They can impose phase delays, ripple, ringing, and other distortions within the passband. The trick is to choose the correct filter prototype that works best for the type of signals being processed. You will hear of filter prototypes such as Bessel, Butterworth, Elliptic, and Chebyshev, to name a few. Over the years, engineers have developed numerous filtering prototypes in order to provide the best possible results for various applications:
| Prototype | Roll-off | Ripple or Distortion | Other Factors |
|---|---|---|---|
| Butterworth | Good | No ripple, but square waves cause distortion (hysteresis) | Moderate phase distortion |
| Chebyshev | Steeper | Ripples in the pass-band | Poor transient response |
| Bessel | Good | No ringing or overshoot from non-sinus waveforms | Increased phase delay |
| Elliptic | Steepest | Ripples in the pass-band | Nonlinear phase response |
What’s better, analog or digital filtering?
In applications that require a simple, unchanging filter in the analog domain, it can be cheaper and easier to use an analog filter design. However, if it is required to have filters that are adaptable to a variety of applications, or to run in the digital domain, the digital approach is far less expensive and occupies a lot less space. Digital filtering can also be more accurate since it eliminates the tolerances of discrete components in the analog domain (resistors, capacitors, etc).
In the DAQ world, filtering used to be done exclusively inside the system’s signal conditioning front end. But this shifted when DAQ systems became digital in the 1980s. Today it is common for the signal conditioners to offer no filtering at all, except in a few cases where it is necessary to filter certain frequencies before the digitization process. There are two notable examples of this:
High-pass filtering of accelerometers, especially when the signal will be integrated or double-integrated.
Anti-aliasing filtering. The primary stage of anti-aliasing filtering must be done in the analog domain. An alias is a “false” signal caused by sampling too slow compared to the frequency content of the signal. Once this alias has been digitized, there is no way to recreate the true signal.
Digital filtering
Digital filtering can be performed in computer software, or in a dedicated DSP (digital signal processor). High-end applications sometimes employ custom ASICs or FPGAs to perform filtering functions.


IIR versus FIR filtering
IIR and FIR are two basic approaches to digital filtering. Each has its advantages and disadvantages:
FIR (finite impulse response) filters are calculated with many coefficients and are well-known for having essentially zero phase shifts within the passband. This is critical when signals will be compared on the time axis. FIR filtering is very calculation-intensive.

 and distortion (red line) within the passband (vertical gray line)")
IIR (infinite impulse response) filters are calculated with far fewer coefficients than FIR filters, so they are less processing intensive. They are a direct equivalent to the classic analog filters. For example, with IIR filters we can achieve the exact theoretical low pass, high pass, sound weighting, and other standard filters found in analog circuits.


In the phase comparison graph above, the green curve is the original sine wave.
The red curve is the response calculated with an IIR filter. The phase delay of the output is very obvious and quite large.
The blue curve is calculated with an FIR filter. Note that there is zero phase shift. In many applications, it is very important that the signals are not delayed by the filters, since phase comparisons are being made. In these applications, FIR filters are very important.
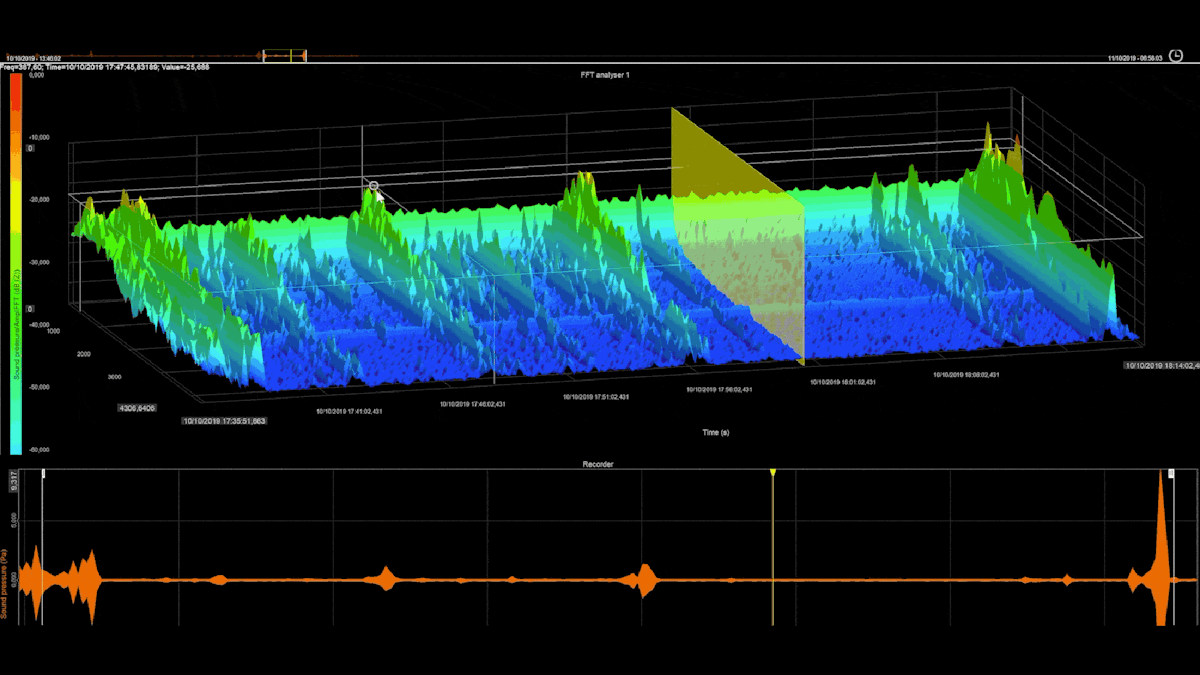
FFT analysis
Converting a signal from the time domain to the frequency domain allows us to see things in it that are not possible via direct observation. In the complex AC waveform shown below, the signal is composed of numerous frequencies:


It is difficult to know which frequencies are contained within the signal from this time vs. history graph. The solution is to use the fast Fourier transform (FFT) to capture short “windows” of time and convert them to the frequency domain. The FFT makes it easy to see what the largest magnitude frequencies are, as shown below:
")
Using FFT signal processing we can see our measured data on the frequency axis as opposed to the more familiar time axis.
Modal analysis
Modal tests and analysis are indispensable tools to determine natural frequencies, damping ratios, and mode shapes of any structure. You “excite” a structure with an impact hammer or one or more multiple modal shakers, then measure the responses using accelerometers mounted on it.
When you strike a structure with an impact (impulse) hammer, you excite a broad range of frequencies within the structure. Impulse hammers have an accelerometer built into them so that we know the exact force that has been applied.
Modal shakers operate at one frequency at a time. They can “run-up” and “run down” from one frequency to another in series, according to the test. It is also possible to use multiple shakers at the same time.
Modal analysis is heavily used in civil engineering and industries such as aerospace and automotive, across a vast range of applications, including:
Ensuring that resonances are separated from excitation frequencies
Prediction of the dynamic behaviour of components and assembled structures
Optimization of the structure’s dynamic properties (mass, stiffness, damping)
Prediction of the responses due to complex excitation
Inclusion of damping in Finite Element Models
Damage detection and assessment
Important implementations of modal testing include Modal Testing itself, Sine Reduction Test (COLA), Shock Response Spectrum (SRS), Fatigue Analysis, and more.
Learn more:


Mathematics


Because data is digital in today’s DAQ systems, there are a host of mathematical processes that can be performed on it. It is well beyond the scope of this article to cover them all, but here is just a short summary of some of the more popular math functions available in popular DAQ software programs:
Statistics: RMS, average, min, max, standard deviation, variance, classification, counting, array statistics, etc.
Time-domain analysis: delay channel, integral, derivative, latch value math, scope math, time-to-vector transform
Frequency domain analysis: cepstrum, correlation, exact frequency, Fourier transform, full-spectrum, octave analysis, short-time Fourier transform (SFFT)
Filtering: FIR, IIR, FFR, integration, derivation
Machinery diagnostics: angle sensor math, combustion noise, envelope detection, sine processing (COLA), tracking filter
Counting procedures
Acoustics: including weighting filters
Strain and stress: strain rosette calculations
Constants: vectors, matrix constant
Basic operators: addition, subtraction, division, multiplication, mod, power
Functions: square, square root, absolute, truncate, random, logarithm (base2), logarithm (base10), natural logarithm, exponent, if condition, min, max
Trigonometry: sin, cos, tan, asin, acos, atan, Pi
Logic: less than, equal, more than, less than or equal, more than or equal, not equal, not, and, or, xor
Signals: number of samples acquired, sample rate, the time elapsed, sine wave, square wave, triangular wave, noise
Measure: pulse width, stopwatch
Signal processing tools
There are a number of signal-processing tools available to engineers and scientists today. Here is a short list of some of the better-known and popular ones:
| Product | Company | Comments |
|---|---|---|
| MatLab | The MathWorks | Very powerful and extensible software system |
| GNU Octave | GNU | Open-source version of MatLab |
| SciPly | SciPly | Open source Python library |
| DewesoftX | Dewesoft, d.o.o. | DAQ software with extensive filtering, FFT, modal and mathematical capabilities |
Summary
Signal processing is applied across many industries and sectors, including acoustics, modal testing of structures, video processing, geophysics, automotive engineering, aerospace engineering, energy, medical imaging, RADAR, SONAR, LIDAR, and more. Each one applies the signal processing methods that are most germane to their particular requirements.