Table of contents
Browse categories
Browse authors
 AB
ABAlberto Boffi
 AL
ALAlessia Longo
 AH
AHAl Hoge
 AB
ABAljaž Blažun
 BJ
BJBernard Jerman
 BČ
BČBojan Čontala
 CF
CFCarsten Frederiksen
 CS
CSCarsten Stjernfelt
 DC
DCDaniel Colmenares
 DF
DFDino Florjančič
 EB
EBEmanuele Burgognoni
 EK
EKEva Kalšek
 FB
FBFranck Beranger
 GR
GRGabriele Ribichini
Glacier Chen
 GS
GSGrant Maloy Smith
 HB
HBHelmut Behmüller
 IB
IBIza Burnik
 JO
JOJaka Ogorevc
 JR
JRJake Rosenthal
 JS
JSJernej Sirk
 JM
JMJohn Miller
 KM
KMKarla Yera Morales
 KD
KDKayla Day
 KS
KSKonrad Schweiger
Leslie Wang
 LS
LSLoïc Siret
 LJ
LJLuka Jerman
 MB
MBMarco Behmer
 MR
MRMarco Ribichini
 ML
MLMatic Lebar
 MS
MSMatjaž Strniša
 ME
MEMatthew Engquist
 ME
MEMichael Elmerick
 NP
NPNicolas Phan
 OM
OMOwen Maginity
 PF
PFPatrick Fu
 PR
PRPrimož Rome
 RM
RMRok Mesar
 RS
RSRupert Schwarz
 SA
SASamuele Ardizio
 SK
SKSimon Kodrič
 SG
SGSøren Linnet Gjelstrup
 TH
THThorsten Hartleb
 TV
TVTirin Varghese
 UK
UKUrban Kuhar
Valentino Pagliara
 VS
VSVid Selič
 WK
WKWill Kooiker
Spectrum Analyzers for Sound and Vibration Analysis

September 30, 2025
In this article we will tell you about spectrum analyzers for sound and vibration measurement with enough detail so that you will:
See what spectrum analyzers are and how they differ from vibration analyzers
Learn how spectrum analyzers work
Understand how spectrum analyzers are used today
Are you ready to get started? Let’s go!
Introduction
This article will focus on real-time spectrum analyzers for sound and vibration measurements. These instruments are used for data acquisition and analysis in the frequency range between DC and several megahertz. This includes the full range of sound signals from infrasound to ultrasound.
For some applications, a spectrum analyzer is referred to as a vibration analyzer.
Vibration analyzers, covering the frequency range between DC and several megahertz, are used in various application domains, e.g.:
Acoustics,
NVH (Noise, Vibration, and Harshness),
Power and Energy,
Aerospace and Defence.
For application domains like telecommunication where the frequency range of interest is in the MHz to GHz range, other types of spectrum analyzers must be used. These are typically referred to as RF spectrum analyzers.
What is a spectrum analyzer?
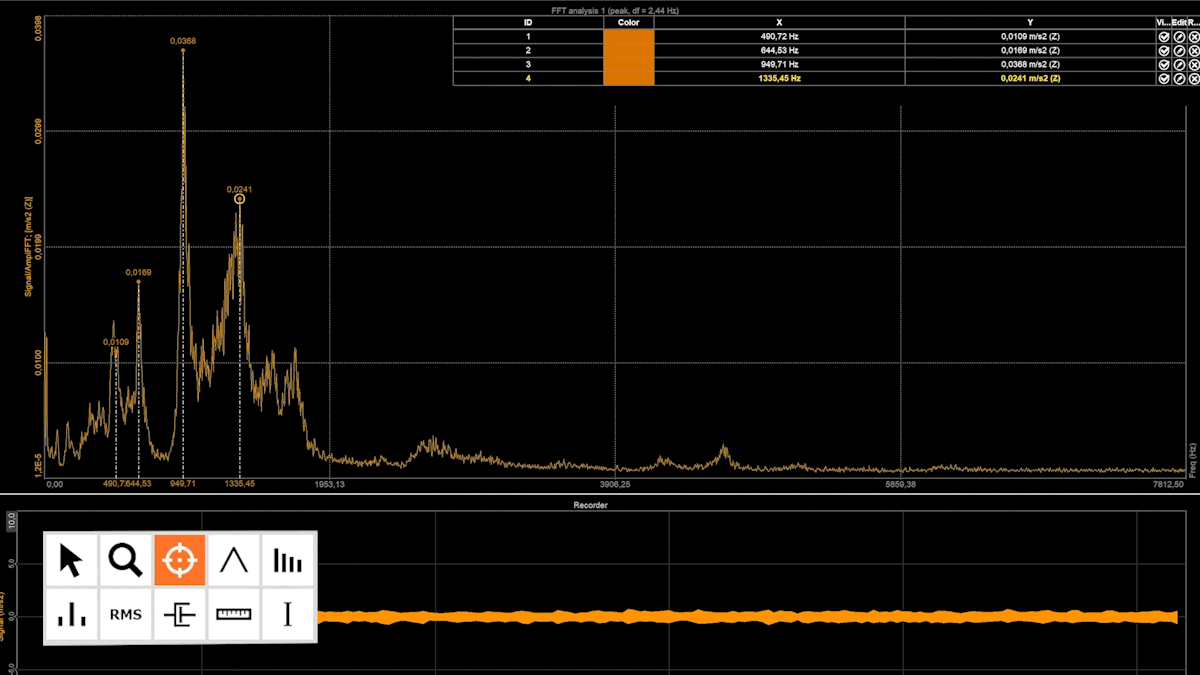
A spectrum analyzer measures the magnitude of an input signal versus frequency within the full frequency range of the instrument. The primary use is to measure the power of the spectrum of known and unknown signals
A spectrum analyzer is an instrument that measures the magnitude of an input signal over a range in the frequency domain. The primary use is to measure the power of the spectrum of known and unknown signals. On top of that, spectrum analyzers often have tools and features for deeper signal analysis suitable for different application domains.
What is spectrum?
A Spectrum is a graphical representation of the signal as a function of a dependent variable.
A sound spectrum, for example, is a representation of a sound – usually a short sample of a sound – in terms of the amount of vibration at each individual frequency. It is usually presented as a graph of either power or pressure as a function of frequency. The power or pressure is usually measured in decibels and the frequency is measured in vibrations per second (or hertz, abbreviation Hz) or thousands of vibrations per second (kilohertz, abbreviation kHz).
What do spectrum analyzers do?
Spectrum analyzers are used in various applications to image and represent acquired data in a way that helps users to extract more information and hereby achieve better understanding.
Spectrum Analyzers for sound, noise, and vibration data are used in many industries as the main tool to succeed with e.g.:
Rotating Machine Diagnostics and Health Condition Monitoring,
Noise Surveillance,
Structural Dynamics and Modal Testing,
Sound Quality Classification and Room Acoustics,
as well as many other jobs.
Spectrum analyzers are often built of a series of hardware and software components as sketched below. Together the components enable an analysis of spectral data and the usage of tools and features that varies depending on which spectrum analyzer is used.
Learn more:
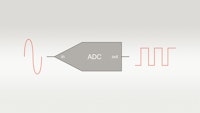
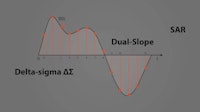
A Data Acquisition device (DAQ) will acquire analog input data over time, in the time domain. Analog time data are converted to digital time data by an ADC (Analog-to-Digital Converter). The ADC adds together all sensor observations into discrete time intervals with a time length defined by the ADC Sample Rate.
In spectrum analyzers data are transformed from the time domain to the frequency domain in which data characteristics of interest are split into individual spectral lines. Instead of having the data represented over time, spectrum analyzers process time data blocks and produce a spectrum per block. The individual spectral lines in the spectrum represent the different independent characteristics of the measured data, which altogether adds up to the signal shape of the related time data block.
Domain transformations and following analysis operations are normally done by application software on a computer that is connected to the DAQ device. The user can then operate the spectrum analyzer from this computer.
The domain to use to get the best representation of interesting data characteristics depends on what is measured. Spectrum analyzers for sound, noise and vibration data collectors normally represent the data in the frequency domain and the rotation domain.
How are spectrum analyzers used?
Bearing defects
Bearing defects are one of the most common failures that occur in rotating equipment. These defects can often be prevented by Machine Condition Monitoring Solutions which use spectrum analyzers.
A typical rolling bearing consists of the following components:
Rolling elements - balls/rollers
Cage
Inner race
Outer race
Many different types of defects can arise in bearings that can cause critical failures, and therefore Rotating Machine Diagnostics and Health Monitoring are used to help prevent such cases from happening. By vibration monitoring and analyzing vibration signals related to bearings it becomes possible to react and take action before any severe damage occurs.
Outer race defects
Outer race-bearing defects are normally characterized in the frequency spectrum by the presence of multiple peaks (harmonics) of the BPFO - Ball Pass Frequency on the Outer race.
BPFO is represented by the number of passes the balls make over a defective point on the outer race in the period the shaft makes one turn multiplied by the shaft rotating frequency.
The equation to calculate the BPFO is the following:
Where Nb is the number of rolling elements, Bd is Ball diameter, Pd is Pitch diameter and β is contact angle. Typical BPFO frequency is from 2-15 x RPM.
By measuring the RPM rotation speed and calculating the BPFO, then the related harmonic frequencies can be determined. If such harmonics begin to arise and increase in magnitude, then it can be a sign of a bearing outer race defect.
Many sound and vibration spectrum analyzers have monitoring tools that help the user with e.g. setting warning and alarm levels at such harmonic frequencies.
Learn more:
Example: sound quality tuning
A sound quality measurement is an indispensable tool for successful sound engineering. It addresses the need to empirically evaluate how sound produced by different kinds of machines are perceived by the human ear.
The auditory perception of sound is a subjective matter, but objective measurement and testing are possible by applying a range of Sound Quality parameters or metrics. Spectrum analyzers are used in the process of determining these sound quality parameters.
One Sound quality parameter is e.g. sharpness. Sharpness corresponds to the sensation of a sharp, painful, high-frequency sound and is the comparison of the amount of high-frequency energy to the total energy. The sharpness algorithm can among other things use a 1/3-octave band spectrum to determine the sharpness metric.
Higher frequency components in the signal generally result in higher sharpness measurements.
Learn more:
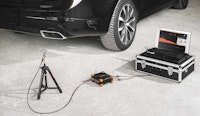
Dewesoft sound level meter online training
Other sound quality parameters of interest could e.g. loudness, noise criterion, and articulation index - all define the sound quality in different aspects.
By using sound quality metrics it becomes more clear which component parts should be redesigned, configured differently, or tuned in order to improve the overall sound experience and to make it more appealing to users.
What is spectrum analysis?
Many extra tools and features are often added on top of the fundamental spectrum analyzer to cover its full potential, but the basic mechanism used is the data domain transformation.
When a spectrum analyzer is used for sound and vibration analysis the acquired time data x(t)is transformed from the time domain to another domain. This other domain is very often the frequency domain X(f), but it can also be e.g. the rotation/order domain.
In the time domain, if a sensor observes multiple events happening at the same time, this will be represented over time as one signal, shaped by the content of the different event components.
But, when time data is transformed to the frequency domain, the data content is divided into sections with respect to the frequency of occurrence. Hereby different characteristics contained in the data are plotted at different spectral lines based on their rate of periodic movement.
Normally spectrum analyzers use FFT (Fast Fourier Transform) to get to the frequency representation from the time representation.
A Fourier series can be visualized as a series of sinusoidal components that together form the shape of the time data. The magnitude phase of a Fourier series can e.g. be represented like this:
where A0 is a DC offset component and Ak is the magnitude of the peak amplitude of the individual sinusoidal components, which can also be seen as weighted contributions to the shape of x(t). fk is the frequency component and k is the phase offset.
An example is given. Sound pressure-time data from a tuning fork will be illustrated by a 440 Hz sinusoidal function in the time domain. In the frequency domain, it will be illustrated by a magnitude peak on a frequency axis at the spectral line that represents the 440 Hz tuning fork frequency component.
Another example. When you snap your fingers, the sound pressure-time data will illustrate the time function shaped to reproduce that transient sound. This shape contains multiple sinusoidal components with different period times since such sound can not be produced by a single pure tone.
In a frequency spectrum, the multiple sinusoidal components will be illustrated at different spectral lines on a frequency axis with respect to their period of time. Related spectral line magnitudes will indicate the weight of the individual sinusoidal components represented in the sound pressure signal.
How to select a spectrum analyzer?
Multi-channel spectrum analyzers for sound, vibration, and e.g. power measurements are available in several form factors, including:
Benchtop vibration analyzers
Rack-mounting vibration analyzers
Handheld or portable vibration analyzers
When considering the best instrument form factor for a test, your decision will depend on the specific test setup and questions like these.
How many sensors are required?
Depending on the test scenarios the optimal number of channels to choose is different. For some tests, a reduced number of sensor channels might work, but often this comes hand in hand with extra test time required, and that has to be considered.
Will the test setup change frequently?
It can be a time-consuming task to connect, set up, and manage a multi-channel measurement system, but proper instrument systems will have a set of features to simplify that task - e.g. TEDS sensor support and automatic sensor reconfiguration tools in the application software.
Are the instruments sometimes split into multiple test setups?
If a bigger measurement system should be able to be split into smaller independent systems, then it might be necessary to choose multiple instruments that can be configured individually or work together.
Is the test setup location stationary?
If the test setup is designed to stay at the same location then it might be beneficial with rack-mounted instruments and a PC running the application software in an office. But, if the test setup is moved regularly, a portable solution might be the best.
Must the instruments withstand harsh environments?
Many test scenarios will happen under harsh environments involving e.g. extreme temperatures, water spray or submersion, high shock, and extreme vibrations. In such cases, the instrument's IP (Ingress Protection) rating should be considered.
Check out Dewesoft's rugged, IP67, waterproof vibration, and spectrum analyzers
Which spectrum analyzer is the best for what?
Frequency analysis is used heavily in a broad range of applications including sound, noise, vibration, and e.g. power measurements.
Each application domain has different test setups built to generate and investigate different important events. The measurement setup has to support data acquisition and analysis in ranges that include as many of these observations of interest as possible.
How well a spectrum analyzer supports those application domains is given by a set of specification parameters or requirements for the different hardware and software components that the spectrum analyzer is built upon. Some of these requirements are listed below for the typical components in a spectrum analyzer.
Sensor requirements
Since this article mainly focuses on spectral analysis, sensor requirements will only be mentioned briefly. Some of the sensor requirements of interest are:
TEDS (Transducer Electronic Data Sheet)
Overload Recovery
Sensitivity
Frequency response
Temperature Response
ESD (ElectroStatic Discharge) / RFI (Radio Frequency Interference) Protection
These requirements and many more altogether indicate which sensors are best suited for a given test application.
DAQ device requirements
To select a DAQ device you have to look at different requirements that your measurement application might have. Some of these requirements are:
Number of input/output channels
Sampling rate and bandwidth requirements
Bit resolution
Let's look at each one closely.
Number of channels
While a sound pressure level measurement can be achieved with a single microphone channel, many standards require specific measurement setups that often specify a certain number of sound or vibration sensors that must be used.
Some tests are performed with several hundred or even thousands of sensors, which all have to be acquired and analyzed. When a test requires many channels the price and performance of the measurement equipment can have a great impact on choosing a measurement partner or provider.
The performance of large measurement systems is normally kept in control by distributing the processing load to multiple measurement units that together provide the user with the requested data.
Sample rate and bandwidth
For sound measurements, the range of interest is often 20Hz to 20kHz since this covers the audible range for humans.
For vibration measurements of a car frame, the range of interest could be 10Hz to 3.2kHz. This would cover the most observations of interest such as the frame’s structural dynamics and the vibration behaviour over a speed profile.
For high voltage inverter E-mobility measurements or pyroshock measurements, the range of interest could be up to several MHz, to cover all characteristics that together shape the short transients.
A spectrum analyzer must support a bandwidth covering the range of interest. The system bandwidth is the maximum range on a produced spectrum. For example, if a spectrum analyzer can view and analyze data from 0Hz to 5kHz, then it has a bandwidth of 5kHz.
The bandwidth is related to the sample rate of the ADC in the spectrum analyzer, but it is not the same. The sample rate is the rate at which a new data sample is acquired. For example, a CD is normally recorded with a sample rate of 44.1kHz.
Due to the Nyquist theorem and anti-aliasing filters, the relation between the sample rate and the bandwidth is often set to 2 or 2.56.
Learn more:
Regarding the example with the CD, the bandwidth is then e.g. 44.1kHz / 2.56 = 17.2kHz, which covers nearly the full audible range of sound for most humans. There is often no need to use a higher sample rate since the hearable range is already covered, and a higher sample rate will use more disc space per second of time data.
Bit resolution
Another specification parameter is the bit resolution. Most measured data samples will by nature have different level values if we could describe the levels with 100% precision. The limit of the relative level precision is determined by the bit resolution.
The ADC in Spectrum analyzers used for sound and vibration applications often have a bit resolution between 16 bits and 24 bits.
High bit resolution is often required when acquiring data that has a large dynamic level range, and where at the same time precise level values are important.
Learn more:
Dewesoft offers a variety of industry-leading Data Acquisition systems that will cover most demands regarding sample rate, bit resolution, signal-to-noise ratio, and much more. The DAQ device will work as the hardware part of the spectrum analyzer solution.
Spectrum analyzer software requirements
As mentioned earlier, many extra tools and features are often added on top of the fundamental spectrum analyzer to cover its full potential. For many customers, some of those features are mandatory parts in the spectrum analyzer, for them to be able to perform the desired jobs.
Cursors and markers with level readouts
The ability for the user to interact with displays and graphs, e.g. zoom in and out, pinpoint areas of interest, and add different marker types is appreciated by the majority of users. For example, having a spectrum representing a sound signal, then harmonic cursor values might be part of the desired test results. Or when doing a modal test then damping markers are often included in the analysis.
Learn more:
Reference curves and tolerance curves
Reference- and tolerance curves can be used as a data validation tool, where the data are displayed in comparison to some expected reference, or displayed together with some tolerance figure. It can also provide trigger outputs used for alarms and events.
Learn more:
3D spectrogram
Multiple spectra represented over a profile enable the ability to follow trends and overview spectral changes with respect to some profile. For example, in automotive applications, a variety of measured signals are often analyzed over a speed profile.
Learn more:
Mathematical operations
Further extended analysis capabilities can be provided by math operations. The math operations can be all from a simple value scaling to the more complex user-defined math formulas. Some application software also supports math scripting and has the derived math data available as virtual channel outputs.
Learn more:
Events and alarms
Enables the spectrum analyzer to notify the user if the data analysis is triggering on some user-defined settings. It is also used as a test shutdown mechanism, and for sending alarm information to 3rd party devices.
Learn more:
Automatic reporting
The ability to generate reports while or after running tests. Some application software includes reporting tools where the user can create and modify reports containing graphs, metrics, metadata, and other desired information.
Cross-analysis with 3rd party measurement sources
Cross-data analyses from multiple sources are often valued when a spectrum analyzer is retrieving data from other sources in addition to data from the sensors directly connected to the DAQ device.
For example, to see temperature data from another acquisition source in relation to data measured by the spectrum analyzer.
Learn more:
Data management
Data management features determine how the measured and analyzed data are e.g. stored, converted, imported, exported, and streamed.
Dewesoft provides raw data storing as well as storage into a time-series database. The Dewesoft Historian database can be either located on a local measurement unit or on the remote server or cloud.
Distributed monitoring and analysis
Dividing the analysis of DAQ device channels to multiple PCs that all run the application software. Hereby multiple users can interact and do their own analysis in parallel on the signals provided to their PC.
Learn more:
With a set of such features and years of field experience software applications can be designed to perform more specific jobs that directly guide and help users by addressing the context of the user scenario.
See the different Dewesoft testing applications use cases.
What are the spectrum analyzer applications?
Dewesoft has over the years built a solid signal analysis platform for spectral analysis. It covers most user scenarios regarding data acquisition and analysis of all sorts of signals in the frequency range from 0Hz to several MHz. Some of these scenarios are included in the award-winning software DewesoftX are:
Predictive maintenance and monitoring
Machine health monitoring
Structural tests - Modal analysis, sine processing, FFT analysis
Durability and fatigue test and analysis
Rotating machinery, rotor balancing, torsional analysis
Combustion analysis
Human body vibration tests
Sound power, level, intensity, and quality
Mechanical shock response tests, drop tests
Bearing fault detection
Learn more about Dewesoft vibration signal analyzer applications:
What else are spectrum analyzers used for?
In this article, the main focus has been on how spectrum analyzers are heavily used to analyze acquired sound, noise, and vibration data. But other variants of spectrum analyzers are used for other types of measurements as well. Below are some examples of use.
Telecommunications
In the telecommunication industry Radio Frequency (RF) broadband and transmission tests are performed together with tests on RF components like antennas, cables, and oscillators.
When testing RF equipment the frequency range of interest is normally from MHz to GHz.
When acquiring and analyzing data in the GHz range, a well-established RF converter technique is typically used. The RF converter uses a heterodyning technique that demodulates and shifts the signal frequency range with respect to a tuning frequency (centre frequency).
Hereby, the frequency axis of an RF spectrum will often not start at DC - 0Hz, but instead at a frequency defined by the tuning frequency and by the bandwidth around that.
Chemistry
In the chemical- and pharmaceutical industry spectrum analyzers are used for mass spectroscopy. They produce spectra that represent the ionic content of a measured object, divided into individual spectral lines based on their mass-to-charge ratio. Hereby chemists can easily conclude what the measured object consists of, or if it contains unwanted impurities.
Particle physics
Another example can be found at CERN. When accelerated particles collide and a series of new particles emerge, spectrum analyzers are used to represent data from the particle sensors. They are dividing emerged particles into individual spectral lines based on their mass-energy relation. This way physicists are helped in overviewing the content of emerging particles since the different particle characteristics are separated in the mass-energy domain spectral data.
