


What Is a Strain Gauge Sensor and How Does It Work?

January 29, 2020
In this article we will discuss how you can measure strain and pressure with strain gage sensors, with enough detail so that you will:
See how strain gage sensors work
Learn how strain and pressure measurements are made
Understand how you can incorporate them into your testing
Are you ready to get started? Let’s go!
Introduction to strain gauges
Strain gauge and pressure sensors are widely used in many measurement applications, from static to dynamic. For example, they are commonly used inside load cell sensors for weight measurement, and in certain kinds of accelerometer sensors. Strain gauge sensors are used for measuring:
In short, they are employed for the measurement of forces.
The strain gage is also sometimes called an electrical resistance strain gage, or simply a resistance strain gauge. Gage can also be spelt gauge - this is simply a matter of convention and makes no difference.
But they are also used in highly dynamic measurement applications, where their outputs are fluctuating widely because of the deformation of a mechanical object under test.
Imagine the body panels of an automobile which is being driven rapidly across Belgian blocks at very high speeds. Or being mounted on a drive shaft spinning at thousands of RPMs, and being subjected to tension and torsion as the load on the shaft changes dynamically. There are countless applications for strain gages.
Learning tip: See the Dewesoft Webinar on strain gage measurement with Dave Gallop, Business Development Manager in Dewesoft USA.
Strain and pressure sensors are widely used in many measurement applications, from static to dynamic. During the webinar, you will have a chance to learn everything about Strain Gages - History, Evolution, Fundamentals, and Applications.
The strain gage sensor
The property called “strain” is considered to be the ratio of change in length compared to the original unstressed length of an object.
Strain gage sensors (aka “strain gauge transducers”) can measure this change in length caused by an external force and convert it into an electrical signal, which can then be converted to digital values, displayed, captured and analyzed. This works because a strain gage sensor experiences a change in resistance as it is stretched or compressed.
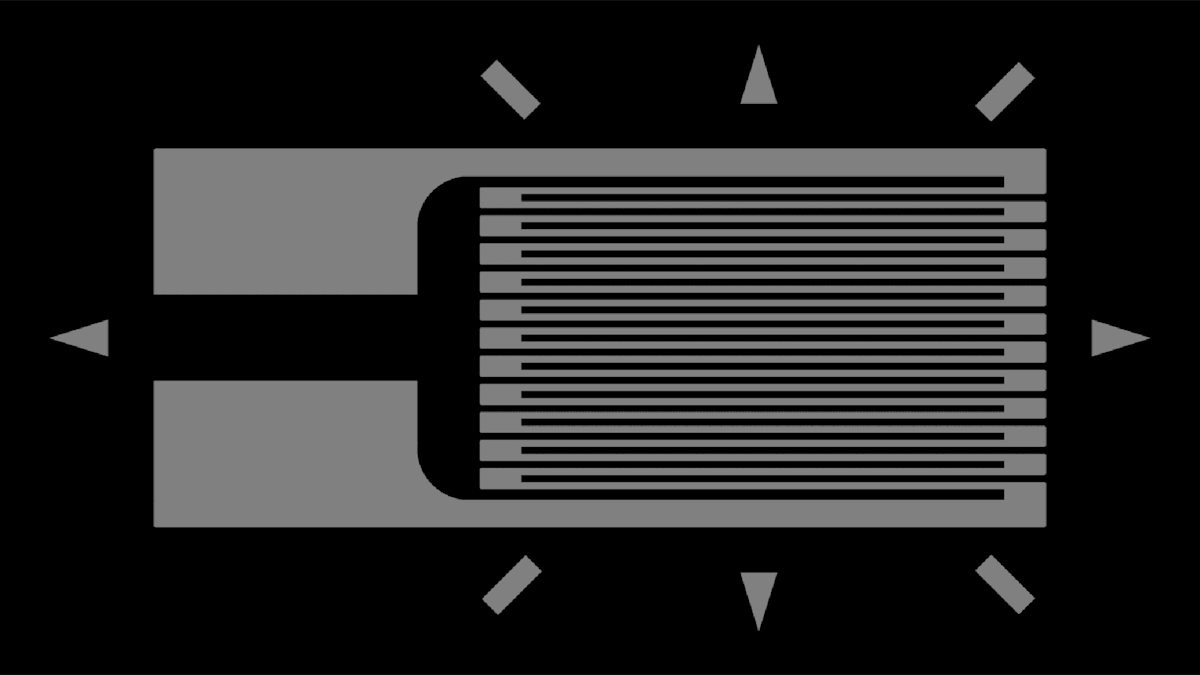
A strain gage (aka “strain gauge”) measures strain by means of a change in resistance. In a single sensor strain gage, a metal foil pattern is mounted on a flexible substrate, which also serves to insulate the metal from the object under test. A current is run through the foil pattern. When the object under test is stressed (i.e., bent or twisted) in the axis parallel with the foil pattern, there is a change in resistance which is proportionate to the amount of deflection.


Wheatstone bridge
When a conductor is stretched, its resistance increases. When it’s compressed, its resistance decreases. This change in resistance can be measured using a Wheatstone bridge.
As shown in the diagram below, a Wheatstone bridge circuit measures an unknown electrical resistance (Rx) by balancing two legs of a bridge circuit, one leg of which has an unknown value. Since the other three resistors have known values, and one of them is also adjustable, the circuit can deduce what the resistance of Rx is at any point in time.

")


When one of the four resistors is being used to make a single-axis measurement, this is what is called a quarter bridge hook-up. The signal conditioner must provide the three missing sensors, and balance the circuit, deducing the resistance value of the sensor in real-time, and converting that resistance to a proper strain measurement (when no current passes through V, the circuit is balanced).
Using two sensors, therefore, is a half-bridge, and measuring with all four sensors is a full-bridge configuration. In the full-bridge diagram above, the sensor's output voltage is measured at C and B, while the excitation voltage is supplied at A and D.
Types of strain gauges sensors
There are strain gages with more than one sensor, which can measure the strain in more than one direction at a time. These are typically referred to as strain gauge rosettes, and they are available in different geometries for different applications.
The most common rosettes offered are the biaxial rosette, where two sensors are mounted at 0° and 90° (perpendicular to each other), and the triaxial rosette, where three gages arranged in a specified pattern, such as 0° - 60° - 120°, or 0° - 45° - 90°.


An engineer explains strain gauge rosettes in this video:
Bridge completion explained
When the signal conditioner provides the missing resistors needed to complete the Wheatstone Bridge circuit, this is referred to as bridge completion. As an example, Dewesoft’s STG series signal conditioners provide this completion and even allow you to select between 120Ω and 350Ω completion resistors.
Control over this completion is done completely via Dewesoft X data acquisition software: there are no physical switches or settings that have to be made. In this case, the signal conditioner actually has the “missing” resistors in the hardware and switches them into the correct place on the circuit based on your setup in the software.
What Is the gauge factor?
When you purchase a strain gage sensor, the package will typically show the GF or gauge factor (or strain factor). This is a number around 2. It is important to know this when setting up the sensor in the software. This factor relates to the change in resistance caused by strain over the native resistance of the sensor, divided by the strain itself. Again, when setting up a sensor using Dewesoft X data acquisition software and a Dewesoft STG series signal conditioner, the Gage Factor can be typed directly into the software, which will do all of the mathematics necessary to ensure perfect measurements.
Resistance change due to temperature - temperature compensation
At this point, you might be wondering about temperature and its effect on the accuracy of these measurements. After all, any time we talk about resistance measurements, the temperature is a factor because it can so easily change the measurement, causing wrong readings. Strain gage sensors are known to have a sensitivity to temperature, which will affect their accuracy unless compensated for.
Temperature variations at the sensor are caused not only by the ambient temperature (imagine one sensor is in the sun, or mounted right onto a running engine, while another one is not) but also by the current that is powering the Wheatstone bridge itself! This is also known as the self-heating phenomenon.
The farther the excitation has to travel, the greater it will need to be, resulting in even more heating up of the sensor by the excitation itself. In addition, lead wire resistance itself may become a factor affecting the measurement, for example, in cases of exceptionally great distances between the sensor and the signal conditioner.
Because of these variables, Dewesoft STG signal conditioners are designed to allow SENSE lines to be connected to the corners of the bridge circuit. These lines allow the signal conditioner to measure the difference between the excitation at the conditioner and at the sensor, and automatically adjust the circuit accordingly, rejecting the error and ensuring accurate and stable readings.
mgae


The dotted lines show that while it is possible to connect the sense lines at the connector, it is preferred to connect at the sensor itself to get the full benefit of this capability.
Internal shunt for strain gage calibration
A shunt is a resistor that is connected across one leg of the Wheatstone bridge circuit, temporarily unbalancing it. This method simulates a given strain, and since the value of the shunt resistor is known (typically 59.88 kΩ), it provides a known offset. The momentary switching in of this shunt cal resistor is often done both at the beginning and at the end of a test so that the measured data can be referenced to it during data analysis. Thus, any baseline shifts which may have occurred across the whole span of a long test can be detected and offset mathematically later on.
Dewesoft STG signal conditioners provide an internal shunt cal resistor, eliminating the need to connect one externally (which also eliminates the need to touch the wiring!). In addition, Dewesoft X DAQ software allows you to engage the shunt cal with an on-screen click. Shunt calibration can be done on a single channel, or on multiple channels at once.
The accuracy of the shunt resistor, and indeed of the resistors within each strain gage sensor or transducer is important because it affects the accuracy of the final readings. Manufacturers like Dewesoft follow best practices when it comes to denoting the accuracy of the resistors, providing a nominal resistance and tolerance specifications. Nominal resistance represents the intended value in ohms, while the tolerance is the maximum possible deviation from the nominal value measured at 25°C.
Best practices for measuring with strain gage sensors
It is considered a best practice to use the lowest excitation voltage that you can, in order to avoid the self-heating phenomenon mentioned earlier. At the same time, it is extremely useful to have a selection of excitation levels to choose from. And it’s important that the excitation lines be isolated just like the signal lines are, to ensure low noise and optimal signal-to-noise ratio of your recorded data.
This is also ensured by the advanced AD converter electronics of all Dewesoft DAQ systems in general, and the DualCoreADC® technology approach of SIRIUS DAQ hardware in particular. And since reducing the length of signal cables is especially important when it comes to strain sensors, the modular nature of all Dewesoft data acquisition systems is a solid advantage in these applications.
Strain and stress theory
What is strain?
A strain is defined as the amount of deformation that an object experiences compared to its original size and shape (the ratio of increase in length compared to its original length). The term strain is typically used to describe the elongation of a section. An object can experience strain as the result of an external force acting upon it.
A strain is a dimensionless quantity and is usually expressed in percentages. Typical measures for strain are less than 2 mm/m for steel and are often expressed in micro-strain units. One microstrain is the strain producing deformation of one part per million. The abbreviation for microstrain is given as µε.
What is stress?
Stress is defined as an applied force per unit area. It usually occurs as a result of an applied force but is often due to the effects of force within a material or within a larger system.
For example, let's imagine a wire that is anchored at the top and hanging down. We apply weights to the end of this wire to pull it down, thus applying a downward force. We can see that in the picture below, where A is the original cross-sectional area of the wire, and L is the original wire length. In this example, the material (wire) experiences stress which is called axial stress.


The units are the same as with pressure because the pressure is the special variation of stress. Stress is a more complex quantity than pressure because it fluctuates with direction and with the surface that it acts on.
We can calculate the stress (σ) by multiplying strain (ε) and Young's modulus (E).
Force equation
Therefore
Given that the elastic modulus (Young's modulus) of steel is 210000 N/mm2 and the cross-section of the sensor is 139 mm2 we get:
What is Young’s modulus?
Young's modulus, also known as the tensile modulus or elastic modulus is a measure of the stiffness of an elastic material and is a quantity used to characterize materials.
It is defined as the ratio of the stress (force per unit area) along an axis over the strain (ratio of deformation over initial length) along that axis in the range of stress which Hooke's law holds.
A material whose Young's modulus value is very high is rigid.
The Young's modulus [E], can be calculated by dividing the tensile stress by the extensional strain in the elastic (initial, linear) portion of the stress-strain curve:
Where:
E is Young's modulus (modulus of elasticity);
F is the force exerted on an object under tension;
A0 is the original cross-sectional area through which the force is applied;
ΔL is the amount by which the length of the object changes;
L0 is the original length of the object.
By the International System of Units, (SI), the unit of Young's modulus is the Pascal (Pa or N/m2 or m−1·kg·s−2). The practical units used are megapascals (MPa or N/mm2) or gigapascals (GPa or kN/mm2).
In the United States customary units, Young's modulus is expressed as pounds per square inch (psi).
A strain is usually expressed in μm/m (micrometer per meter), also known as microstrain, which has the symbol µε. You may also see “mV/V,” which refers to the output in millivolts per volt of excitation. Strain gages need to be excited or driven with a supply voltage in order to provide an output that is proportional to the amount of strain that they are seeing along the measurement axis.
Measuring the modulus of elasticity
The modulus of elasticity and yield stress are two frequent material properties that can be calculated by performing tensile tests with a mechanical testing system.
The procedure of mechanical testing systems is that the selected material is clamped between two grips. The bottom grip is tightened on the surface while the top grip moves up at a certain displacement rate.
The testing system records the force that is needed to stretch the material and the suitable displacement of the grips. Engineers measure the original cross-sectional area of a specimen and the original length between the grips. After that, they are able to calculate stress from the force data and strain from the displacement data. All the data is then used to create stress-strain diagrams as shown in the picture below.
What is Poisson's ratio (ν)?
Poisson's ratio is the negative ratio of the transverse strain to the axial strain (assuming that the axial strain is in the direction of the applied load). This ratio is typically given by the Greek letter v (also written as nu, and pronounced like the word “new”). You can visualize this effect by stretching a rubber band - as you pull its ends farther apart, the width of the band itself shrinks. Most materials exhibit a Poisson's ratio of between 0 and 0.5 ν. Steels typically measure at 0.3 ν, while rubber has is almost 0.5 ν.
Types of stress
1. Normal stress
There are two normal stresses - TENSILE and COMPRESSIVE. Tensile stresses are positive, compressive stresses are negative. Normal stresses arise when tensile or compressive forces act against one another.
In the picture below we can see a tensile load applied to a rectangular solid. The response of a rectangular solid to tensile loads is very dependent on the tensile stiffness and strength properties of the reinforcement fibers since these are far higher than the resin system on its own.


The figure below shows a composite under a compressive load. Here, the adhesive and stiffness properties of the resin system are crucial, as it is the role of the resin to maintain the fibers as straight columns and to prevent them from buckling.


2. Shear stress
The figure below shows a composite experiencing a shear load. This load is trying to slide adjacent layers of fibers over each other. Under shear loads, the resin plays a major role, in transferring the stresses across the composite. For the composite to perform well under shear loads the resin element must not only exhibit good mechanical properties but must also have high adhesion to the reinforcement fiber. The interlaminar shear strength (ILSS) of a composite is often used to indicate this property in a multi-layer composite ('laminate').


Types of strain
1. Axial strain
“Axial strain” refers to how an object stretches or compresses as a result of force along its horizontal axis. It is defined mathematically as axial stress divided by Young’s Modulus.
2. Bending strain (moment strain)
“Bending strain” refers to how an object stretches on one side and contracts on the other due to force applied along its vertical axis. Also known as “moment strain,” bending strain is defined mathematically as the bending stress divided by Young’s Modulus of Elasticity.
3. Shear strain
“Shear Strain” combines the measurements of object deformation along both its horizontal and linear axes. It is defined mathematically as shear stress divided by the modulus of shear stress.
4. Torsional strain
“Torsional strain” refers to the circular force along both the horizontal and vertical axes of the object under test. It is defined mathematically as torsional stress divided by the torsional modulus of elasticity.
5. Compressive Strain
The compressive strain is produced when two equal and opposite forces act to compress an object. When this happens, the length of the object decreases under compressive stress.
What is the relationship between stress and strain?
The simplest way to visualize the relationship between stress and strain by means of a Stress-Strain Curve. You can see in the graphic below that this curve offers some very useful material properties. Stress-Strain Curves are calculated via experiment.


A stress-strain curve is typical of structural steel:
Ultimate strength
Yield strength (yield point)
Rupture
Strain hardening region
Necking region
Apparent stress (F/A0)
Actual stress (F/A)
Dewesoft strain gage measurement signal conditioners
SIRIUS strain gage DAQ measurement modules
SIRIUS data acquisition systems offer the best performance in signal conditioning and take no compromise on the acquired signals. SIRIUS simply brings the best signal conditioning you can buy today. SIRIUS DualCoreADC® technology boosts dual 24-bit delta-sigma AD converters with an anti-aliasing filter on each channel, achieving an astonishing 160 dB of dynamic range in the time and frequency domains. It offers a 200 kS/s sampling rate per channel and up to 8 channels per SIRIUS slice. This is the flagship of the Dewesoft product line - a masterpiece of hardware and software.


SIRIUS DualCoreADC DAQ modules for strain gages
| Module | Basic specs | Comments |
|---|---|---|
| SIRIUS STG1-8 channels per slice | Full bridge Half bridge Quarter bridge 350Ω Quarter bridge 120Ω 3 and 4 wire Ranges up to ±50VAC/DC coupling Shunt 59.88 kΩ, 175kΩ bipolar 1000V isolation | 200 kHz/channel Dual 24-bit Sigma Delta 2W/channel Supports all strain types High input range |
| SIRIUS STGM1-8 channels per slice | Full bridge Half bridge Quarter bridge 350Ω Quarter bridge 120Ω 3 wire Ranges up to ±50VAC/DC coupling Shunt 100 kΩ bipolar 1000V isolation | 200 kHz/channel Dual 24-bit Sigma Delta Low power (1.3 W/channel) Supports all strain types Sensor and amplifier balance |
SIRUS high-density DAQ modules for strain gages
| Module | Basic specs | Comments |
|---|---|---|
| SIRIUS HD STGS 16 channels per slice | Full Half bridge Quarter bridge 350 Ω Quarter bridge 120 Ω 3 wire Ranges up to ±10V100 kΩ 500 V in pairs isolation | 200 kHz/channel 24-bit Sigma Delta Low power Supports all strain types |
SIRIUS high-speed DAQ modules for strain gages
1 MHz 16-bit SAR technology with software-selectable alias-free filtering is the perfect choice for transient recording. Up to 8 channels per SIRIUS module.
| Module | Basic specs | Comments |
|---|---|---|
| SIRIUS HS STGS 1-8 channels per slice | Full bridge Half bridge Quarter bridge 350 Ω Quarter bridge 120 Ω 3, 4 wire Ranges up to ±50V 59.88 kΩ, 175 kΩ bipolar1000 V isolatio n | High speed (1 MS/s) Supports all strain types High input range |
SIRIUS® Modular Technical Specifications
KRYPTON strain gage DAQ measurement modules
The KRYPTON® DAQ systems line is the most rugged and high-performance data acquisition system available today. They combine the power of Dewesoft signal conditioning and software with a powerful EtherCAT® interface, packaged in waterproof and high-impact enclosures.


Key Features:
Distributable - you can locate your data acquisition hardware close to the sensors.
Single cable with up to 100 meters (328 feet) between devices for power, data, and synchronization
Made for extreme environments - IP67, dustproof, waterproof, 100 g shock, and vibration resistant, wide temperature operating range
KRYPTON multichannel strain gage DAQ modules


| Module | Basic specs | Comments |
|---|---|---|
| KRYPTON STG3 or 6 channels | Full Half bridge Quarter bridge 350 Ω Quarter bridge 120 Ω 3 wire 100 kΩ shunt 20 kS/s sample rate Differential isolation voltage | EtherCAT® Interface Supports all strain types, high input range Available with 3 or 6 channels |
KRYPTON single-channel DAQ module for strain gages


| Module | Basic specs | Comments |
|---|---|---|
| KRYPTON ONE STG 1 channel | Full bridge Half bridge Quarter bridge 350 Ω Quarter bridge 120 Ω 3 wire 100 kΩ shunt 40 kS/s sample rate 125 Vrms Ch-GND isolation | EtherCAT® Interface Supports all strain types High input range |
KRYPTON® Technical Specifications
IOLITE DAQ and control systems
IOLITE® DAQ system from Dewesoft is a real-time data acquisition system specifically made for industrial applications. They combine the best of both worlds - data acquisition and control, in an integrated way that other systems cannot match.


Key Features:
DUAL EtherCAT data bus: IOLITE uses two EtherCAT buses in parallel. The primary bus is used for full-speed buffered data acquisition to a computer. The secondary bus is mainly used for real-time data to any third-party control system.
No-compromises Signal Conditioning: IOLITE features high-quality amplifiers that provide great signal quality and up to 20 kHz sampling rate.
Redundant Power Supply: combined with dual EtherCAT® interfaces, this provides maximum system reliability.
Choice of Chassis: IOLITE can be configured in the 19-inch cabinet compatible chassis or in more rugged SIRIUS-like compatible chassis.
Price/Performance Ratio: IOLITE offers a great price/performance ratio and is suitable for test-bed and industrial applications.
| Module | Basic specs | Comments |
|---|---|---|
| IOLITE-6XSTG 6 channels | Full Half bridge Quarter bridge 350 Ω Quarter bridge 120 Ω 3 wire 100 kΩ shunt 20 kS/s sample rate Differential isolation voltage | Supports all strain types High input range |