


How to Perform Condition Monitoring With Dewesoft Condition Monitoring Systems

January 29, 2021
In this article we will discuss how you can perform machine condition monitoring with Dewesoft condition monitoring systems so that you will learn:
See what parameters can be measured
Learn what faults can be detected
Understand in detail the key elements of the Dewesoft MCM solution
Are you ready to get started?
What parameters can be measured and what faults can be detected?
Dewesoft offers a variety of affordable, easy-to-install permanent monitoring solutions for machine condition-based monitoring across a wide range of industrial and rotating machinery, including turbines, motors, gearboxes, pumps, wind generators, hydropower plants, and others. Dewesoft’s solution offers an easy-to-use approach to identifying problems of critical machinery at the right time.


What parameters can we measure and observe?
Temperature monitoring
Vibration monitoring
Strain monitoring
Pressure monitoring
Rotational speed monitoring
Force monitoring
Flow monitoring
Oil condition monitoring
What faults can we detect?
Bearing faults
Overheating
Shaft imbalance
Detached mounting
Gear-tooth failure
Load misalignment
Stator eccentricity
Other machine catastrophic failures
In the next section, we will take a look at the architecture of the overall machine condition monitoring system from Dewesoft.
Learn more:
Dewesoft condition monitoring system architecture
The Dewesoft condition monitoring system consists of these key elements, shown in the following figure:


The machines being monitored (robots, motors, bearings, fans, etc.).
Sensors (vibration sensors (accelerometers, proximity probes), microphones, strain gages, current and temperature sensors, pressure and flow meters, thermography cameras, etc.) are installed onto the machines, and their outputs are connected to the measuring units.
Data acquisition devices collect data from sensors and are available in different formats, from small single-channel count modules to larger-scale multi-channel modules, rack mounting units, etc.
Measurement units (MU) are industrial computers running the DewesoftX Machine Monitoring package. The main role of the measurement unit is to store raw data and perform calculations to send reduced data to the server.
Dewesoft Machine Condition Monitoring Software includes all the features and functionalities of advanced condition monitoring solutions, data communication between measurement units and the database and 3rd party software as well as access possibilities to the real-time data and historical data over PC client and/or web-client interface.
Condition monitoring data acquisition devices overview
It is important to note that all EtherCAT® compatible devices (like IOLITE and KRYPTON) can be connected to the same network, making it possible to build a virtually unlimited channel chain by using a single cable delivering power, synchronization, and data.
The whole EtherCAT chain is synchronized with deterministic time accuracy within 1 us regardless of cable length. EtherCAT devices can be located up to 100 m (328 ft.) apart.
Very often the measuring environment is not a clean room or a pristine laboratory but is instead a factory, paper mill, metals processing mill, and the like, where the temperature varies drastically, and where water, dust, and other elements are present.
Dewesoft offers single-channel and multi-channel EtherCAT connected modules for these environments:
| IP Rating | Temperature Rating | Special Features | |
|---|---|---|---|
| IOLITEr | IP30 | -10 to 50 °C | Dual redundant power supplies |
| IOLITEs | IP40 | -10 to 50 °C | Dual redundant power supplies |
| IOLITE LX | IP40 | -10 to 50 °C | Low-power ARM processor |
| IOLITE modular | IP20 | -20 to 60 °C | DIN rail mounting |
| KRYPTON | IP67 | -40 to +40°C(-40 to +185° F | Shock: Shock: SIST EN 60068-2-27:2009100 g, 6 ms, half-sineRandom Vibration: MIL-STD-202G Method 214A, test condition II-D |


Dewesoft condition monitoring software
The Dewesoft Machine Condition Monitoring software is composed of several components that work either standalone or can be connected together:
Machine Monitoring Software
Historian and OPC UA protocol
Machine Monitoring Client
Monitoring Web Client
Let's look at each of these in detail.
Machine monitoring software
The Dewesoft Machine Monitoring Software package is installed on the measurement unit. It includes all the functionalities and features of advanced machine condition monitoring techniques. It also takes care of data communication between measurement units and the Historian database.
The package includes a rich set of functionalities needed to perform all sorts of machine condition monitoring:
FFT analysis
Order tracking
Torsional and rotational vibration analysis
Envelope detection
Orbit analyzer
Octave-band analysis
Rotor balancing
Bearings database
Data manager
Communication protocol support - OPC UA Server, OPC UA Client, Modbus Slave, Modbus Master, and Siemens S7.
The software is installed on the measurement unit in a fixed configuration (no configuration changes are possible). It also provides data communication between measurement units and the Historian database.
Historian database and OPC UA
Historian provides storage into a time-series database for long-term monitoring or permanent monitoring applications.
Historian is a database service with local and available cloud-based data logging and storage. It provides storage in a time-series database for long-term monitoring applications. It uses the OPC UA protocol for data transfer between DAQ measuring systems that are providing the data. It can also communicate directly to other 3rd party systems like SCADA, ERP, and more.
Before we look deeper, let’s review the meaning behind these important acronyms seen in the picture above.
OPC UA
The OPC Unified Architecture (OPC UA) is a platform-independent machine-to-machine protocol that is at the heart of industrial automation. Dewesoft uses the OPC UA protocol for communication between the measurement units, database, clients, and 3rd party software.
SCADA
Supervisory Control And Data Acquisition (SCADA) is a system that gathers and analyzes real-time data. It involves computers, networked data systems, PLCs, and more. It is used for data monitoring and machine control.
ERP
Enterprise Resource Planning (ERP) is software and other systems that are used to plan and manage manufacturing, supply chain, and other processes of an organization.
CMMS
Computerized maintenance management systems (CMMS) are databases that contain all of the data related to an organization’s maintenance procedures and operations.
Using the Dewesoft condition monitoring system, maintenance and plant engineers can monitor vibration, temperature, inclination, strain, pressure, and other data. The data are all streamed to the Historian database, which can be hosted on a local computer system, local server (intranet), or in a cloud (internet).
The OPC UA standard protocol is supported for data access and integration into Machine Monitoring Software, or SCADA systems, ERPs, or other OPC UA clients.
Historian database and OPC UA capabilities
All the raw data from data acquisition devices are collected and processed by measurement units running the DewesoftX Machine Monitoring software.
Processed data is sent over the TCP/IP network and stored in the time-series database on the local or cloud-based server. Data can be accessed and viewed on the client PC and served to SCADA systems or Cloud Software using standard interfaces such as OPC/UA or XCP to truly support Industry 4.0 applications.

Measurement units can either provide raw data for further display and calculations to the Client PC or in a reduced format to the Historian Database for permanent storage.
InfluxDB time-series database
Data is stored in a state-of-the-art open-source InfluxDB database. InfluxDB is an open-source time-series database developed by InfluxData. It is written in Go (an open-source programming language) and optimized for fast, high-availability storage and retrieval of time series data in fields such as operations monitoring, application metrics, Internet of Things sensor data, and real-time analytics.
Self-hosted or fully managed hosting
Historian service can either be installed locally on the measurement unit, or your local intranet or Dewesoft can provide a fully cloud-managed service. Monthly fees are charged for hosted cloud-managed services, which cover data storage and maintenance.
A truly distributed architecture
The Dewesoft Historian is designed as a distributed software system. Each component can run on a different system if desired:
Measurement Units are instances of DewesoftX (Windows) or Dewesoft RT (Linux, cross-platform) data acquisition software, and use the Dewesoft OPC UA server plugin to communicate with Historian Service.
The Historian database service is the core component of Dewesoft Historian. It handles data transfer between DAQ measurement systems, databases, and clients. The Historian Service and the database typically run on the same server, but this is not a requirement.
Grafana can also run on a different server if needed because it communicates with the database over Secure Hypertext Transfer Protocol (HTTPS).
The Historian Service supports connections of multiple Dewesoft software clients at the same time from different systems over the internet or on the local network.
NTP on each component provides accurate time synchronization for system operation.
Data safety and re-transmit
In case of network failure or downtime, Dewesoft measurement units continue to store the data in the local buffer and will safely transfer the data to the Historian database when the network connection is re-established. There is no risk of losing data because of this redundancy.
Trending and analytics
Historical data can always be recalled and loaded from the Historian database and used for trend analysis as well as for in-depth analysis and root cause identification.
Data retention policy
Engineers can configure how much data is retained in the database, and for how long. Data can be reduced by taking the average of the higher data rate samples and downsampling. Data duration and data rates can be configured using InfluxDB configuration scripts via SQL language.
A Sample default configuration:
(S = sample, therefore S/s = Samples per second)
| Data Rate | Default Duration | Comment |
|---|---|---|
| Raw | 30 days | The original rate at which the channel is written to the database. |
| 10 S/s | 60 days | Raw data is reduced to 10 S/s after days and stored for 60 days. |
| 1 S/s | 90 days | Channels stored at more than 10 S/s are reduced to 10 S/s after 60 days and retained for 90 days. |
| 1 S/m | 360 days | Channels stored at more than 1 S/min are reduced to 1 S/min after 90 days and retained for a year. |
| 1 S/h | Infinite | Data of 1 sample per hour is never deleted. |
Historian applications and case studies
The Dewesoft Historian can be used in many measurements and monitoring applications such as:
Machine condition monitoring
Structural health monitoring (bridge monitoring, high-rise building monitoring, construction site monitoring)
Geotechnical monitoring
Fleet monitoring
Electrical power monitoring
Historian case studies
See Dewesoft condition monitoring solutions in action by reading the following customer case studies:


Accessible from anywhere and anytime
Data stored in the Historian database can be accessed from anywhere in the world and at any time using an instance of the Dewesoft-X-Machine Monitoring client or any standard web browser on any device like a computer, tablet, or smartphone using Dewesoft-X-monitoring Web client.


Machine monitoring client
DewesoftX Machine Monitoring Client enables access to the reduced data stored in the Historian database and raw data stored on the measurement units from a local computer.
The license includes machine monitoring analysis tools on the client preconfigured and ready-to-use. Tools include:
Acceleration, Velocity, and Displacement channels
Spectrum trend 3D Graphs
Continuous and Run-up / Coast-down Monitoring
Frequency Spectrum Machine Elements Identification
Bearing and Gear Analysis
Envelope Detection - Energy and Peak Available
Tracking Filters - Advanced Spectrum Analysis
Octave Band Analysis and
and more


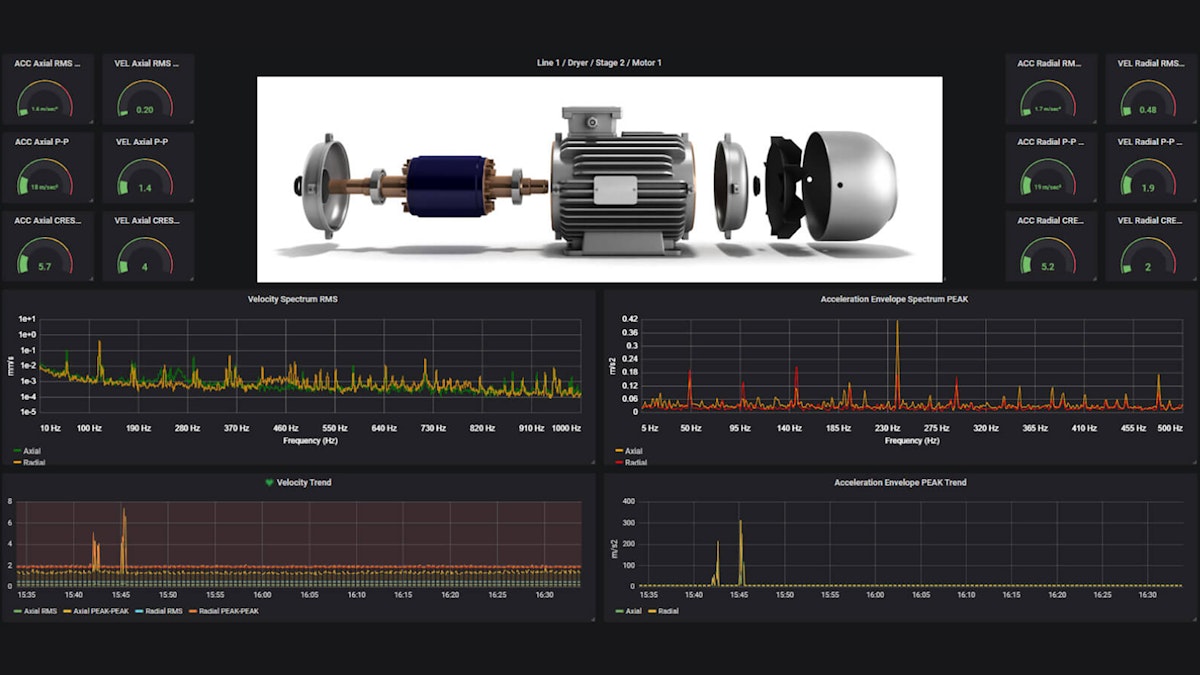
Machine monitoring web client
Monitoring Web Client enables any web client access to the data stored in the Historian database for a real-time and historic overview of monitored channels. It is perfect for a high-level dashboard overview of your monitoring machines.
Dewesoft Grafana Connector enables standard web browsers (Google Chrome, Firefox, Safari, Opera, Microsoft Edge, etc.) access to the database and includes an open-source Grafana open-source project for the visualization of the stored data.
Grafana is multi-platform open-source analytics and interactive visualization web application. It provides charts, graphs, and alerts for the web when connected to supported data sources. It is expandable through a plug-in system. End users can create complex monitoring dashboards using interactive query builders.

Grafana is accessible on any platform - Windows, Linux, Mac OS, etc. It runs on desktop or mobile devices, such as tablets and smartphones. It is an ideal solution for a data dashboard.
Engineers and maintenance personnel can access condition monitoring data from anywhere, using the phone or tablet in their pocket, or back at their desk on a big computer screen.
Live demo: you can check our real-time demo web-client dashboards monitoring the various Dewesoft facilities:
Dewesoft R&D dark room monitoring
In conclusion
Machines break and that’s inevitable. Using condition monitoring systems engineers can accurately predict when this is likely to happen.
With this knowledge, they can move the machine out of production while it’s being repaired or replaced. This prevents most failures and mitigates their impact on production and efficiency.
Using the Dewesoft Machine Conditioning Monitoring system with its advanced data collection capabilities, cross-platform data access, and visualization tools, maintenance engineers are keeping their processes up and running with the greatest possible efficiency and efficacy. This saves time and money, promotes safety, and guards against the unexpected.
Learn more:


