


Correlating Power Measurements with Electromotor Vibration Data

May 30, 2022
The challenge
The rapid evolution of electric vehicles has created a new design, testing, and measuring challenges for engineers. One of the most pressing needs has been in the area of vibration analysis. Engineers have struggled in particular to separate the harmonics coming from the slotting effect (ie., air gap permeance fluctuations due to rotor and stator slots), and harmonics coming from the inverter.
Before 2011, asynchronous motor energy losses were assumed to be 0.5%. Ballpark numbers like that used to be considered ”good enough,” but not anymore - today, they must be measured with far greater accuracy and precision. In fact, today’s asynchronous motors must meet at least the IE2 level of the IEC 60034 standard. Precise measurement of efficiency and energy loss requires the highest possible accuracy across the entire measurement chain.


Unfortunately, automotive test and design engineers faced a brick wall when attempting to make these measurements: how to separate the frequencies caused by the inverter from those caused by the slotting effect? It was a real measuring challenge.
Two different automotive R&D companies with different expertise were presented with this challenge at the same time and decided to work together to solve it. This is the story of how they did it.
French company EOMYS is a leading multiphysics engineering services company, with a special focus on e-mobility, i.e. electric vehicles. They are subject matter experts in analyzing and reducing noise and vibration caused by electromagnetic forces in electrical systems, having worked on more than 150 engineering projects in this area.
Slovenia-based Dewesoft is a leading DAQ (data acquisition) system provider to the automotive market. They were an early innovator in bringing power quality analysis, NVH (noise, vibration, and harshness), order tracking, and acoustic analysis to the world of general-purpose DAQ instruments. They achieved this not just with software, but by tightly integrating high-resolution counter/timing inputs for encoders and RPM sensors with the analog inputs, synchronizing them to better than 1 microsecond, regardless of the sample rate required by the analog sensors.
The project
Initial testing quickly got underway. Figure 2 shows a typical test setup on an Internal Permanent Magnet Synchronous Machine (IPMSM) with 12 stator slots and 4 pole pairs (12s8p). EOMYS used a semi-anechoic chamber to measure motor and casing vibration noise up to 1000 RPM. The goal was to reduce the noise and vibration caused by harmonics induced by the inverter.


After many test runs were conducted, EOMYS and Dewesoft considered how to analyze the data. They tried several methods, each with its own advantages and limitations.
Figure 3 shows an FFT spectrum comparison of a noise and vibration spectrum at 863 RPM, in this example. Measurements like these are useful, but they can’t describe the behavior of a system across its entire RPM operating range.

 without noise reduction (blue); B) with noise reduction (red)")
They also made spectrogram comparisons, as shown in Figure 4. These were also useful but provided only a qualitative comparison.


In order to derive a quantitative comparison of inverter-induced harmonics across the entire operating range of the motor, EOMYS and Dewesoft engineers had to find a better way.
First, in order to better understand the frequency signature of slotting and PWM (pulse width modulation) noise and vibration harmonics, the spectrogram of the motor casing vibration was analyzed, as shown in Figure 5.
The harmonics corresponding to the slotting appear as oblique lines crossing the point 0 Hz / 0 RPM. Their frequencies are expressed in terms of mechanical orders (H8 = 8 times the rotation frequency of the rotor, for instance), depending on the topology of the machine. For an IPMSM with 12 slots and 4 pole pairs (12s8p), the slotting harmonics occur at H8 and its multiples.
The PWM harmonics have a “palm-tree” signature around the PWM carrier frequency fs and its harmonics. The harmonic distribution around fs depends on the motor control strategy that is implemented. In the present case, the carrier frequency \(f_s\) is equal to 3000 Hz, and the harmonics around \(f_s\) are \(f_s \pm 4f_e , f_s \pm 8f_e , f_s \pm 12f_e\), etc.

")
We can see the PWM-related harmonics, but at this point, it was required to do some very time-consuming post analysis in order to extract the relevant information. Changes in rotational speed (RPM) and inverter carrier frequency effect and shift the energy pattern. This makes it difficult to determine general and automated procedures for motor diagnostics.
The engineers theorized that it should be possible to automate the inspection of current and vibration levels coming from the PWM harmonics and began working on that.
By using order analysis it was possible to take the rotational speed variations into account by transforming the data samples per time (time-domain) into samples per rotation (angle domain). FFT spectra based on angle domain data results in Order FFT spectra where the spectral lines are related to the number of sinusoidal periods per rotation – regardless of motor RPM.
Normal order analysis indicates vertical order lines for energy components that are completely related to the rotational speed variations. Figure 6 shows the slotting harmonics with straight vertical order lines across the full RPM range. But what about the energy components that also relate to the inverter carrier frequency? Such components will not be fixed at certain order lines because the carrier frequency doesn’t change with RPM. Also, the PWM components are placed much higher up in frequency which makes them to be found at orders being more than several hundred.

.")
The solution
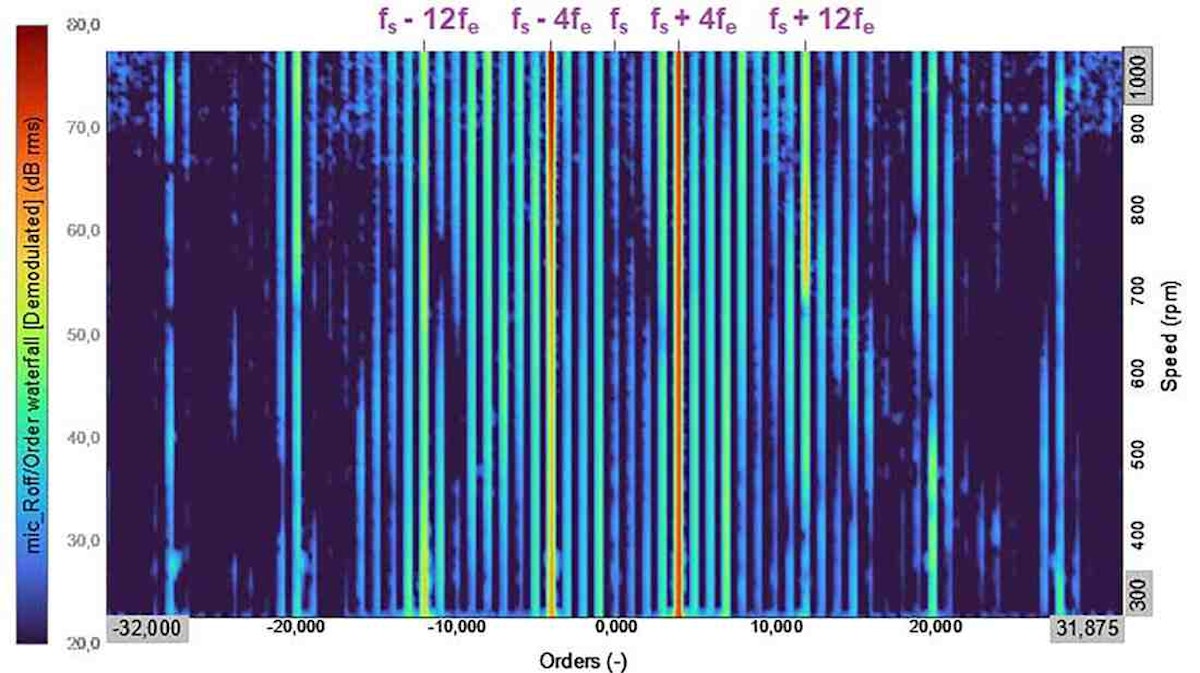
By demodulating the measured time data with respect to the inverter carrier frequency, the frequency offset was shifted to have 0 Hz at the inverter modulation frequency. Order analysis based on this demodulated time data showed vertical order lines for those energy components that related to the rotational speed and that were based on the carrier frequency offset at the same time – the PWM harmonics.
A suitable DAQ platform was required to perform the tests. Dewesoft’s SIRIUS DAQ instrument was selected because it can handle electric motors with up to 12 phases, and it can simultaneously measure mechanical parameters like speed, torque, and deformation. The measurement of additional parameters like vibration, sound level, and temperature is precisely synchronized with the power parameters. The SIRIUS system can also do inverter testing, including the measurement of all I/O configurations for up to 7-phase systems. Fundamental frequencies from 0.5 Hz to 3 kHz can be analyzed, as well as switching frequencies up into the hundreds of kHz.


Normally these kinds of tests require several different instruments to be operated simultaneously. But the team found that a single SIRIUS system could measure everything, with all parameters synchronized. Additional parameters such as GPS position data, temperature, CAN BUS data, and moving images from video cameras could also be added and recorded in sync with the power data.
Running on the hardware was DewesoftX and Order Analysis software. These were used to inspect the PWM flux harmonics that were related to a high rate modulation/carrier frequency \(f_s\).
First, the input sensor channels were selected, and the tacho/frequency source was used to convert data from the time domain to the angle domain.
Next, the demodulation process was enabled, and a fixed or variable carrier frequency was selected based on the fundamental electrical frequency \(f_s\) used by the measured electrical motor. By heterodyning the input time signals, the order FFT results contained the carrier frequency as the 0th order instead of DC, while still being tracked in relation to the tacho source.

In order to inspect the spectral results and harmonic components across the full speed range used, the Binning settings were configured to cover the RPM range from 300 - 1000 RPM, together with the Delta RPM set to 1 RPM which defines the RPM resolution for the waterfall results. This is shown in Figure 8.
Lastly, spectral settings were defined and the relevant harmonic components were selected. Because we had demodulation enabled, the first harmonic component was \(fs+fe\) which is the carrier frequency plus the fundamental flux frequency. In the same way the first negative harmonic related to \(fs−f_e\).
As a result of the demodulated and tracked data, the PWM order components remained fixed at certain order lines, independently of both the rotation speed and variations in the PWM carrier frequency, as shown in Figure 9.

, and noise (bottom). The demodulation carrier frequency was fixed at 3 kHz.")


At this point, EOMYS and Dewesoft engineers had a solution. Using this type of measurement and analysis setup, PWM flux and force harmonics could easily be extracted in an automated way during the measurement. It was also possible to add or adjust the mathematics afterward, during post-acquisition analysis, right inside the same software.
The bottom line: from the noise and vibration PWM spectra and extracted PWM harmonics, it is possible to determine the strength of the PWM generated vibration, and noise levels being correlated to such vibration patterns.
Using this technique, engineers can now easily split up and compare the influences of all such types of harmonic components and see how they relate to each other. They can monitor everything “live” while running the test. This setup reduces testing time and provides both online and offline viewing of the results and all key parameters.
Vibration data can now also be used to validate the coherence between the PWM noise and PWM vibrations. In the same way, electric current data can now be used to validate the coherence of PWM vibrations to both the rotational speed harmonics and to the PWM flux harmonics of the electric current.
The noise harmonics show which vibration frequencies get radiated to the microphone position the most. For example, in an electrical car, some of the PWM vibration harmonics might seem critical, but the design of the car and its interior greatly influence the noise associated with various vibration harmonics. Some may be attenuated, while others will not. PWM vibration harmonics will have peaks at speeds where a given harmonic intersects a structural resonance mode. During these tests, harmonic peaks were not present.
In Figure 10, the most critical PWM harmonic components from the noise measurements are extracted, both with and without noise reduction applied.

![Figure 10. Extracted noise PWM flux harmonics across the measured speed range, together with the sum of the shown harmonic components, [dB, ref 20 micro Pa]](https://www.datocms-assets.com/53444/1668261603-dewesoftx-extracted-noise-pwm-flux-harmonics.jpg?auto=format&fit=max&w=1024 "Figure 10. Extracted noise PWM flux harmonics across the measured speed range, together with the sum of the shown harmonic components, [dB, ref 20 micro Pa]")
Based on the sum of extracted critical PWM harmonics the effect of using the noise and vibration reduction system can be easily investigated. Figure 11 shows the sound pressure level SPL difference between using and not using the noise reduction system.

![Figure 11. This graph shows the difference in sound pressure level [dB] between the sum of relevant PWM force-related noise harmonics with and without using noise reduction.](https://www.datocms-assets.com/53444/1668261614-dewesoftx-difference-in-sound-pressure-level.jpg?auto=format&fit=max&w=1024 "Figure 11. This graph shows the difference in sound pressure level [dB] between the sum of relevant PWM force-related noise harmonics with and without using noise reduction.")
The noise reduction system reduces the SPL by between 1.5 dB and 3.5 dB over the full range of speeds. This reduction was based on the most dominant PWM harmonics around the fundamental electrical switching frequency \(f_s\).
SPL reductions were also seen for other PWM components and around the palm trees at the second, third, and fourth multiples of \(fs\). The equivalent sound pressure levels \(L_{beq}\) measured over the full range of speeds, were reduced by more than 5 dB.
Extracting these PWM harmonics enables a fast and easy process flow for comparing multiple test runs, and makes it possible to determine the relative influence of PWM harmonics compared to overall current, noise, and vibration levels, across the measured speed range.
Extracting PWM harmonics is also a great way to compare and validate simulated models of these kinds of inverter motors.
In DewesoftX software, all extracted harmonic output channels and user-specified marker channels can be used to set up tolerance curves. In addition, alarm limits are active while running tests, providing real-time notification of any condition that engineers want to keep a close eye on.
Finally, the extracted noise and vibration harmonics (related to the PWM force harmonics), can be printed using the built-in report generation tool. Printable on paper or to PDF files, reports contain a description of the test, together with all the graphs shown the same way as they were during the tests.
In addition to making a report, all of the data (including extracted PWM harmonics) can be exported from DewesoftX in a wide variety of data formats. It is also becoming possible to create an automated gateway so that EOMYS Manatee software can import test data directly from DewesoftX. Manatee provides a simple workflow for comparing real test data with simulations.
The bottom line
With Dewesoft measurement equipment EOMYS was able to acquire and analyze all relevant physical quantities such as voltage, current, vibration, and sound, and then perform advanced diagnostics for power quality and not only harmonics related to the engine rotation, but also flux and force harmonics related to the inverter PWM.
All desired metrics and spectral results could be stored, exported, and used for simulation comparison and report generation. The automation of the report generation process proved to be a huge time-saver and increased productivity dramatically. While testing, all metrics and spectral results could be monitored live with defined tolerance curves and alarm levels, and all data including alarm triggers could be streamed to third-party systems.
The motor manufacturer was pleased not only with the data but with the fact that only a single DAQ platform needed to be used. The importance of correlating power measurements with electromotor vibration data is on the rise. New techniques and technologies to perform them in a more efficient and automated way are being developed by industry leaders like EOMYS and Dewesoft to meet the demands of the electric vehicle market.