


Vibration-Based Health Monitoring of Gearboxes on Offshore Crew Transfer Vessel
Casper Aaskov Drangsfeldt, PhD
July 9, 2025
As offshore wind farms grow, maintaining the vessels that support them becomes increasingly vital. This study focuses on monitoring gearbox health aboard a Crew Transfer Vessel using vibration-based structural health monitoring. A long-term Dewesoft-based system captures critical data, enabling predictive maintenance and ensuring vessel reliability in harsh marine conditions.
The offshore wind sector is expanding rapidly, but maintaining offshore turbines remains challenging due to their remote locations and harsh weather conditions. Crew Transfer Vessels (CTVs) are essential for transporting technicians and cargo to these offshore locations. Specially designed for speed and agility, CTVs can perform swift manoeuvres and reach high speeds..
To enable the safe and efficient transfer of technicians to the turbines, the bows of the CTVs are designed to push against the turbine structures, maintaining a stationary position. However, this position is compromised when waves exceed a certain height, a condition that occurs frequently, making transfers unsafe. As a result, operators often have to cancel trips due to unfavorable weather conditions.
During favorable conditions, the demand for CTV operations increases. This extensive use causes the key components of the CTV, particularly the gearboxes between the main engines and propellers, to deteriorate beyond normal expectations. A condition-based maintenance strategy is a viable solution to ensure CTV availability, enabled through Vibration-Based Structural Health Monitoring (VBSHM).
Vibration-based structural health monitoring (VBSHM)
While the PhD research project aims to develop a robust VBSHM system targeting the gearboxes, a sufficient database is crucial. Therefore, I launched a long-term monitoring campaign using a Dewesoft data acquisition system.
The goal of the monitoring campaign is to measure the vibrational response of the gearboxes under seasonal changes and operational variability, and ideally also during the progression of deterioration in the gearboxes. To capture this, I scheduled the monitoring campaign to last at least one year and preferably even longer. To this end, the campaign has been ongoing for approximately ten months.


The key concept of Structural Health Monitoring (SHM) is to continuously collect and analyze data from sensors mounted on a structure to detect deviations from an established reference state. Identifying such anomalies can indicate potential damage, enabling early diagnosis before it reaches a critical level. However, fluctuating operational and environmental conditions can alter the reference state, making damage detection more difficult. To achieve a robust and reliable SHM system, it is essential to account for this variability.
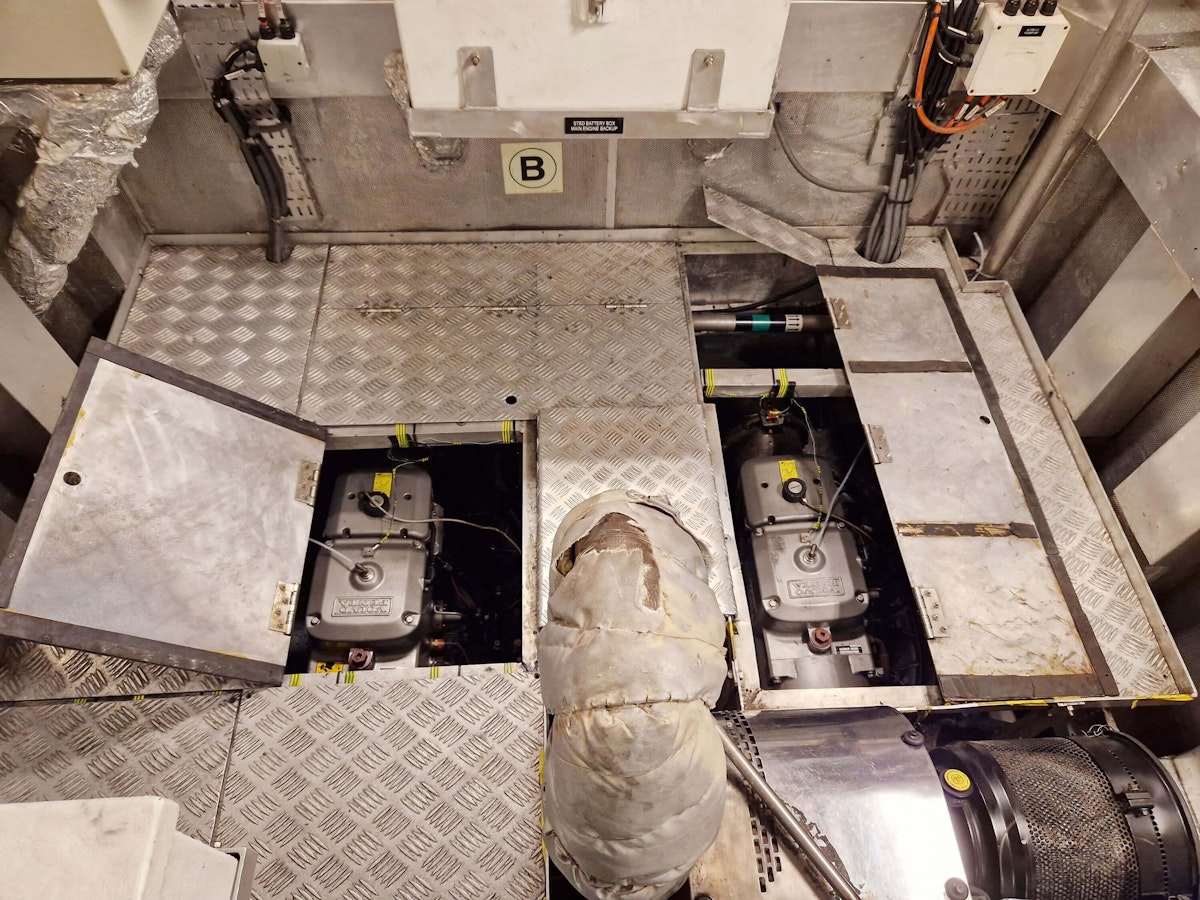
This variability requires collecting sensor data under a wide range of environmental and operational conditions. To that end, a data acquisition system specifically designed for long-term monitoring was installed on a CTV in July 2024 and continues to collect data actively. The CTV is a catamaran with two main engines + gearboxes in each hull. The measuring campaign focuses solely on the two gearboxes in one of the hulls due to financial constraints.
The data acquisition system and sensors
I had to consider several parameters when selecting a suitable data acquisition system. One of the most important is identifying the required sensor types and their corresponding specifications. In this case, I selected three types of sensors: Accelerometers to measure the vibrational response, temperature sensors to measure the ambient temperature around the accelerometer, and a gyroscope to measure the movement of the CTV.
Piezo-electric three-axis accelerometers: I chose Piezo-electric three-axis accelerometers (MMF KS943B100) to measure the vibrational response, one mounted on each of the two gearboxes (Figure 3). These sensors met three requirements. First, the operating temperature range of the sensor is wider than the expected operating temperature range. Second, the measurement range of the sensor is 60g (positive/negative), where the expected range is 50g (positive/negative). Third, the frequency bandwidth is wider than the gearboxes' expected frequency content during operation.
K-type thermocouple temperature sensor: To measure the ambient temperature near each accelerometer, I selected a K-type thermocouple temperature sensor (Figure 3). These are available at an acceptable price level and can measure in a temperature range that exceeds that of the accelerometer.
DS-GYRO1 inertial measurement unit : The movement of the CTV during operation I measured using the DS-GYRO1, a MEMS-based Inertial Measurement Unit (IMU) (Figure 4), which is sufficient for measuring vessel movement in terms of acceleration range and frequency bandwidth.
Next, I required a data acquisition unit to collect data from the accelerometers and temperature sensor, while synchronizing the timestamps of the DS-GYRO1 sensor. Here, I chose the DEWE-43A, a versatile 8-channel USB data acquisition system (Figure 5).
This unit is highly capable of collecting the sensor data with a suitable sampling rate while synchronizing the data from the DS-GYRO1. Furthermore, the eight digital channels and two CAN bus lines remain unused and available for expansion if needed. I placed the DEWE-43A inside a custom-made box, along with additional hardware (Figure 5), which is further detailed in the following section.


The setup onboard the CTV
The sensors, both accelerometers and the DS-GYRO1, are mounted using a special epoxy adhesive that maintains its strength at temperatures up to approximately 150 °C. In comparison, the surface temperature of the gearboxes typically remains below 50-60 °C. When hardened, the adhesive is assumed not to introduce notable damping. All wiring connections are secured with Loctite 243 to prevent loosening over time.
Lastly, I securely fastened all cables to the frame structure within the engine room to avoid vibration-induced movement and to ensure they do not obstruct any tasks carried out by the crew. The temperature sensors are attached close to each accelerometer, as seen in Figure 3.
The DEWE-43A unit is placed inside a plastic box with a lid, together with the additional hardware. The extra hardware comprises an Uninterruptible Power Supply (UPS), a laptop computer, and an external 16TB hard disk. The UPS unit mitigates power losses when the CTV switches between shore power and the generator, and vice versa.
The computer is running DewesoftX while storing the acquired data on the external hard disk. Both are mounted on foam to limit the influence of external vibrations. The plastic box is equipped with a small fan to ventilate the interior during operation, as shown in Figure 6.


DewesoftX setup
In the DewesoftX data acquisition and signal processing software, I can easily specify the settings for both storage options and sensors. First, the settings for the DEWE-43A unit, including the accelerometers and temperature sensors, are configured.
The accelerometers measure the vibrational response of the gearboxes, where the frequency signatures of internal bearings and gears are essential features. Therefore, the sampling frequency must be at least twice the highest expected frequency component, by the Nyquist sampling theorem.
Preferably, I set the sampling frequency even higher, as multiple harmonics of the gearmesh frequency may also be relevant. However, an excessively high sampling frequency can lead to large volumes of stored data. Consequently, I set the sampling frequency for the accelerometers to 5000 Hz. Lastly, I added the calibrated sensitivities of each axis of the accelerometers accordingly, as shown in Figure 7.
The sampling frequency for the two temperature sensors is set relatively low, 10 Hz, as temperature changes occur gradually due to the high thermal inertia of the gearboxes and the surroundings.
I set the sampling frequency of the DS-GYRO1 to 50 Hz. This frequency is more than sufficient to measure the ship’s movement. However, this movement is not stationary, which is why any Discrete Fourier Transform (DFT) must be of a short period where stationarity can be assumed. Therefore, the sampling rate is considered sufficient without storing an excessive amount of data.


The CTV does not operate around the clock. Typically, the CTV leaves port in the morning and returns in the evening. Furthermore, if the weather conditions are unfavorable, the CTV stays in port. In these periods, the engines are not running. Therefore, it is undesirable to have the data acquisition running when the engines are off. I implemented this setting in the DewesoftX software through triggers.
In this case, the software calculates the average acceleration measured by the two accelerometers in the vertical direction (see Figure 8), which it applies as a trigger for data acquisition.


I used the calculated average acceleration in the vertical direction to set the start and stop triggers. If the value exceeds 0.5m/s², the data acquisition will start with a pre-time of 10 seconds. When the value decreases to less than 0.5 m/s², data acquisition stops with a post-time of 10 seconds, as shown in Figure 9.
Otherwise, I specified the storage to store directly on the external hard disk. Every 15 minutes, the software creates a new file on the external hard disk. This storage minimizes data loss in the event of data acquisition or computer malfunctions. Figure 9 shows these settings.


Once I have specified the data acquisition in the DewesoftX software, the software is ready to collect data. Once it meets the trigger requirement, the software will start collecting data until it reaches the stop trigger conditions.
The memory of the external hard disk allows the data acquisition to run for many months. However, I regularly checked the system to ensure everything was running as expected. Additionally, I extracted data from the external hard disk during the inspection.
The measurements
During the inspection of the data acquisition system, I extracted the data from the external hard disk. This allowed me to analyze some of the data. This analysis helps determine if the system is running as expected.
The raw time series from the two accelerometers are shown in Figure 10 for approximately five hours, along with the data from the two temperature sensors. Additionally, Figure 10 displays the heading, pitch, and roll measured by the gyroscope. The figure shows that every channel in the system delivers a reasonable output.


The DewesoftX software also enables easy access to FFT analysis over time. The analysis of the frequency content enables a practical assessment of the data quality. In the FFT analysis, frequency signatures from the mechanical system, such as the gears and rotational speed, should be dominant (see Figure 11), where a variety of frequency peaks are visible. If there were any loose connections to the sensor or any other issues, the signal would have been mostly noise, with any frequency peaks absent.


Monitoring campaign challenges
During the monitoring campaign, I identified several challenges during the regular inspections of the system. These challenges have interrupted data acquisition, resulting in sections of continuous sampling. Although periods of operation have been unmeasured by the system, this does not compromise the usability of the available data. The challenges met so far are:
Occasional computer rebooting: The computer has been rebooting occasionally despite all settings to avoid this. The computer used is a regular laptop, whereas a dedicated computer for the sole purpose of data collection would be preferable.
Squished connections: The USB connections from DEWE-43A and DS-GYRO1 to the computer have been subjected to slight movement during operations, resulting in disconnection from the computer on a couple of occasions. Currently, the laptop is secured in place with foam pads to eliminate extensive vibration.
Failing mounts: The sensor mount, which utilizes special epoxy glue, has failed on a couple of occasions.
Damaged sensor cable: A maintenance task near the sensor and cable damaged the sensor cable.
Damaged accelerometer: A maintenance task also once damaged one of the accelerometers.
I addressed each challenge as soon as I identified it; however, I acknowledge that these challenges will likely persist when I deploy a data acquisition system in an operational environment. Therefore, I emphasize that regular inspections are essential.
Conclusions
The monitoring campaign has been ongoing for approximately 10 months, using Dewesoft products in combination with the DewesoftX software. The usability of both the hardware and software enabled easy setup, with a wide range of settings that I could quickly configure.
Although several challenges have arisen during the campaign, these issues were unrelated to the Dewesoft products. Additionally, the DewesoftX software offers accessible analysis tools, including FFT analysis, which facilitate a quick evaluation of the collected data before applying more advanced methods. For the PhD research, the data are exported from DewesoftX software to MATLAB files, as MATLAB is the preferred programming language for the research project.
Overall, the Dewesoft hardware and software facilitate the process of establishing an extensive database, capturing the vibrational response of the gearboxes across various operational and environmental conditions.
Thanks
The PhD project has been generously funded by Aktieselskabet Dampskibsselskabet Orient's Fond. Additionally, support from the Mads Clausen Foundation enabled me to purchase the data acquisition system. Finally, this research would not have been possible without the support of the shipping company MHO-Co, which has provided access to its vessels and shared its valuable knowledge.