


Dynamic Characterization and Structural Monitoring of a Highway Viaduct Using Operational Modal Analysis (OMA)
Giorgio Sforza
Essebi
September 5, 2024
The Serra Cazzola viaduct is the primary structure of the renewals along the state highway SS 640 in the Italian Agrigento province. Essebi installed a structural monitoring system and verified its electrical functionality. The acquired data corresponded to engineering references. Multiple operational modal analyses with synchronous data from 85 Dewesoft IOLITE 3XMEMS triaxial accelerometers for 255 channels allow dynamic characterization of the viaduct.
Introduction
The acronym SS indicates the Italian national network of state highways. The Italian joint-stock company Anas S.p.A. deals with road infrastructure and manages and maintains this network of state roads and toll-free motorways of national interest.
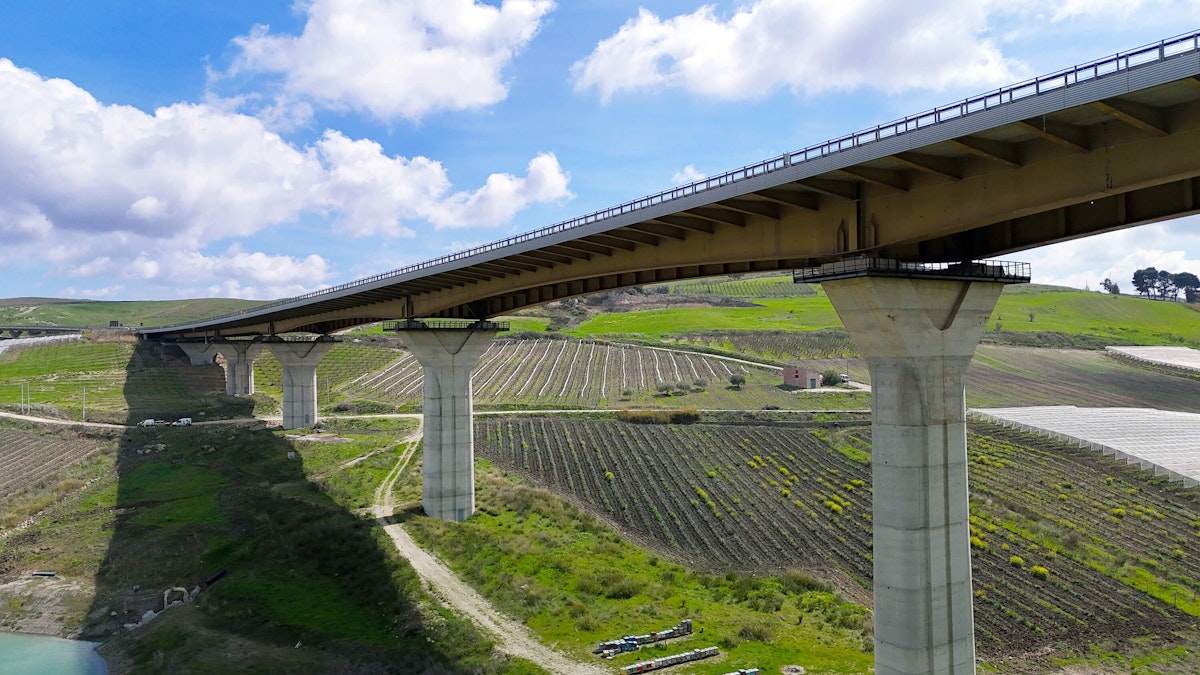
The Serra Cazzola viaduct on state highway SS640 is a continuous multi-span scheme with a double carriageway deck. The structure has a total length of 980 m, a central span of 120 m, a width of 26.50 m, and a maximum height of 70 m. The steel-concrete composite deck comprises two steel girders with cantilevered composite cross beams supporting the concrete slab.
Since 1992, Essebi has been operating in the structural engineering services sector with specific expertise in implementing static or dynamic monitoring systems for civil structures and architectural works. The company also conducts general diagnostic activities on reinforced and pre-stressed concrete, steel, masonry, and wood products with predominantly non-destructive tests and instrumentation.
The Serra Cazzola project - the story
It all began in the spring of 2021 with Essebi's first contact with two Sicilian construction companies, SCS and IGC, legally constituted in a Temporary Association of Enterprises (ATI). The association had won a vital framework contract with Anas S.p.A. to construct a series of monitoring plants, mainly dynamic systems, in two Italian islands: Sicily and Sardinia.
Consequently, Essebi signed a contract to supply and install a series of dynamic monitoring plants on the two Italian islands, one in Serra Cazzola in the province of Agrigento and the other near Cagliari. We concentrated on the first of the two, proposing a different solution than the consolidated concept.
A change in the philosophical approach to monitoring architecture had already begun. The so-called granular solution was becoming increasingly popular; many accelerometer modules cascaded with onboard electronics along the plant, unlike the classic solution, with multiple analog transducers connected to multi-channel acquisition systems.
Essebi contributed strongly, in close contact with the Anas central technical management, to analyze the functionality and reliability of similar solutions already implemented.
Introducing the new and almost unknown E-g-meter, the forerunner of the now widely established IOLITE-3xMEMS, we presented examples: the Navetta bridge in Parma, some motorway overpasses in northern Italy, some post office buildings in Cascia and Rieti and, above all to illustrate the overall philosophy of the system, the Foro Highway Viaduct in Abruzzo.
In short, Anas was now onboard, and we signed the contracts with ATI. We just had to start with the construction of the first plant. Then, there was a stony silence around the relationship with the ATI. In the first months of the following year, we understood that an anti-mafia interdiction was in place by the Prefecture of Palermo against one of the two ATI companies.
Anas inevitably revoked the assignment, leaving Essebi hanging with a handful of flies. The ordeal continued throughout 2022, in which various fallacious relationship proposals with many companies or consortia should replace the forbidden grouping.


At the end of 2022, the SQM Stable Consortium expressed its interest in taking over from the banned ATI in the Framework Contract with Anas for monitoring bridges and viaducts in Sicily and Sardinia. A relationship was immediately born with the ICC (Ingegneria Colombrita Costruzioni) as an engineering branch of the Consortium.
The parties signed the new contract in June, and after some delays, we began the installation in October and completed it in December. By the end of 2023, we performed the electrical functionality testing, stored some batches of data, and did some modal analyses, which gave excellent results.
Problems related to the electrical substation have shut down the plant for several months. As soon as the power supply is back, the last part of the program can be activated. This part includes making the Edge computer data usable following interoperability standards provided in the original Framework Agreement.
The viaduct location
Bypassing an older section of state highway SS 640 that descended into the valley, the Serra Cazzola viaduct, Italy's newest high-level bridge, opened in 2014 near Canicattì in Sicily. The bridge represents one of the main works of the route of Porto Empedocle, which connects Agrigento to Caltanissetta.
The state highway SS 640 passes through the famous archaeological site "The Valley of the Temples," recently recognized by UNESCO as an asset of global interest. The highway has been renamed "The Writers' Road" in honor of the itinerary that retraces the places lived and loved by Sicilian writers, such as Luigi Pirandello, Leonardo Sciascia, Tomasi di Lampedusa, and Andrea Camilleri, and those described in their novels.


The viaduct is nestled in a significant orographic depression, allowing easy crossing, and is, therefore, subject to substantial natural windiness through a considerable Venturi effect. Its length, close to 1000 m, and the maximum height from the valley floor, which in the central part reaches 70 m, required particular attention in both the structural solution and the construction techniques.
The considerable height of the piers, in particular, required the search for a solution with large spans and a single deck containing the two road lanes to give the structure a character of unity and lightness.
To achieve greater transparency and assimilate the structure into the environmental context, an increasing span length ranging from 55 m to 120 m follows the height from the valley floor. The applied construction technique defines the dimensions of the single spans. Engineers have also studied the pile-deck assembly in depth to minimize disturbance to the splendid natural setting into which the viaduct plunges.
The viaduct structures
In its basic structural arrangement, the viaduct comprises a continuous beam deck, with interruptions only at the ends and abutments and constrained in multiple hyperstatic schemes at the eleven piles. It has twelve spans of partial lengths, 55 m, 70 m, 3x90 m, 120 m, 3x90 m, 2x70 m, and 55 m, for a total length of 980 m.
The overall width of the deck, equal to 26,50 m, is made up of two road carriageways of 10,50 m - each divided into two lanes of 3,75 m and two shoulders of 1,75 and 1,25 m, respectively, and two side sidewalks of 1,50 m and 2,50 m of the central traffic island.
The deck has a composite steel-concrete section and comprises two double-T metal beams placed at a distance of 12.50 m and double-T crosspieces extra-dosed and projecting at an interval of approximately 4 m. A reinforced concrete slab with a thickness of 25 cm lies over them. The metal carpentry is entirely welded and painted.


Figure 3 shows the cross sections of the essential structural elements and how the deck section varies with the longitudinal abscissa to constitute parabolic segments with variable resistance and a maximum moment corresponding with the supports.


The two longitudinal beams have a constant height of 2,90 m on the external spans of 55 and 70 m and variable with a parabolic law on the spans of 90 m and the central one of 120 m. The central span's height varies from 3.00 m (L/40) in the center to 5,50 m (L/22) on the supports.
The current crosspieces' heights vary from 1,60 to 1,79 m in the central part and from 0,40 to 1,60 m in the cantilevered part. To cope with platband stability, the crosspieces in the main spans for a stretch of approximately 25 m across the supports have a height increased by approximately 60 cm compared to the current section.
In correspondence with the supports, the crosspieces and uprights transfer the horizontal actions of wind or earthquake to the supports and, therefore, to the substructures. The pier uprights are made with 3+3 plates arranged symmetrically concerning the core at a distance between centers of 0,40 m to guarantee the correct transfer of the constraint reactions to the deck, even in longitudinal thermal excursions. The beams are stiffened at the crosspieces by T-struts welded to the webs and girder flanges.
The slab is on floor panels, made with optimized casting sequences based on the execution of the span segments before straddling the supports to prevent slab cracking during the construction phases. The slab connections to the steel carpentry are "Nelson" type pegs.
The piers have a height varying from 13 to 58 m. They comprise a shaft with a hollow section, linearly variable in the transversal direction, and pier caps with a variable section and curved connection, capable of carrying out the widening necessary to accommodate the deck's supports. Engineers paid particular attention to defining the shape of the piers, particularly their caps, due to the considerable dimensions needed for the deck type.


The foundations are rafts on 16-20-25 piles Ø 1500 and are 30-35-40 m long.
The abutments have a C-section and are the seats of seismic restraints. In shoulder S1, holding the fixed supports, the engineers positioned four double-acting elastic retaining devices of 4000 KN. In shoulder S2, with the sliding supports, four double-acting elastic devices of 4000 KN coupled with shock transmitters allow "slow" deformations of the deck, e.g., shrinkage or thermal excursions, but not "fast" movements induced by the earthquake.
The retainers are connected to the gravel wall by steel bars fixed to two plates opposite the wall. The foundations consist of rafts on 40 Ø 1200 cm piles, 20 m deep on S1 and 25 m on S2.
The need for monitoring
Much of Italy’s infrastructure is now old, dating back to the period of the economic boom that developed immediately after the Second World War. Various reasons, such as those linked to
inappropriate implementation of maintenance programs,
dealing with significant seismicity almost everywhere, and not least
recent failures, some catastrophic, affecting multiple viaducts,
have recently pushed many infrastructure managers to take the path of preventive inspections, controls, and monitoring.
As national manager of state roads, Anas moved in advance of the much more extensive "Mille Ponti" (English: Thousand Bridges) program, promulgating framework contracts with many construction companies. In addition to the maintenance works, as an improvement aspect, these had to include creating bridge monitoring systems to evaluate the dynamic behavior and, consequently, the state and level of conservation.
One such project is the “Framework Agreement for the supply and installation of instrumentation for the structural monitoring of works of art for the regions of Sicily and Sardinia.” Here, the Serra Cazzola viaduct is a prominent element of the SS 640 from Agrigento to Caltanissetta.
The monitoring installation
ICC installed the monitoring plant in early October 2023 on behalf of Anas under the supervision of Essebi. It lasted until the beginning of December.

We installed panels on the edge of the bridge, between the guard rail and the external protection railing, on the side facing Agrigento. These panels correspond to the six PCs used to manage the six branches of the system. Each panel alternates with the underlying bridge supports, but only the odd supports are affected.
We positioned all acceleration and temperature transducers at the intrados, affecting all the spans, using a by-bridge. A by-bridge is a particular type of aerial platform suitable for interventions under bridges, with the "negative" arm climbing over the bridge from top to bottom.
The by-bridge operation from above forced a partial interruption of the overlying circulation, and traffic alternated directions in a single lane - initially the right and subsequently the left for the entire duration of the activities.


We installed 85 of the 89 accelerometer modules and kept four as spares for possible replacement interventions during service. Most of them, 71 to be precise, are IOLITE 3xMEMS with low protection from external agents and therefore require the use of protective metal boxes; ten are IOLITE 3xMEMS of the waterproof type, and the remaining four are old E-g-meters, which also needs a protection box. The four left as spares are the latest-generation waterproof ones.
Whether equipped with a protective box or free of any frills, we constantly screwed the modules onto metal waiting plates with studs, positioned like a template, previously attached to the metal elements with nails fired with a particular gun. For those mounted flat on the head of the piers, we fixed the metal plate to the concrete with chemical anchors.
All the deck accelerometer modules - six for each of the twelve making up the viaduct - were installed in the centerline and at two-three-quarters on the two girders symmetrically concerning the longitudinal axis, externally, under the overhanging bracket, at approximately 70 cm from the overlying footwell (predella).
The pier accelerometric modules, one for each pile, were installed flat on the upper surfaces of their pulvinus. The pulvinus is a structural, architectural element in the shape of a truncated pyramid, with the trimmer base resting on a column and the more extensive base supporting the impost of a rafter.
We also located twelve temperature sensors - microchip Analog Devices - along the various spans and reporting, in pairs of two to six MonoDAQ UX, each installed on the plant’s six interlocking panels. As far as possible, we protected all Ethernet and PoE power cables throughout the system with anti-rodent corrugated tubes.


The critical point of the system remains its exposure to lightning phenomena. The location, the nature, and the type of the structure certainly play an adverse role. The only mitigating intervention was to provide surge arresters and relays within the six electrical panels. Lightning from various points of the deck directed towards the ground through the piles could cause unpreventable and uncontrollable effects.
The measurement chain
For each of the six local branches that comprise the monitoring system, an average of 14 accelerometer modules - only one of them has 15 - connect in cascade with an Ethernet network on a LAN cable starting from the reference PC in an in-out configuration. In addition to the PoE (Power over Ethernet) inside the panel, another is immediately after the module beyond the seventh module.
To measure the accelerations, we use IOLITE 3xMEMS accelerometer modules in the configurations that have occurred in these three years, as detailed above. Due to the continuation of the activities, the original Dewesoft batch was cannibalized for other small applications, resulting in reinstatements with devices that were in line with the current state of the art.
In its substantial configuration, the IOLITE 3xMEMS is an accelerometer module with an effective transducer on three axes. It is affected by a spectral noise, which in the worst case - the z-axis concerning its position - does not exceed 25 µg/Hz.
We name IOLITE 3xMEMS a module because it carries all the electronics necessary to amplify, digitize, and synchronize the signal and has a sensitive measurement element. In short, it is a conditioned instrument capable of conveying a digitized and synchronous signal on an Ethernet-type LAN network.
There are two temperature transducers for each of the sub-installations. These comprise a digital integrated circuit chip from Analog Devices (AD592CNZ with precision equal to 0.5°C), which is fundamental for standardizing the results deriving from dynamic characterizations carried out at different periods of the year. The transducers are at designated points and connected with analog cabling to the MonoDAQ UX acquisition systems in the six electrical panels.


List of all hardware and software
85 Dewesoft IOLITE 3xMEMS - triaxial MEMS accelerometers
Six MonoDAQ U-X modules - multifunctional USB data acquisition (DAQ) devices
12 temperature transducers
Six personal computers
Simcenter Testlab - software add-in for Operational Modal Analysis
The system architecture
The monitoring system includes 85 triaxial accelerometers, which we distributed as follows:
two accelerometers on the ground to measure the input ground motion and the PGA;
eleven sensors in a centred position at the top of each pile, and
There are 72 (12x6) accelerometers on the web of the composite deck’s two steel girders—note that each span has six sensors at midspan and quarter spans, respectively.
Figure 11 depicts sub-system no. 2, its reference starting from the direction identified by Agrigento and the control panel corresponding with pier 3.


The distances between the accelerometric modules are consistently below 40 m. The modules do not require additional hardware elements to boost the signal.
The six PCs, which control the six subsystems, are connected with a network cable to make them work synchronously. PC no. 3 works as a master, UCL according to Anas terminology - and, for this reason, has an Intel Core i5 processor. The remaining five PCs play a slave role and have a less powerful Intel Celeron J900 processor.


Currently, we manage the system using routers with SIM cards, which allow remote connection for each of them, for example, via AnyDesk or TeamViewer. The master PC (UCL), however, is already wired to a further PC (Edge) and performs much more due to the many processes it implements. It will subsequently act as the sole interface with the Manager (Anas) and as a remote terminal.
Synchrony
Efficient synchrony of accelerometric acquisitions is mandatory when the monitoring system's purpose is to execute modal analyses—we must determine the ensuing modal shapes with good definitions.
For the individual branches, using the EtherCAT protocol typical of the IOLITE architecture with MEMS accelerometers in series guarantees synchronicity within a few microseconds. However, this so-called “local” synchronicity is insufficient as the viaduct consists of a continuous beam scheme for its entire longitude, with only two joints at the ends - evaluating its overall behavior is fundamental.
The synchronicity between the six branches, which constitute the six sub-systems, cannot be overlooked and must be the best possible, compatible with the typical frequencies at stake. We based this “global” synchrony on the Network Time Protocol (NTP) protocol, which granted a significant improvement starting from the Windows Server 16 and Windows 10 versions.
Under reasonable operating conditions, the system achieves accuracies of the order of a millisecond, or even higher, more than suitable for the typical frequencies of the structure investigated. As it turns out, these assume little significance for values higher than 3 Hz.
We want to be excessively cautious, referring to the synchronicity of 5ms. The maximum error in the phase angle for the maximum frequencies relating to the phenomenon is considered not to exceed 5.4°, a value we regard as more than acceptable.


To complete the above, we accomplish acquisitions by placing an EtherCAT Junction module for GPS synchronization on the six local networks between the first PoE and the first accelerometric module. This way, we avoided using NTP synchrony at the global system level and resorted to a more accurate and rigorous approach. So far, the results, which are certainly affected by operational shortcomings, could be more exact.
Experimental modal analysis
A prolonged commissioning activity was first carried out to verify the electrical functionality, in terms of correct connections of all the transducers making up the measurement chain and the software functionality, using all the tools available in the DewesoftX. We carried out this verification with the mere control of the various wave trains generated by vehicular transit and by examining the unity of the resulting frequencies.
Even though we have no theoretical data available - and here, despite the year of construction in this millennium, we cannot understand why the designer of the viaduct himself does not have any dynamic theoretical evaluation available - for a natural comparison, the experimental dynamic analysis was considered the means of choice for verifying the all-round functionality of the implemented monitoring system. As a theoretical model is not available for comparison, the numerical frequency values could be more indicative. However, the same no longer applies to the modal shapes, which demonstrate the work's quality through their appearance and softness.
Due to the difficulty of energizing the viaduct with harmonic and impulsive external forcing, we defined a reference for the operational modal analysis. Such references, i.e., of the output-only type, are standard for large civil engineering structures with no available input, in which power cross-spectrums replace the classic transfer functions.
In particular, the Polymax extraction algorithm, present within the Siemens Simcenter TestLab Operational Modal Analysis software, was used. It operates in the frequency domain as a poly-referenced version of the Least-Squares Complex Frequency-domain (LSCF) method developed in the time domain.
| Mode | Frequency [Hz] | Damping [%] | MPC [%] | MPD [°] | Scatter |
|---|---|---|---|---|---|
| 1 | 0,63 | 1,23 | 99,85 | 2,28 | low |
| 2 | 0,77 | 2,61 | 99,80 | 2,68 | low |
| 3 | 0,86 | 2,43 | 99,01 | 6,75 | low |
| 4 | 0,89 | 1,44 | 96,46 | 13,54 | low |
| 5 | 1,15 | 1,37 | 97,83 | 9,43 | low |
| 6 | 1,56 | 0,9 | 98,85 | 5,36 | low |
| 7 | 2,86 | 0,65 | 99,83 | 2,44 | low |
In line with its particular slenderness and streamlined shape, the viaduct has a decidedly soft behavior, vibrating at low frequencies. The most significant ones are all below 3 Hz. For all modes, the damping percentages are low, at 1%, as is to happen for a metal structure. Exceptions are the first flexural mode in the vertical plane (mode 2 in the table) and the first torsional mode (mode 3 in the table), for which the value equals approximately 2,5%.
Table 1 also shows the Modal Phase Collinearity (MPC), a modal quantity that measures the complexity of a mode shape vector, and the Mean Phase Deviation (MPD), a weighted mean of the phase deviations of the individual mode shape components from the mean phase parameters—the first high and the second low, as they demonstrate actual shapes.
The power cross-spectrum diagram shown in Figure 14, depicted in terms of the stabilization diagram, confirms the table data regarding the concentration of frequencies on low values.


Figures 15, 16, 17, and 18 show the first four modal shapes. The first mode intercepted at 0,63 Hz is flexural with a transversal trend.


The second is undoubtedly the most significant, representing the first flexural mode in the vertical plane.


The third mode at 0,86 Hz is torsional. The usual trend is accentuated in the central area and tends to attenuate towards the shoulders.


The fourth mode at 0,89 Hz, with its classic inverted curvature trend and flexed in the center of the rafter, represents a second transversal bending.


Note how the first four natural frequencies of the viaduct have frequencies well below 1 Hz and are all included in a range lower than 0.3 Hz.
At 1,15 Hz, we find the deck’s first longitudinal rigid mode, while at 1,56 Hz and 2,86 Hz, there is an upper transverse mode and the second flexural mode on the vertical plane.
The Modal Assurance Criterion (MAC) analysis determines the similarity of two mode shapes. If you compare a mode shape to itself, the MAC value should be one or 100%. The MAC value between two modes is essentially the normalized dot product of the complex modal vector, which includes both amplitude and phase at each common node (i.e., points). This MAC value can also be considered the square of the correlation between two modal vectors.
Ideally, each mode should be uniquely observed and have a different shape than the other modes. Therefore, along the diagonal, every mode is identical to itself, and, in theory, non-self-relative modes off the diagonal should be linearly independent, and their MAC should be close to zero - see Figure 19. On the left, we refer to the first 18 modes, all within 3,5 Hz, and on the right, to the first seven, which we consider most significant, as analyzed above in Table 1.


Conclusions
Our dynamic characterization of the viaduct using OMA, with its multitude of measurement points and vast data, sets a high structural monitoring standard. Despite its challenges, the project is a significant milestone, marking Dewesoft's intense penetration of the civil engineering market and Italian infrastructure.
The monitoring system at the Serra Cazzola viaduct is undoubtedly one of the largest ever built in terms of size and number of synchronous transducers. The system aims at an SHM project as part of an extensive national control plan for bridges and viaducts. In this case, the OMA investigation, allowing an adequate experimental modal characterization, is to be understood as a kick-off for many other future maintenance projects to check the so-called sensitive dynamic parameters.
The monitoring system has been created with all the necessary features to provide durability and reliability of operation. For this reason, the modular solution can open up to future extensions, improvements, and variations. Among other things, the architectural solution adopted, together with the selected particular instrumentation, allowed installations with a low use rate of lifting machinery at a high daily cost rate - by-bridge handling.
For the dimensions involved and the number of transducers used in a structural organism without any continuity solution, the investigation and the parameters' congruity are significant elements in validating the installation.
Last but not least, it is challenging to guarantee the synchronization of acquisitions when the dimensions of the artifact become significant. The operational methods implemented to carry out the activities are peculiar and decisive but constitute a starting point for similar solutions.
The EtherCAT protocol in the six constituent branches guarantees synchronicity but must also be reflected in their overall behavior to have a single system to refer to. In this case, we compared two approaches, one in a certain sense innovative and more refined based on GPS methodologies, and the other more traditional anchored to NTP standards, which, although increasingly performing, could give rise to some doubts.
This second method surprisingly provided excellent results, thanks to the constitutive softness and slowness of the artifact at hand and the consequent low frequencies involved. At the same time, the first, although intrinsically more performing, could not be used in the best possible way due to practical difficulties.