


Validation of Structural Model Parameters of a Sailing Boat
Edoardo Finamore and Niccolò Fantini, Mechanical Engineering students
POLIMI Sailing Team, Politecnico di Milano
August 27, 2024
A valid Finite Element Analysis (FEA) is crucial when designing structures. To enhance the reliability of structural health assessments, the Polimi Sailing Team proposes numerical model validation through strain gauge measurements. The team performed material tests on strong yet light composite materials, presenting challenges like delamination and matrix cracking. With Dewesoft data acquisition, the team characterized the material properties and found a solution to optimize the structural integrity of boat components, balancing detail and computational cost.
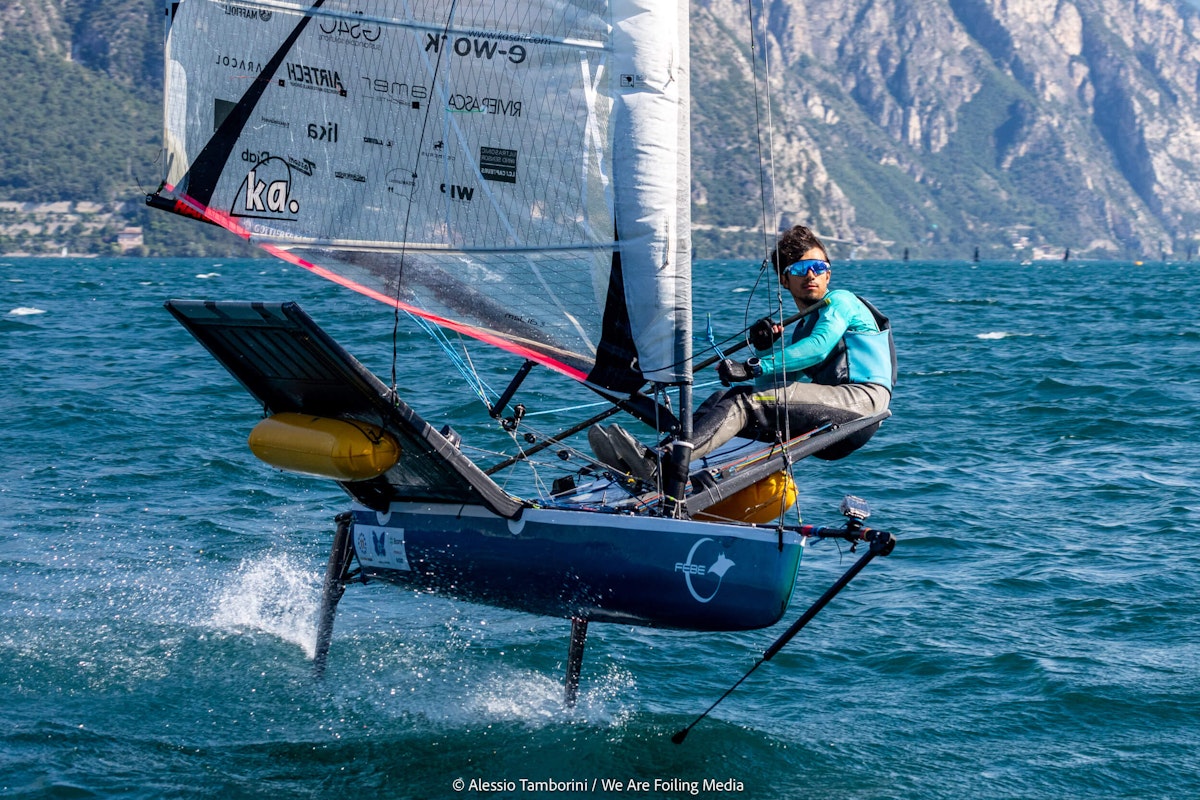
The Polimi Sailing Team is an academic student entity affiliated with the Politecnico di Milano, the most prominent Italian scientific-technological university training engineers, architects, and industrial designers. The team, composed of students dedicated to designing and constructing innovative boats, regularly participates in international competitions. There, Polimi Sailing Team tests its creations against teams from universities worldwide, focusing on the sustainability and efficiency of "Moth" type boats.
Engineers value composite materials for their high strength-to-weight ratio but face challenges in detecting complex failure modes like delamination and matrix cracking. These materials are crucial in the structural dimensioning phase, managed through Finite Element Analysis (FEA).
This analysis is essential for optimizing the strength and weight of components without compromising their structural integrity during actual use. It is vital to achieve an optimal balance between the detail of the finite element model and the computational cost - a balance only reachable through appropriate approximations.
Developing a high-quality FE model requires material datasheets that accurately reflect the production processes. These ensure the consideration of critical variables, including the operator's technical competence. Moreover, a rigorous validation procedure comparing theoretical predictions with actual experimental results is indispensable to ensure the reliability of an FE model.
Experimental modal analysis compares vibration modes predicted by numerical analyses with those obtained from experimental tests on the actual structure, representing a practical approach for dynamically validating the FE model.


With this methodology, the Polimi Sailing Team enhances the performance and sustainability of its boats. It contributes to developing advanced naval technologies with applications well beyond student competitions.
Our experiment proposes a complete characterization of the material thanks to tensile tests.
We analyzed experimental data acquired from strain gauges to validate numerical models of the structure. We deployed a specific test rig to perform both these static tests. In particular, a basalt fiber-based crossbar is the subject of the analysis, as it is one of the most essential structural parts of the boat due to the high dynamics of loading conditions during operation.


The total cost of the test bench was meager. We repurposed an old laboratory table, drilling four holes to accommodate D12 screws and bolts to realize a joint similar to the one present on the boat.
Additionally, we used old pulleys salvaged from decommissioned boats and a large sheet of plywood. The only expensive component of our test bench was the strain gauge acquisition system, generously sponsored by Dewesoft, to whom we extend our gratitude.
Material characterization
The material used
We used a sandwich of recyclable materials to produce the crossbars. Basalt fiber is a natural fiber obtained directly from the melting and extrusion of basalt. Its mechanical properties distinguish it, making it superior to glass fiber and a sustainable alternative to carbon fiber. We applied Divinycell PR 200, made of up to 45% post-consumer PET and thermoplastic resin for infusion processes (Elium). We can recover the original materials thanks to the thermochemical process of pyrolysis.
The specimen fabrication
Laminated basalt on a glass surface ensured a smooth finish on our specimens. Minimizing the use of consumables, we manufactured all specimens in a single infusion process. The geometry and procedure for the tests were performed according to ASTM standards D3039 for 0° and 90° types and D3518 for +-45° types.
ASTM International, formerly known as the American Society for Testing and Materials, is a standards organization that develops and publishes technical international standards for a wide range of materials, products, systems, and services.
ASTM D3039: Standard Test Method for Tensile Properties of Polymer Matrix Composite Materials - widely used for determining the tensile properties of composite materials
ASTM D3518, Standard Test Method for In-Plane Shear Response of Polymer Matrix Composite Materials by Tensile Test of a ±45° Laminate - designed to measure the in-plane shear response of polymer matrix composite materials reinforced by high-modulus fibers


Analysis of tensile test results
Due to some logistical issues, the number of specimens was different than expected. However, we still obtained consistent results, as seen from the overlaid graphs where the variation in results is negligible. From the tests, we were able to derive the following material data:


The only curves that show some differences are those of the specimens at 45°, but we made a few observations.
Firstly, there is a plastic phase, which is typically absent in composites. This plastic phase is likely due to the thermoplastic nature of our resin, which degraded during the tensile test due to friction, resulting in an internal temperature rise. Therefore, we considered only the initial phase of those curves, where the two specimens differ slightly.
| Test 90° | E2 [Mpa] | Ten Stress Transv Dir [Mpa] | Test 0° | E1 [Mpa] | Tens Stress Fiber Dir [Mpa] | Test 45° | Shear Strength [Mpa] |
|---|---|---|---|---|---|---|---|
| n°1 | 13470 | 16.7 | n°1 | 39608 | 874 | n°1 | 19 |
| n°2 | 15072 | 17.08 | n°2 | 39111 | 839 | n°2 | 19 |
| n°3 | 13523 | 16.85 | n°3 | 39062 | 802 | ||
| n°4 | 15701 | 17.14 |
Finite element model of the structure
The analyzed structure
The analyzed structure is one of the most stressed parts of the boat. It supports the skipper throughout the race and must bear the weight without bending excessively. To improve our boat's ecological footprint, we switched from wings made of carbon fiber and fiberglass, the solution adopted last year, to a solution composed of two crossbars made of basalt fiber and core.


Crossbar production
The wing design was done with easy manufacturing in mind, allowing the production of the entire wing to without molds. To achieve this, we split the wings into two components: the crossbars and the trampolines.
We manufactured the crossbar by cutting the core from a 70mm thick sheet of Divinycell PR 200, cutting with a hand-held router following a thin plywood pattern. After obtaining the final outline, all the edges were sanded and filed to get the required fillets. The point was to ease the skin layup and avoid sharp edges detrimental to composite materials.


Manufacturing the composite layup for the crossbars proved challenging due to its complexity and the number of plies that make up the part. First, each ply was cut by hand using a paper template. Second, because the unidirectional plies above and below would fall if just posed on the core, we had to glue them on using Airtac, an Airtech spray glue.
For the outermost ply wrapped around the crossbar, glue wasn’t sufficient to hold the skin in place; therefore, we decided to fix it using drawing pins that would remain on during infusion and be part of the finished component.


The complex geometry challenged us to obtain a good resin flow and keep the plies in position during the infusion. We used a mesh combined with two separate spiral injection lines on the entire crossbar length for the upper and lower sides. The applied Peel Ply eliminates local resin build-ups around the component.


The particular shape allowed the manufacturing of two crossbars during a single infusion, reducing consumables associated with production, such as peel-ply, mesh, vacuum bag, vacuum lines, and residual resin in tubes.


Static analysis
A finite element model (FEM) was used to determine the thickness and the number of layers necessary to ensure that the crossbar could withstand the stresses exerted by the skipper. To remain conservative, we analyzed the scenario as if a single crossbar bore all the stresses and modeled the support on the hull as rigid, thus transferring all the load onto the crossbar.
In addition to the detailed analysis of individual components, we also analyzed the structure. This comprehensive assessment confirmed that, according to the FEM simulations, the structure would have withstood the applied stresses.
For the FEM analyses, solid elements were employed for the inner core due to their thickness, which made shell modeling unsuitable, while we used shell elements for the composite layers. The boundary conditions included fixed support at the base of the crossbar and an applied downward force of 800N at the end.
We utilized the Galileo-Rankine and Tsai-Hill criteria to evaluate material stresses:
Galileo-Rankine Criterion for the Core: This criterion, suitable for brittle materials, combines the maximum tensile and compressive stresses to evaluate failure. The formula used is:
is the material tensile strength, is the compression strength, and are the principal stresses.
Tsai-Hill Criterion for Fibers: This criterion is for anisotropic materials like composites. It evaluates the combined stresses in the material to predict failure based on the interaction of different stress components. The formula is:
Where and are the principal stresses, and is the shear stress.
We used an iterative approach to define the lamination sequence, evaluating the main combinations of unidirectional and twill fibers. At the end of this process, the results obtained from the FEM analysis of the crossbar indicated a safety factor of 1.14 for the skins and a safety factor of 3.4 for the core. Therefore, based on the FEM, damage is expected when the load exceeds 90 kg.


The experimental setup
We designed a test rig for performing static analysis. The crossbar is hinged to the ground to resemble the boat's real mechanical constraint.


For the static analysis, the test rig is composed of the following elements:
We applied eight strain gauges to the most critical sections from a stress and strain point of view (see Figure 12). The adopted sensors are three wires and 350 Ω longitudinal strain gauges.
We applied a static load to the top of the crossbar and measured the load using a dynamometer. An 8-channel SIRIUS-8xSTG, a high-channel distributable data acquisition system provided by Dewesoft, enabled us to measure with the strain gauges—see Figure 13.
We could export Dewesoft data files (DXD) into DewesoftX software, which can receive and analyze data from many sensors. In this particular application, the strain gauge results processed through the software provide a time-averaged deformation, which we compared to the expected values from FEM models.


The crossbar undergoes two tests since the structure consists of two cantilever beams. We performed the tests gradually: the static load is applied in incremental steps (steps of 10kg in the first experiment ranging from 10kg to 90 kg and steps of 5kg in the second experiment ranging from 80 to 105kg).
In addition, a protection grid prevents chips from hurting people in case of a sudden and fragile structure break.
FEM validation through strain gauges
To validate the data from the FEM analyses, we placed eight strain gauges on the crossbar at the positions shown in the photo and one on a steel plate at the point of load application to verify the actual load on the deck. The eight strain gauges were placed in corresponding positions, meaning 1 and 2 are in the same positions but on the opposite sides of 3 and 4, similarly 5 and 6 with 7 and 8.
Thanks to Dewesoft, we used their 8-input data logger and thus decided not to use the strain gauge in position number 8 to make room for the one used to assess the load. However, we also encountered problems with that gauge, so we only analyzed the strain gauges on the crossbar from positions 1 to 7. We then extracted the results from these strain gauges and from the FEM and compared them.


The acquisition system averaged the strain gauge data over 30 seconds, as the values obtained from the strain gauges were not constant over time. The inconsistency is likely due to the elongation under load of the pulley ropes used to apply loads exceeding 30 kg. For example, the graph below shows the data from strain gauge six at 80.


After analyzing the data, we are pleased with the FEM results, as they provided values very similar to the experimental ones for most of the strain gauges. We observed the most significant differences in the higher-up strain gauges, likely due to resin impregnation. We conducted our FEM analyses using material data that did not account for resin impregnation because such data were unavailable in the literature.
Consequently, the thicker sections where strain gauges 1, 2, 3, and 4 have less resin impregnation, making the material data more similar to those without resin.
In contrast, the strain gauges placed higher on the crossbar are in sections with a much smaller thickness (1 cm), where resin impregnation has a more significant impact.
Strain gauge 7 showed the most no deviation from the FEM data. Unfortunately, it is the only one not paired with another indicator, so we cannot be sure if it was faulty or incorrectly positioned. We could observe a more significant discrepancy in other gauges under compression than those under tension - no. 7 is likely the furthest from the FEM data also because it was under compression.
Strain gauge data
Experimental Strain Gauge Data
| Strain gauge | 10 kg | 20 kg | 30 kg | 40 kg | 50 kg | 60 kg | 70 kg | 80 kg |
|---|---|---|---|---|---|---|---|---|
| 1 | 410.88 | 777.14 | 1155.2 | 1355.2 | 1828.8 | 2126.6 | 2560.7 | 2863.6 |
| 2 | 435.98 | 807.44 | 1200.3 | 1405.5 | 1904.9 | 2217.0 | 2675.1 | 2992.4 |
| 3 | -380.47 | -716.53 | -1052.4 | 1232.4 | -1643.5 | -1898.8 | -2257.2 | -2500.5 |
| 4 | -391.29 | -737.84 | -1087.8 | -1280.3 | -1711.3 | -1979.1 | -2359.4 | -2619.8 |
| 5 | 548.61 | 1046.0 | 1561.4 | 1859.6 | 2516.8 | 2925.6 | 3534.3 | 3957.4 |
| 6 | 560.48 | 1068.7 | 1599.5 | 1910.6 | 2599.8 | 3025.8 | 3667.6 | 4116.9 |
| 7 | -629.04 | -1198.1 | -1781.2 | -2164.1 | -2928.8 | -3407.3 | -4115.4 | -4623 |
FEM Strain Gauge Data
| Strain gauge | 10 kg | 20 kg | 30 kg | 40 kg | 50 kg | 60 kg | 70 kg | 80 kg |
|---|---|---|---|---|---|---|---|---|
| 1 | 331.4 | 665.36 | 995.56 | 1332.3 | 1671.5 | 2026.1 | 2356 | 2701.1 |
| 2 | 331.32 | 661.1 | 995.58 | 1332.4 | 1671.6 | 2012.9 | 2322.9 | 2701.4 |
| 3 | -212.5 | -431.01 | -656.15 | -833.37 | -1124.7 | -1367.8 | -1617.1 | -1871.9 |
| 4 | -212.05 | -465.2 | -654.8 | -831.83 | -1209.1 | -1365.2 | -1521.6 | -1868.5 |
| 5 | 306.85 | 627.55 | 971.23 | 1329.1 | 1709.3 | 2102.7 | 2517.2 | 2950.9 |
| 6 | 307.35 | 629.13 | 973.03 | 1330.4 | 1711.9 | 2105.7 | 2520.2 | 2951.7 |
| 7 | -187.47 | -398.97 | -630.22 | -893.64 | -1169.6 | -1482.8 | -1815.2 | -2168 |
In the table below, you can see the percentage differences between the data collected from the strain gauges and the FEM data.
The percent difference between FEM and strain gauge data
|
Strain gauge |
10 kg |
20 kg |
30 kg |
40 kg |
50 kg |
60 kg |
70 kg |
80 kg |
|
1 |
23.983% |
16.8% |
16.034% |
1.7131% |
9.4104% |
4.9613% |
8.6865% |
6.0161% |
|
2 |
28.57% |
22.136% |
20.561% |
5.4839% |
13.951% |
10.137% |
15.161% |
10.77% |
|
3 |
79.043% |
66.243% |
60.386% |
47.88% |
46.128% |
38.83% |
39.585% |
33.581% |
|
4 |
84.526% |
58.606% |
66.135% |
53.918% |
41.534% |
44.972% |
55.058% |
40.204% |
|
5 |
78.788% |
66.68% |
60.765% |
39.915% |
47.245% |
39.132% |
40.409% |
34.107% |
|
6 |
82.36% |
69.876% |
64.383% |
43.611% |
51.866% |
43.695% |
45.527% |
39.478% |
|
7 |
235.54% |
200.29% |
182.63% |
142.17% |
150.42% |
129.79% |
126.72% |
113.24% |
Conclusions and future prospective
We have explored new solutions for composite materials on our boat. We have optimized the use of basalt fiber with Elium thermoplastic resin, replacing the more polluting carbon fiber in the new production.
We have shown how to validate a numerical model with experimental measurements, specifically focusing on a critical component of a sailing boat made from basalt fiber. The main conclusions drawn from this research and possible future perspectives are:
Integration with numerical and experimental data - The project successfully integrated numerical models with experimental data from strain gauges. This holistic approach ensures a thorough understanding of the material properties and structural behavior, enhancing the reliability of the damage detection process.
Validation of datasheet material properties - The tests performed on the used composite increased our knowledge of the material and its behavior.
Material testing - we could also perform other material tests to obtain the G moduli and the compressive strength.
Acknowledgments
We want to express our deep gratitude to our sponsors, without whom this report would not have been possible. In particular, we would like to thank Dewesoft and the Politecnico di Milano for their essential support.
Thanks to prominent members of the Polimi Sailing Team, including Roberto Faure Regani, Pietro Formenti, and Gianluca Grinovero, for their commitment and dedication.
We would also like to thank Professors Arianna Bionda, Andrea Ratti, Giulia Pomaranzi, and Paolo Schito for their guidance and academic support. Technicians Mauro De Mori and Lorenzo Giudici deserve special thanks for their technical assistance and expertise. We extend our gratitude to Alessandro Vescovini, a researcher at Politecnico di Milano, for his help and guidance on composite materials.

