Table of contents
Browse categories
Browse authors
 AB
ABAlberto Boffi
 AL
ALAlessia Longo
 AH
AHAl Hoge
 AB
ABAljaž Blažun
 BJ
BJBernard Jerman
 BČ
BČBojan Čontala
 CF
CFCarsten Frederiksen
 CS
CSCarsten Stjernfelt
 DC
DCDaniel Colmenares
 DF
DFDino Florjančič
 EB
EBEmanuele Burgognoni
 EK
EKEva Kalšek
 FB
FBFranck Beranger
 GR
GRGabriele Ribichini
Glacier Chen
 GS
GSGrant Maloy Smith
 HB
HBHelmut Behmüller
 IB
IBIza Burnik
 JO
JOJaka Ogorevc
 JR
JRJake Rosenthal
 JS
JSJernej Sirk
 JM
JMJohn Miller
 KM
KMKarla Yera Morales
 KD
KDKayla Day
 KS
KSKonrad Schweiger
Leslie Wang
 LS
LSLoïc Siret
 LJ
LJLuka Jerman
 MB
MBMarco Behmer
 MR
MRMarco Ribichini
 ML
MLMatic Lebar
 MS
MSMatjaž Strniša
 ME
MEMatthew Engquist
 ME
MEMichael Elmerick
 NP
NPNicolas Phan
 OM
OMOwen Maginity
 PF
PFPatrick Fu
 PR
PRPrimož Rome
 RM
RMRok Mesar
 RS
RSRupert Schwarz
 SA
SASamuele Ardizio
 SK
SKSimon Kodrič
 SG
SGSøren Linnet Gjelstrup
 TH
THThorsten Hartleb
 TV
TVTirin Varghese
 UK
UKUrban Kuhar
Valentino Pagliara
 VS
VSVid Selič
 WK
WKWill Kooiker
Testing Aerodynamics on a Formula Student Race Car
Bennet Markovič, Aerodynamics Team Leader
UNI Maribor Grand Prix Engineering formula student team, Maribor University
September 26, 2025
The UNI Maribor Grand Prix team has conducted an experimental test to assess the efficiency of their race car's aerodynamics. The team used Dewesoft measuring devices to evaluate dynamic forces on the car’s suspension. They compared real-world data with computational fluid dynamics (CFD) simulations. The tests provided valuable insights into the effectiveness of the drag reduction system (DRS) and the reliability of the simulation.

Aerodynamics testing involves simulating airflow over the vehicle. We use this to study the air resistance and thrust forces generated during driving. Validating simulations provide insight into the actual state of the vehicle's aerodynamic properties.
A robust aerodynamics package ensures high downforce and low drag and maintains a consistent ratio of front-to-rear downforce. This aerodynamic balance ensures that all four race car tires have equal grip.
The primary purpose of our testing is to experimentally measure the aerodynamic package’s efficiency. This involves testing directly on the track to gather real-world data. We use Dewesoft’s measuring devices to assess dynamic forces on the suspension during these tests. The collected data is then compared with computational fluid dynamics (CFD) simulation outcomes to evaluate and refine the aerodynamic performance.
GPE and Formula Student
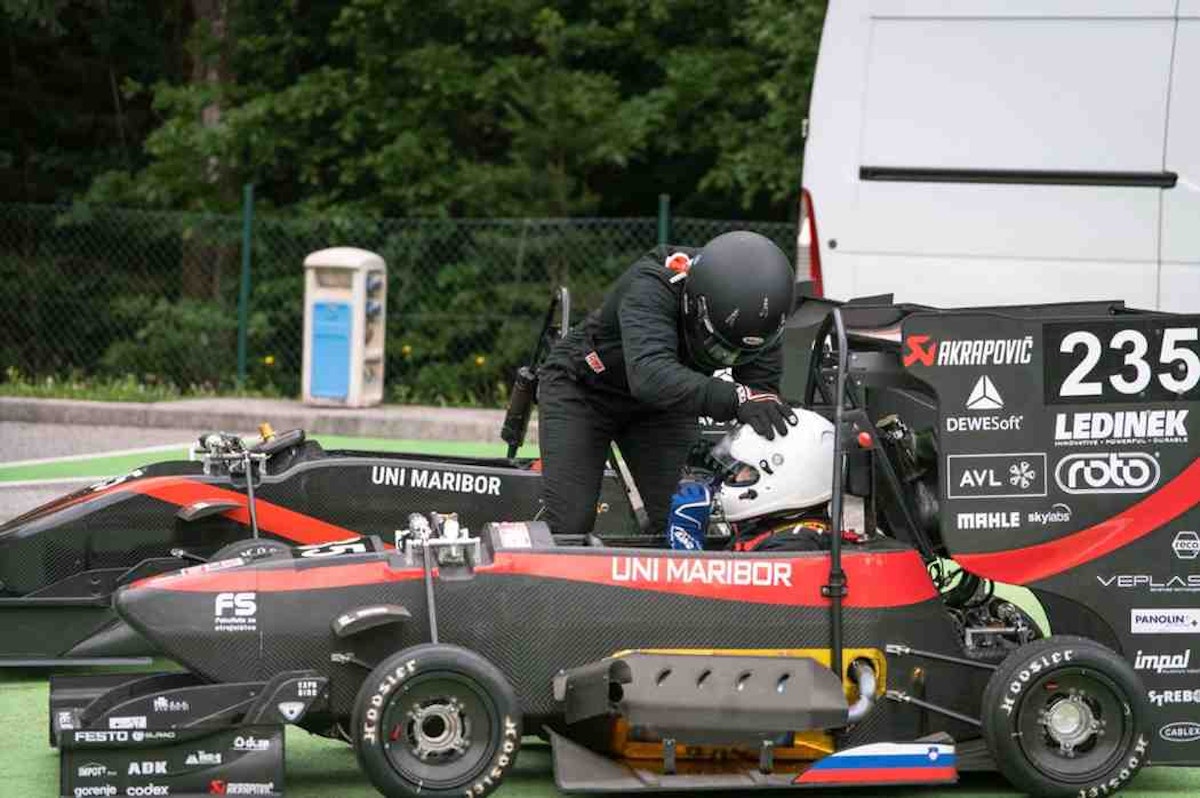
Uni Maribor Grand Prix Engineering is a student project under the University of Maribor's Faculty of Mechanical Engineering mentorship. We are a team of young aspiring adults with the same passion for motorsport and innovation. With the help of the faculty and our sponsors, we manage to develop and manufacture new race cars every year.
Our choice of materials reflects our goal to create a lightweight and reliable car. Most components are constructed from carbon fiber composites, increasing the car's strength and reducing its weight.
Our latest car is also our first fully electric racing car. We named it Missy. An electric motor that develops 86 kW powers the 185-kilogram vehicle, which can accelerate to 100 km/h in just 3.1 seconds. Missy draws energy from a battery pack with a capacity of 7.7 kWh, sufficient for approximately 30 kilometers of electric autonomy on the racetrack.
As a team, we compete in Formula Student competitions around Europe. Formula Student is an international engineering design competition, first held in 1979 by the Society of Automotive Engineers. Formula Student challenges university students to design, build, and race a formula-style car. Teams from various universities worldwide participate in this annual event, showcasing their design, manufacturing, testing, and business presentation skills.
The competition emphasizes the technical aspects of building a high-performance race car and encourages students to develop project management and teamwork skills. Participants must adhere to strict rules and regulations while pushing the boundaries of innovation to create a well-rounded and competitive vehicle.
In this case, our testing goal is to measure and evaluate aerodynamic forces during acceleration and at constant speed. We aim to ensure the best possible consistency and repeatability of the measurements.
Selection of measuring devices
The choice of suitable measuring devices depends on the testing method and the purpose of what and how we want to measure. In this work, we received significant support from Dewesoft, which specializes in conducting measurements and producing measuring devices. Based on our measurement needs, we used three different measuring devices or modules from Dewesoft provided under a sponsorship agreement.
Hardware and software used
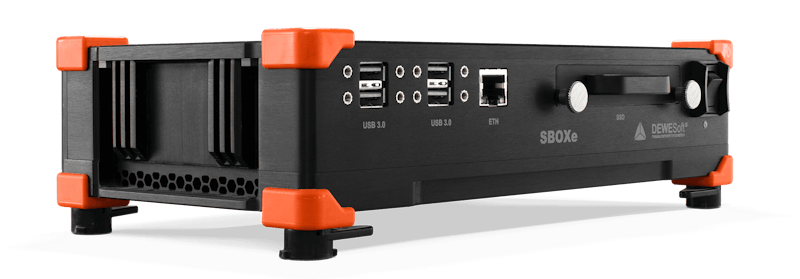
SBOX: a powerful data processing computer and highly reliable SSD data logger.
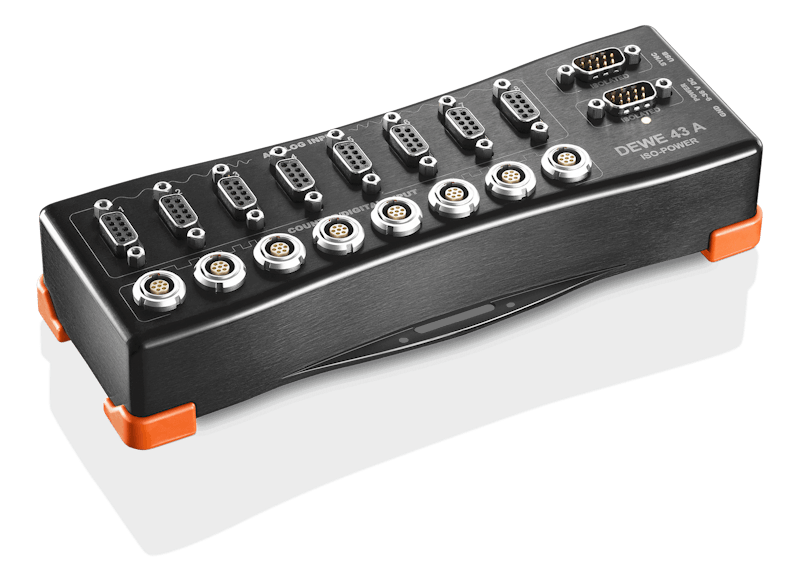
DEWE-43A a versatile 8-channel USB data acquisition system with a hand-size footprint. It has eight universal analog inputs, eight digital/counter/encoder inputs, and two high-speed CAN bus inputs.
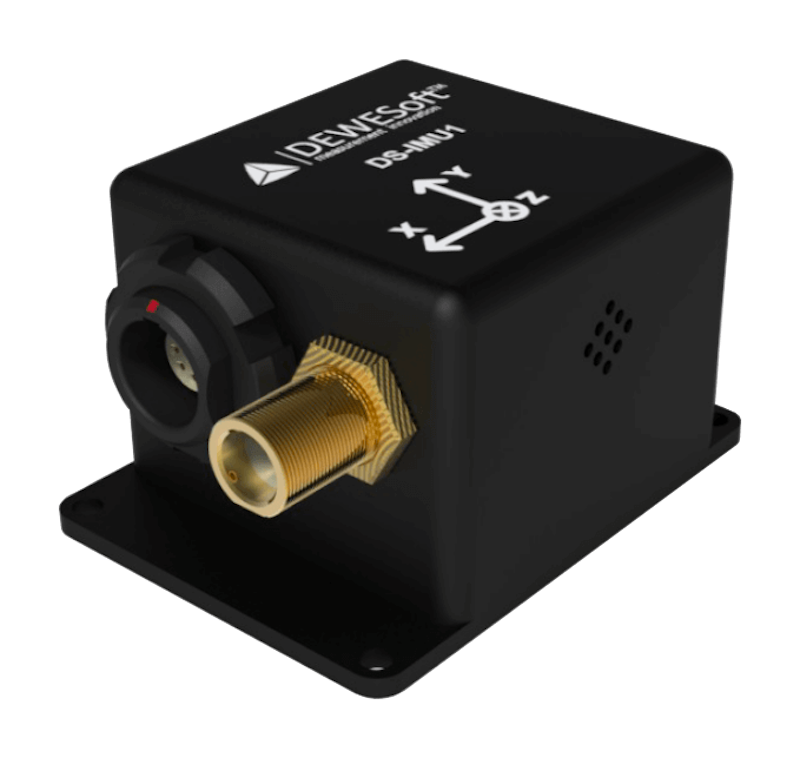
DS-IMU1: compact and rugged inertial navigation system.
DewesoftX software: software for signal measurement, data recording, signal processing, and data visualization.
Dewesoft Polygon software: extension to transform a geodetic position (GNSS position) into a local coordinate system.
Load cells
Potentiometers


The Dewesoft SBOX is a rugged industrial computer that stores data and exports it later. This computer allows real-time monitoring and review of measurement values and provides access to the licensed DewesoftX software. Additionally, it has an integrated 10 Hz GPS (Global Positioning System), allowing data capture every 100 ms, which is more than sufficient for our needs.
The Dewesoft DEWE-43A is an 8-channel data acquisition system and an ADC (Analog to Digital Converter) device that converts the analog signal measured from the sensor into a digital format. Besides serving as a signal amplifier, the DEWE-43A can also directly read CAN (Controller Area Network) communication. However, due to the chosen sensors, this does not apply to our measurements.
The Dewesoft DS-IMU1 is a measuring instrument that functions as a GPS and an accelerometer. The Polygon module is a tool for transforming the geodetic position.
This device helps track the vehicle’s location, measure accelerations, slip angles, etc. It also works as a gyroscope, providing data on the tilt angle of the car during braking or acceleration.
For our measurements, the DS-IMU1 mainly enables the Dewesoft Polygon software extension. A tool for transforming the geodetic position (GNSS position) into a local coordinate system and simplifying the calculations between objects with different 2D geometries. It allows for lap time tracking, sectional data measurement, and data capture at a specific vehicle speed.
For our measurements, we will use the instrument to capture data based on a marked section of the test track. It will be set to record data at a specific speed. When capturing acceleration data, the instrument will be programmed to record from a defined minimum to maximum speed.
Selection of sensors
We considered using strain gauges or load cells based on strain gauges to measure dynamic forces on the suspension.
Strain gauges measure stress or deformation in the observed element or material subjected to external force. They typically consist of a thin film adhered to the element's surface. The film deforms when the measured element experiences a load, changing electrical resistance. This change can be measured and used to determine the applied force.
The purpose of load cells is to convert weight or force into an electrical signal. Load cells are metal frames with attached strain gauges that bend under weight or force. They allow for measuring the change in electrical resistance due to deformation and converting this into a force value.
Before deciding between these two options, we first examined the differences and advantages of each. Load cells directly measure the force or weight acting on them by converting it into an electrical signal.
In contrast, strain gauges indirectly measure force by detecting the stress or deformation caused by the applied force. Load cells offer a more extensive measurement range and significantly greater accuracy than strain gauges. Strain gauges do not achieve such accuracy because they require prior calibration for optimal precision.
One essential characteristic of load cells, given our measurement execution, is their robustness. They are highly resistant to environmental factors such as temperature. They are particularly effective in withstanding vibrations caused by the roadway. The most significant drawback of load cells is their cost compared to strain gauges. Their price is considerably higher due to their complex design and greater accuracy.
The main disadvantage of strain gauges is their implementation on the measured object. In our case, we would need to glue the strain gauges onto a composite carbon rod, which poses an additional challenge, as there are questions about how thick the adhesive layer should be between the carbon and the strain gauge.
Based on the information outlined above, we decided to purchase a load cell, as we want the final measurement results to be truly accurate and reliable. Figure 2 shows the installed load cell on the race car.
Statistical data processing
We would perform each measurement five times to check the repeatability of the measurements by determining the deviations between the individual repetitions.
We read the values by selecting a section in the DewesoftX software where the speed became constant. We then positioned ourselves at the yellow line, visible in the lower graph in Figure 3, at the center of the section. The program then read the average values for 2.5 seconds to the left and right of the yellow line. The program displayed the values in a box with blue text for the rear load cell and in a box with green text for the front load cell, as shown in Figure 3.
Measurement results
As mentioned, we measured at constant speeds of 50 km/h, 60 km/h, and 80 km/h. We also measured with the DRS (Drag Reduction System) flaps open at these speeds. From these measurements, we aimed to compare how the total downforce changes with the flaps closed versus open. We are also interested in how the balance or distribution of forces between the front and rear wheels changed in both cases.
Another reason for this measurement is to compare the average values of total downforce and balance at different speeds and how the values change with speed.
For the validation, we used the following equation to evaluate the results. It is based on the principles of dynamic similarity and is a specific application of Bernoulli's principle in combination with the square relationship between force and speed in aerodynamic systems:
Where:
[N] - downforce at the initial speed
[N] - downforce at the new speed
[m/s] - initial speed
[m/s] – new speed
With this equation, we calculated how much the drag force should be at a specific speed based on the measured speed. We conducted our first measurements at 50 km/h with closed and open wings. For both cases, we performed five repetitions.
The average drag force measurement at 50 km/h was 352.6 N, while with the open DRS, it was 329.6 N, as shown in Figure 4, specifically from the blue column. We expected that the open wings would significantly reduce the total drag force. In our case, DRS reduced the total force by 6.5%.
The subsequent measurements were at a constant speed of 60 km/h. The average value of the drag force measurement with closed rear wings was 386.6 N, while with open rear wings, it was 376.6 N. Even in this case, the difference is negligible, only 2.6%.
We measured our last constant speed at a steady speed of 80 km/h. In this measurement, we recorded a total force of 523.2 N with closed wings; with open wings, it was 481.4 N. Again, we did not obtain a significant difference - only 7.99%.
All three comparisons show that the total drag force increased with the closed DRS and generally decreased with the open wings. We determined that the force increased by 26% from a speed of 50 km/h to 80 km/h when both wings were closed.
The results show that the forces do not differ much at 50 km/h and 60 km/h, but we can observe that the forces increase significantly at higher speeds. The results show that the forces do not increase as we expected. To investigate further, we performed a calculation based on the equation above. Using the measured force at 50 km/h, we found that the force should be 507.7 N at 60 km/h and 902.7 N at 80 km/h.
Thus, we conclude that our force at 60 km/h was 24% lower, and at 80 km/h, it was 42% lower. Therefore, our measurement at 50 km/h is not credible as the deviations are too large.
Dynamic force measurements during acceleration
To compare the measurement of thrust force at a constant speed, we decided also to perform measurements during acceleration. One of the reasons was to measure and validate the functioning of the DRS system, as we will use it during acceleration in competitions. We were particularly interested in what happens to the forces during acceleration and how the balance of forces changes along the axes.
While conducting the acceleration measurements, we were aware that the results might only be somewhat reliable, primarily due to the dynamics of the race car. During acceleration, the vehicle tends to squat slightly due to the action of the suspension. The suspension stabilizes during driving, so we do not expect significant deviations during the repetitions.
Another factor influencing the results is the driver change, as the same driver could not perform the measurements due to health issues. We conducted measurements both with and without DRS.
We chose the average values to compare the results at speeds of 50 km/h, 60 km/h, and 80 km/h. The static thrust force with the second driver in front was 590 N, while at the rear, it was 740 N.
When analyzing the average total thrust forces, we observed a significant increase at 80 km/h compared to 50 km/h. The total force increased by 29.32%. As a result, we can conclude that the race car has better grip during high-speed turns. Additionally, our aerodynamic package helps achieve higher speeds through these turns.
The sharp increase in force with speed negatively affects our race car’s acceleration, preventing it from reaching higher speeds quickly. To address this, we implemented DRS on the race car to reduce aerodynamic drag.
At 50 km/h, DRS reduces the total thrust force by 8%, and at 80 km/h, it reduces it by 7%. Our tests show that with DRS open, there is enough grip at the start to prevent wheel slip. Later, it ensures a more gradual increase in force, as shown by the orange line in Figure 5. To confirm the results, we verified their accuracy using the equation mentioned earlier.
We conducted the calculation for forces when DRS is closed. Based on the 50 km/h results, we calculated that our thrust force should be 459.7 N at 60 km/h and 817 N at 80 km/h. Thus, based on our calculations, we measured slightly higher values than they should have been. At 60 km/h, the deviation was 9.3%, while at 80 km/h it was 22.6%. Therefore, we concluded that the measured results at 60 km/h are much more reliable than at 80 km/h, as the deviation is less.
Comparison of measurements and calculations
First, we need to compare our measurement data with the calculations. We must establish which results we can rely on based on their deviations from the calculated values. We only compared the deviations of the measured results against the calculated ones when the DRS was closed.
Table 1 shows that the results measured during acceleration had much more insignificant deviations from the estimated or predicted values than those measured at a constant speed.
| Speed | Constant speed | Acceleration |
|---|---|---|
| 50 km/h | 0,0% | 0,0% |
| 60 km/h | 24,0% | 9,3% |
| 80 km/h | 42,0% | 22,6% |
Figure 6 shows that the measured forces during acceleration at 60 km/h and 80 km/h were much more significant than at constant speed. At a speed of 50 km/h, the differences were not as pronounced. Thus, the recorded measurement at a 50 km/h speed was more accurate in both scenarios.
Based on this comparison, we can determine that the calculated values are indeed the values we should have obtained through subsequent measurements. Our measurement became increasingly less accurate with the increase in speed.
Comparison of measurements with simulation results
The last comparison we conducted was between the results from measurements and those obtained from the CFD simulation. We compared the constant speed for our Reliability Demonstration Test (RDT) since we also used constant speed in the simulation. This comparison aimed to see the difference in results and how much we can rely on the simulations.
We have already established that the accuracy of our measurements decreases as speed increases. Additionally, the deviations become more significant at higher speeds. Despite this, we conducted the comparison to see how closely our measured results aligned with the simulation results.
From Table 2, we observe that the deviation of the measurements from the CFD simulation results increased as speed rose. At 80 km/h, the deviation in total thrust force was 51.8%.
This comparison is irrelevant because the measurement results at 80 km/h were inaccurate. However, the results measured at 50 km/h are relevant for comparison, as the deviations between different types of measurements were minimal.
Using the 50 km/h results, we could make comparisons with calculated values. The lower part of Table 2 shows no significant deviations between the measured and simulated balance on the front axle.
| Speed | Total Thrust Measured [N] | CFD Total Thrust [N] | Deviation [%] |
|---|---|---|---|
| 50 km/h | 352,6 | 450,0 | 21,6 |
| 60 km/h | 386,6 | 603,6 | 36,0 |
| 80 km/h | 523,2 | 1085,0 | 51,8 |
| Speed | Balance Measured [%] | CFD Balance [N] | Deviation [%] |
|---|---|---|---|
| 50 km/h | 46,51 | 49,3 | 2,79 |
| 60 km/h | 49,35 | 49,2 | -0,15 |
| 80 km/h | 54,39 | 49,3 | .-5,09 |
Conclusion
Experimental analysis of the aerodynamic package's effectiveness is crucial, particularly in motorsport, where aerodynamics performance plays a significant role in achieving better lap times. With this goal in mind, we decided to assess the effectiveness of our aerodynamic package.
Within our team, a recurring issue arose during the setup of the race car for specific disciplines. The problem emerged when the car did not behave as expected according to the settings. We based these settings on numerical simulation results rather than real-world outcomes.
For this reason, we conducted an experiment measuring dynamic and static forces on the race car. The main objective was to adjust the car's settings based on the experimental results and improve the car's performance characteristics.
Another challenge we faced in previous seasons was the uncertainty about the reliability of CFD simulation results. Thus, we aimed to compare the measured force results with those from CFD simulations. Throughout the analysis of the measurement results, we concluded that it is crucial to consider numerous factors affecting the measurement process.
During the analysis of the aerodynamic package, we achieved our primary goal by enhancing the car's settings, which the subsequent lap times reflected. Our next objective was to ensure good repeatability in the results measured at constant speeds. The results obtained during acceleration had slightly lower repeatability but were still adequate for later comparisons.
The final goal we set before experimenting was to perform measurements with both open and closed DRS, which we accomplished. We were particularly interested in the effectiveness of the DRS system on Formula Student race cars.
We found that at speeds of 50 km/h, 60 km/h, and 80 km/h, there were minimal differences when DRS was open. After comparing the measured forces at various speeds with the results from the CFD simulations, we observed that deviations increased with speed. The deviation at 50 km/h was 22%, while it rose to 52% at 80 km/h.
During the experiment, we made numerous discoveries that will significantly assist us in conducting similar measurements in the future. To improve accuracy, we should consider the air density on the day of testing and the impact of wind. To reduce the effect of wind on the measurement results, we should conduct tests by driving in different directions.