


Synchronized Combustion and NVH Measurements on an Engine Test Bench
In passenger car design, the subjective driver experience is getting increasingly important. A key factor is the vibration and noise the driver is exposed to while driving. And for this, the vehicle powertrain is the primary influencer. The basis for analysis and optimization is understanding data from the internal combustion engine combined with multiple NVH data of the driver - the environment, and vehicle bus data. On its testbeds, the University of Applied Sciences in Frankfurt had the challenge of simplifying measuring and gaining valuable training capacity. Dewesoft helped out.
Many measurement systems focus only on one application and one set of data. For complex tasks, you often need more measurement systems and to invest time-consuming efforts in post-processing.
For the data analysis and optimization, you typically need to use three to six exports in different software packages. You will have to check the acquired data for plausibility and synchronization. Using Dewesoft, you need just one measurement file for various exports. And you can still do analysis and optimization in whatever software.
The Dewesoft solution helped the university establish synchronized measurement with direct visualization as a standard approach. The issue, in this case, is only one example of various situations requiring different specialized measurement systems. OEMs, Tier 1 suppliers, and all others designing or verifying more than a single component face such challenges of synchronization and immediate visualization.
The issue - testbed time
In this case, setting up measurements by this approach was done at the University of Applied Sciences Frankfurt (Frankfurt UAS). The university provides about 38 study programs in architecture and civil engineering, business and business law, informatics and engineering, social work, and health.
Since 1988, the laboratory engineer Dipl.-Ing. Ingo Behr, M.H.Edu. has been working at the Frankfurt UAS in the Computer Science and Engineering Faculty laboratories focusing on the combustion engine. He has experience in questions of study structure reform and is involved in the design of consecutive courses in Mechanical Engineering.
However, Ingo Behr had a problem. The lab couldn’t show the students the principal interactions between the in-cylinder pressure of a combustion engine and NVH parameters. Live visualization wasn’t possible with separated systems. And post-processing consumed much more time than the test itself.
Today’s challenge in higher education is that a large number of students need to learn the basics of testbed operation. And the testbed control room has only space for three to four. We must spend our time on the testbed most efficiently.
Frankfurt UAS has a dedicated engine laboratory researching combustion engines. The laboratory team is also responsible for the educational training of the students in combustion engines and fields like measurement of various physical quantities, thermodynamics, vibration analysis, and exhaust gas measurements.
The combustion engine laboratory has various testbeds:
Classical engine testbeds
A testbed for fuel octane number
A testbed for diesel high-pressure fuel pumps
Testbeds for small single-cylinder engines
Various workspaces, e.g., for adjusting and mounting mechanical parts, fuel mixing, and postprocessing, complete the laboratory.
The application - driving comfort
How drivers and passengers perceive driving and riding a car has become increasingly critical. Today, the comfort of driving is a key market differentiator. Automotive engineers are working on translating the subjective experiences of drivers and passengers into objective and measurable key performance indicators (KPIs) and developing appropriate testing methods.
The riders’ vibration and noise exposure is one criterion for the comfort experience in passenger cars. Traditionally, development engineers have a range of measurement systems to evaluate such exposure, each system doing specific tasks like combustion analysis, vibration analysis, or dedicated aspects of acoustic analysis. Often three or even four measurement systems are used in parallel - all having relevance and specialization in their fields.
However, one problem with such a setup is that these systems aren’t synchronized directly and, in many cases, even require additional data from other systems for analysis and optimization. The measurement files produced are not synchronous, and data alignment is time-consuming - or even impossible.
The classical approach for this problem is to use highly specialized systems only applicable to one specific application. A combustion measurement system is used in parallel to another for vibration and acoustic measurements, and a third measurement system saves various bus data from CAN-FD or FlexRay. Each measurement system has its separate software and produces a dataset unaligned with the others.
This approach has several disadvantages. For example, the need for user experience in each measurement system and the costly time consumption to align the data. This isn’t possible all the time. The approach of Dewesoft is to enable optimization and deeper analysis by measuring all data with just one system and distributing raw and calculated data through various exports to specialized software.
With just one measurement system you are capable of acquiring all data, saved in a single file. In parallel, Dewesoft does the standard calculation of all applications involved and the presentation of result values online.
Immediate visualization of the relation between the combustion analysis and the engine vibration is key to fulfilling our expectations.
The online view provides the opportunity for direct data verification to reduce the number of invalid measurements induced, e.g., by outer influences. Still, the data can be post-processed with already-established processes. However, Dewesoft software may help simplify the tasks supporting post-processing with various export formats.
Figure 1 shows this process simplification. The different systems (A-D) are replaceable by one system with one online software. The already existing analysis and optimization processes are supported using an export.


The solution - combined combustion and NVH engineering
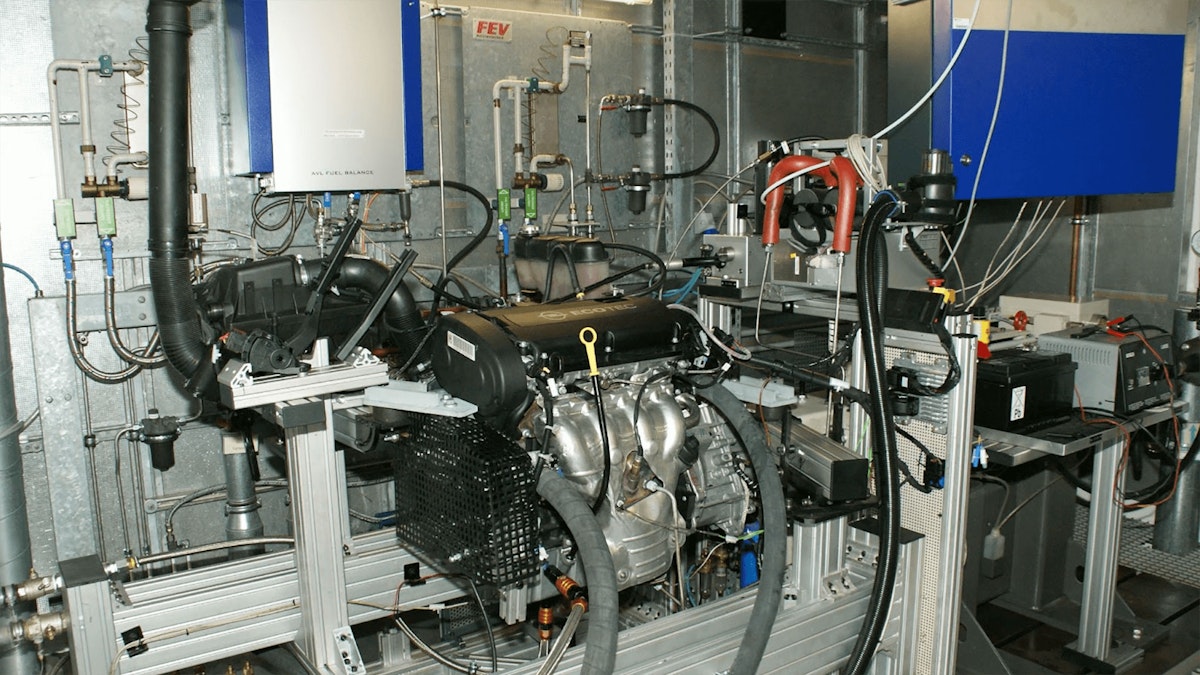
The engine test site has two rooms. One for the testbed and a control room. The laboratory has modified a standard passenger car engine to show students the principal testbed tasks with steady-state measurements and dynamic driving. This engine is attached to the testbed base, and the dyno transforms the generated power into electrical energy. The engine testbed also includes different systems for measuring:
the engine’s mechanical power,
fuel consumption,
exhaust gas analysis,
combustion measurement, and
NVH measurement.
The students have to do some testing in this lab during their curriculum. Typically, the students during the course are divided into small groups having different measurement tasks. The groups discuss their various goals and plan a measurement procedure. Then they do the measurements on the engine testbed, online analysis, and data postprocessing. It’s all done in a couple of sessions during a semester. Finally, the students present their results and conclusions to other students and justify them in front of the examiners.
In one project, the students must acquire data and correlate the internal combustion engine results with noise, vibration, and harshness (NVH) data. All this comes from sensors mounted outside the engine. This testing aims to establish the correlation between the combustion engine, the vibration it induces - before and after the bearing - and the sound it produces. The test done is transferable to passenger car development as it applies to the universal problem in other applications.
System setup
The Dewesoft test setup is designed to be mobile and is applicable on roads or test tracks. However, it also works with test benches like chassis dynos. Testing can either be manual or through systems operated as remote-controlled slaves, e.g., by Etas INCA (mobile) or an automation system (testbed). The operation is controllable via triggers, XCPoE, or a test bed plugin.
The system configuration depends on the number of channels and the applications. Typically the data acquisition system is combined by:
SIRIUSi High Speed (HS) modules with integrated charge amplifiers acquire the combustion data with up to 1 MS/s sampling rate.
SIRIUS DualCore or SIRIUS High Density (HD) modules with IEPE inputs acquire the noise source and vibration data with up to 200 KS/s sampling rate.
These systems are fully synchronized, and the hardware time-stamps the analog measurement data. Also, CAN-FD is measurable within the same hardware. The FlexRay is obtained in parallel and soft-synced with the time information of the messages’ arrival. The decoding of the bus trace is done online directly in the software.
Hardware configuration
The hardware configuration in use consists of Dewesoft SIRIUS data acquisition systems - see also Figure 3:
SIRIUSi-HS-6xCHG-2xCHG+ with CAN-FD upgrade and charge amplifiers
SIRIUS-HD-16xACC with CAN-FD upgrade and IEPE inputs
Please note that these systems are configurable in different ways.


The engine setup - see Figure 4 - was based on a crank angle encoder (1), modified spark plugs measuring the combustion pressure (2), vibration sensors (3), and a microphone (4) placed in the testbed. Cabling connected the sensors to the SIRIUS measurement modules in the engine control room beside the automation system.


Software configuration
Through DewesoftX Professional software, the Dewesoft SIRIUS measurement systems are operated as slaves beyond the testbed automation system. The software DewesoftX uses the standard scope for the acquisition. The analog and counter inputs are defined, and the calculations required are pre-defined in the corresponding plugins and options.
The software used is:
DewesoftX Professional - software for signal measurement, data recording, signal processing, and data visualization and analysis.
Dewesoft Combustion Engine Analyzer - enables basic combustion analysis and recalculation from the time domain to the angle domain - in the time domain for cold starts. The option also adds the combustion scope and the p-V diagram visual control.
Dewesoft Sound Level Meter module - adds the sound level meter functionality to DewesoftX.
Dewesoft FFT module - enables real-time FFT analysis on unlimited input channels with a large selection of advanced markers and bearing faults.
In addition to the Sound Level meter, Dewesoft is also able to provide sound quality, sound intensity and torsional vibration measurements, completely synchronized. This allows options for future analysis to be done with the same system.
The example described here shows four piezoelectric cylinder pressure sensors mounted into the combustion chamber and connected to the SIRIUSi-HS system with charge inputs. This device also has the crank angle sensor connected via Dewesoft Supercounters. This enables the base for the combustion measurement with all engine speeds due to a sampling rate of up to 1MS/s.
The Dewesoft Combustion Engine Analyzer module is used for combustion engine analysis. The four measured pressure signals are transferred from the time domain into the crank angle domain and can be displayed from cycle to cycle. The software also calculates the needed measurement results, e.g., the mean effective pressure and center of combustion.
Laboratory engineer Ingo Behr connected the vibration and sound sensors to a SIRIUSi system with IEPE inputs. This system has a 200kS/s acquisition rate with a 2x24bit resolution per channel. The system allows dynamic of nearly 160dB - and perfect sound data.
The data is transferred to an FFT or a weighted sound noise level using the Sound Level Meter and the FFT modules. This setup allows seeing the high-frequency components of the vibration and the sound induced by the engine bearing. Using additional accelerometers also enables the comparison of engine vibrations before and after any bearings - and measuring their damping.
The measurement system was set up as a slave beyond the engine test bench automation system while using the test bed plugin in DewesoftX. The slave operation isn’t limited to this - it is also operational by ECU calibration or validation tools.
The advantage of this is that the automation system is not only operating the measurement system (start, stop). File names for the measurements are defined by the automation system and transferred to DewesoftX Professional. The results, the combustion, sound, and vibration measurement values, are continuously shown in the system’s operating overview and database storage.
The online view helps to directly verify the system setup - another advantage of this approach. Faulty measurements are immediately visible and can be corrected and repeated. Figure 5 shows the analog input setup using channels 1 to 4 and 9 to 11.


The measurements
The two most common types of tests used for engine development are the step test and the "acceleration" or sweep test.
In a step test, the engine is operated at constant speed until it is stable and the data is acquired. Then the engine speed is changed to the next set point. The advantage of the step test is that the inertia of the engine and the dynamometer do not impact the torque reading. With no acceleration, the test can be more consistent.
In the step test, the engine must run at a constant rpm for a short time. However, this is not a condition that engines see in operation and may impact the tuning. It is a fundamental reason why optimal tuning on dyno and track may differ.
The sweep or acceleration test accelerates the engine at a constant rate, for example, 100 rpm/second or 300 rpm/second. Sweep tests are typically the result of a controlled rate of unloading the power absorption unit.
Sweep tests simulate track conditions more closely than step tests, but the acceleration control impacts the torque readings. During the test - and from test to test - the acceleration rate must be consistent. The dynamometer control system is a factor in producing consistency among sweep tests.
The DewesoftX software supports various screens and widgets to provide a range of data visualization possibilities. The goal of the visualization is to have a clear overview of relevant data to verify if the measurement is valid.
The measurement screen in Figure 6 shows the various data clustered in separate areas. Each corner presents an area of data. In this case, the displayed data areas are
combustion measurement,
vibration measurement,
acoustic measurement, and
bus data and data correlation.


Conclusion - simplified testing
With a lean setup, the Dewesoft approach enabled the acquisition of all the required parameters. The number of measurement systems - and interactions between the different systems - was reduced to a minimum. This reduction led to a much more stable and less troublesome testing environment. And fewer testbed hours.
In our practical test, the Dewesoft approach simplified the data acquisition process and required no adjustments in the established analysis process.
The laboratory can use the system as a stand-alone system for mobile tests. However, it also proved applicable in a testbed setup - engine or chassis dyno, including support for demands like Road2Rig. A range of vehicle buses like CAN-FD and Flexray, including dynamic PDUs, are possible with Dewesoft. Not many measurement systems support a similarly wide range of vehicle bus systems.
The success of this solution is based mainly on two unique features:
The capability to acquire synchronous raw data and vehicle bus data, including the needed calculations for different areas, such as combustion analysis, sound analysis, and vibration analysis.
The capability to support all needed data exports providing the data to teams and processes involved.
The wide variety of support applications and exports in DewesoftX allows adapting this approach to different combinations such as:
Hybrid engine analysis: combustion engine analysis + electric engine power analysis.
NVH analysis of electric cars: electric power analysis + sound level + sound intensity + order analysis + vibration analysis.