Table of contents
Browse categories
Browse authors
 AB
ABAlberto Boffi
 AL
ALAlessia Longo
 AH
AHAl Hoge
 AB
ABAljaž Blažun
 BJ
BJBernard Jerman
 BČ
BČBojan Čontala
 CF
CFCarsten Frederiksen
 CS
CSCarsten Stjernfelt
 DC
DCDaniel Colmenares
 DF
DFDino Florjančič
 EB
EBEmanuele Burgognoni
 EK
EKEva Kalšek
 FB
FBFranck Beranger
 GR
GRGabriele Ribichini
Glacier Chen
 GS
GSGrant Maloy Smith
 HB
HBHelmut Behmüller
 IB
IBIza Burnik
 JO
JOJaka Ogorevc
 JR
JRJake Rosenthal
 JS
JSJernej Sirk
 JM
JMJohn Miller
 KM
KMKarla Yera Morales
 KD
KDKayla Day
 KS
KSKonrad Schweiger
Leslie Wang
 LS
LSLoïc Siret
 LJ
LJLuka Jerman
 MB
MBMarco Behmer
 MR
MRMarco Ribichini
 ML
MLMatic Lebar
 MS
MSMatjaž Strniša
 ME
MEMatthew Engquist
 ME
MEMichael Elmerick
 NP
NPNicolas Phan
 OM
OMOwen Maginity
 PF
PFPatrick Fu
 PR
PRPrimož Rome
 RM
RMRok Mesar
 RS
RSRupert Schwarz
 SA
SASamuele Ardizio
 SK
SKSimon Kodrič
 SG
SGSøren Linnet Gjelstrup
 TH
THThorsten Hartleb
 TV
TVTirin Varghese
 UK
UKUrban Kuhar
Valentino Pagliara
 VS
VSVid Selič
 WK
WKWill Kooiker
Seismic Safety Assessment of a Hospital Building
Ph.D. Blaž Zoubek, SPEKTRAL and Ph.D Jure Žižmond, SPEKTRAL
University Medical Centre Ljubljana
April 10, 2024
Assessing the seismic safety of structures requires a precise understanding of the building and its behavior during an earthquake. To evaluate seismic hazards, correct modeling of the structure is crucial. Monitoring ambient vibrations and comparing those with numerical models validate the analysis. The structural engineering company SPEKTRAL undertook a seismic assessment of the building using Dewesoft sensors for model validation.

SPEKTRAL has expertise in the field of earthquake engineering. With demanding computer simulations, their engineers can predict the likely responses of new and existing buildings to an earthquake and other dynamic loads. Knowledge gained from those simulations helps clients to make smarter investment decisions.
In this process, engineers apply advanced software that allows the modeling of nonlinear dynamic responses of structures. However, a good understanding of the main parameters of the analysis, which must reflect the actual state of the structure, is crucial. Only complete input data can lead to accurate results.
Monitoring ambient vibrations and comparing the identified natural modes of oscillation with those obtained from numerical models is an excellent way to verify the model’s accuracy. This combination of theoretical approaches and experimental data improves the validation of numerical models and enhances the overall process of assessing seismic safety.
The Peter Držaj hospital
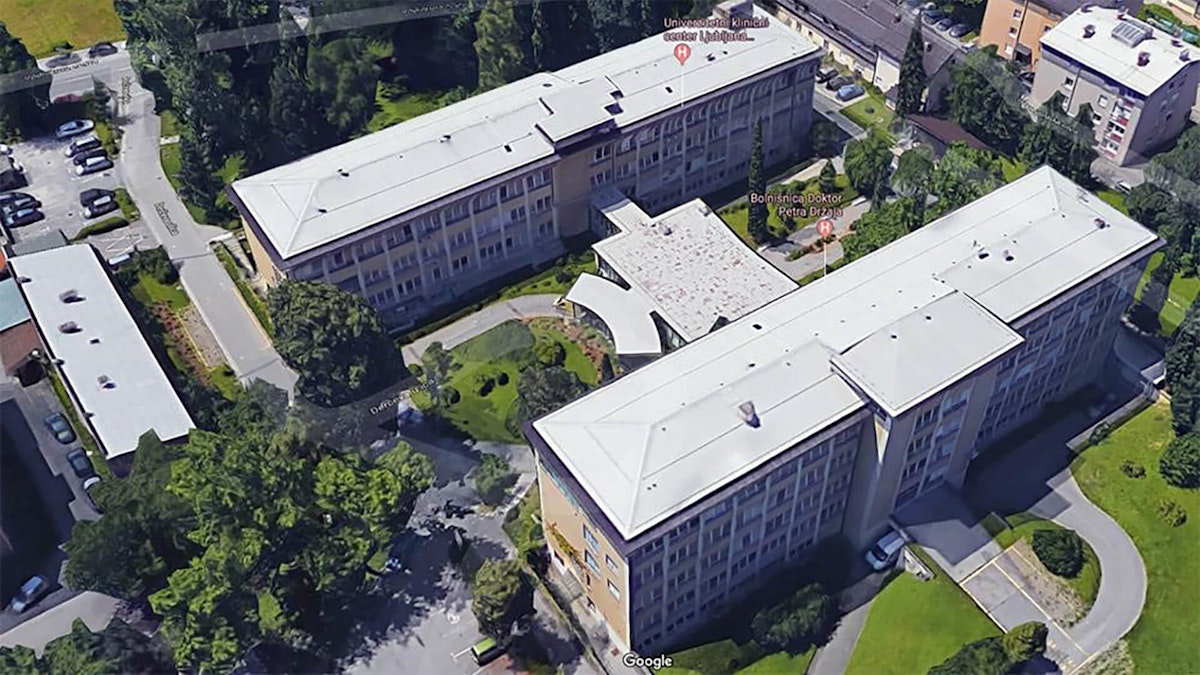
In 2023, SPEKTRAL undertook a seismic risk assessment of Peter Držaj Hospital in Ljubljana - see Figure 1. As the client, UMCL sought to inform investment decisions by acquiring expert opinions on the building’s earthquake resistance.
The building is from 1962 and has a northern, a southern, and a connecting wing. The northern and southern wings have five and four stories, respectively, while the connection wing is on the ground floor.
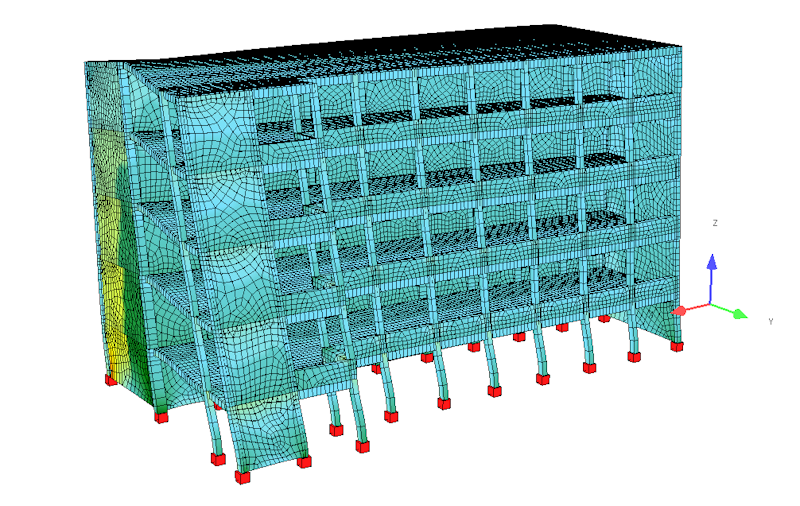
The lateral resisting system of the building is a reinforced concrete (RC) frame with a ribbed RC slab. Our numerical model of the structure was prepared within the SOFiSTiK software environment utilizing 1-D and 2-D FE elements - see Figure 3. We included partition walls in the model to accurately capture the structure’s stiffness even at lower intensities of forced oscillation.
Vibration measurement devices
As part of the monitoring, we equipped the structure with three low-noise triaxial Dewesoft IOLITE® 3xMEMS accelerometers - see Figure 4. These are 3-axial, low-noise - 25 μg√Hz spectral noise density - accelerometers with integrated DAQ and EtherCAT interface. The devices are fully waterproof with IP67 protection and can measure structural accelerations in X, Y, and Z, static inclinations, and displacements.
The devices were installed in the north wing, two on the fifth floor, the attic, and one on the fourth floor. This setup enabled measurement of the structure's behavior vertically and horizontally across the floor plan.
Analytical results versus operational modal analysis
The seismic response of the building at earthquake intensities has to be estimated using a numerical model as prescribed by the current European standard EN 1998-3. Before this, we investigated the structure’s natural frequencies and oscillation modes by applying modal analysis. Table 1 is a summary of the mode shapes and natural frequencies.
In parallel, we conducted an Operational Modal Analysis (OMA) utilizing the Dewesoft ARTeMIS OMA software tool. We based the OMA on 30-minute recordings of ambient vibration measurements from the IOLITE® accelerometers – see Figure 6. Enhanced Frequency Domain Decomposition (EFDD) technique was applied to identify the modal characteristics. Table 1 also summarizes the results of the OMA.
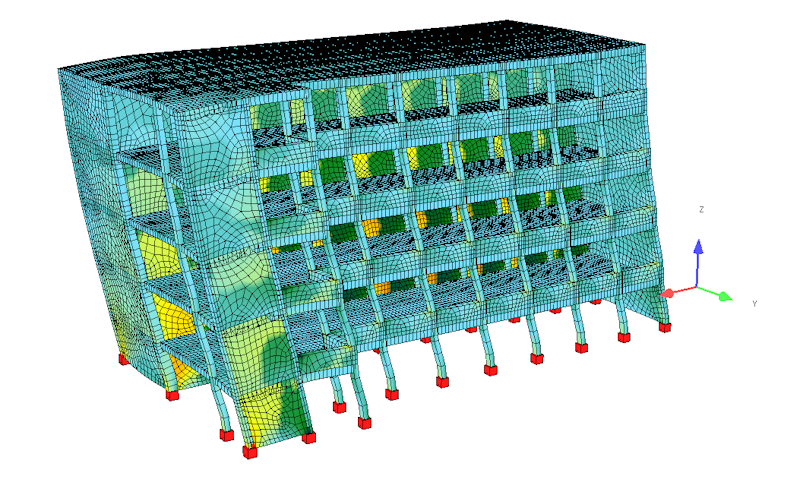
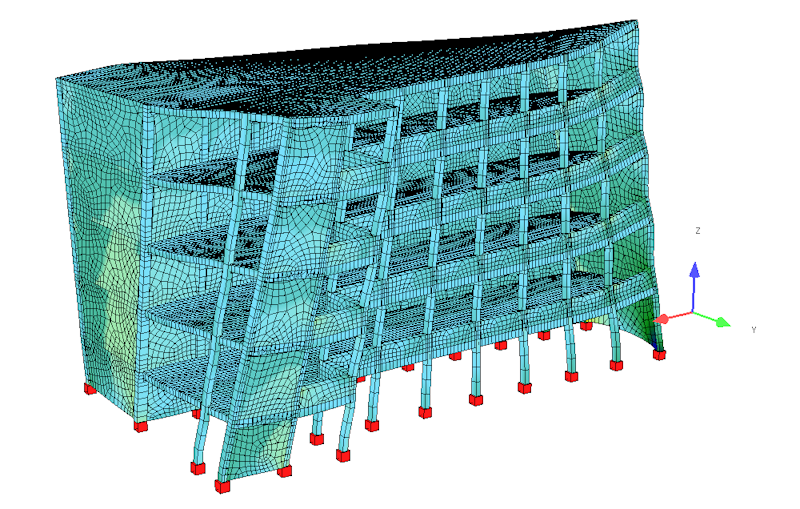
The comparison of the modal analysis results conducted on the computer model and the OMA indicates excellent agreement. The computer model and the OMA predicted the same characteristic mode shape types:
1st mode shape: in the transverse Y direction;
2nd mode shape: in the longitudinal X direction;
3rd mode shape: torsional - see Table 1 and Figures 5 and 6.
Similar findings apply to the natural frequencies of the structure, where the analytical values for the first, second, and third oscillation modes closely resemble the values estimated through OMA:
2.94 Hz,
3.13 Hz,
4.00 Hz compared to 3.11 Hz,
3.37 Hz, and
3.94 Hz - see Table 1.
The differences for the first and second oscillation modes are less than 10%, while for the third, torsional oscillation mode, the difference is under 5%.
The OMA results affirm the modal analysis findings on the computer model, bolstering our confidence in the model's representativeness. Nevertheless, it is crucial to acknowledge that precise modeling of dynamic response to low-amplitude vibrations, does not automatically ensure dependable outcomes under high amplitudes of forced oscillations. At low-amplitude vibrations, e.g., ambient vibrations, the structure behaves predominantly elastically with no building damage.
Intense forced vibration instances, such as those encountered during a strong earthquake, may lead to nonlinear behavior of the structure. Substantial damage may arise in structural and non-structural elements, e.g., infills.
FE model
| Mode shape type | Natural frequency/period | |
|---|---|---|
| 1st mode shape | Translational Y-direction | 2,94 Hz / 0,34 s |
| 2nd mode shape | Translational X-direction | 3,13 Hz / 0,32 s |
| 3rd mode shape | Torsional/rotational | 4,00 Hz / 0,25 s |
OMA with EFDD
| Mode shape type | Natural frequency/period | |
|---|---|---|
| 1st mode shape | TranslationalY-direction | 3,11 Hz / 0,32 s |
| 2nd mode shape | TranslationalX-direction | 3,37 Hz / 0,30 s |
| 3rd mode shape | Torsional/rotational | 3,94 Hz / 0,25 s |


Conclusion
The seismic assessment of the Peter Držaj Hospital conducted by SPEKTRAL d.o.o. exemplifies the intricate process of evaluating the seismic safety of existing structures. The study underscored the importance of precise modeling and understanding a building's behavior during dynamic loading. Advanced software facilitated our definition of a numerical model accounting for the primary structural elements and the impact of nonstructural elements (infills) on the structural stiffness.
Integrating Operational Modal Analysis (OMA) using Dewesoft IOLITE® 3xMEMS accelerometers added a crucial validation layer. The results indicated a remarkable agreement with the modal analysis in the computer model. This comprehensive approach, combining theoretical methodologies and experimental data, significantly enhances confidence in the accuracy and representativeness of the numerical model.
The study also highlights the need for caution when extrapolating from low-amplitude vibrations to high-amplitude forced oscillations, especially in scenarios of strong seismic events. The nonlinear behavior observed under such conditions emphasizes the importance of considering potential structural damage and the limitations of an elastic structural model.
This case promotes the need for a nuanced approach in seismic assessments to limit earthquake damageability. Assessments that consider theoretical and practical aspects to make informed investment decisions and ensure the safety and resilience of existing structures.