


Real-Time Snow Load Monitoring on Industrial Roofs

In countries like Sweden, where extreme snowfall is a growing concern, roof collapses pose serious safety and financial risks. To prevent such disasters, the company Swegon has implemented a real-time roof snow monitoring system in its main production hall, utilizing Dewesoft strain gauge technology. This synchronized system tracks structural strain and sends automated alerts when the roof snow load reaches critical thresholds, ensuring timely intervention and operational continuity.
Sweden, due to its northern latitude and climatic conditions, experiences heavy and persistent snowfall during the winter. While the design of most buildings follows national standards that account for regional snow loads, extreme events — either due to prolonged accumulation or unusually dense snow — pose a serious structural risk.
Swedish building codes (EKS – Boverket’s mandatory provisions) define snow load values based on Eurocode 1 (EN 1991-1-3), which differentiates by geographical zones. For example:
Zone 1 (southern Sweden): characteristic ground snow load ≈ 1.5 kN/m²
Zone 3 (northern mountains): ≈ 4.5 kN/m²
The design snow load on roofs must account for:
Shape coefficients (roof geometry)
Exposure and thermal insulation
Snow drifting and sliding
Load combinations (e.g., snow + wind or snow + ice)
The application challenge
Climate change is influencing precipitation patterns, leading to an increase in the frequency of wet, heavy snowfall events. Such events, though less frequent, generate higher snow densities (≥ 300 kg/m³), intensifying loads on structures.
Successive snowfall events without thawing can lead to cumulative loads exceeding design expectations. Roof geometry (e.g., valleys, parapets, or multi-level structures) can cause localized load concentrations.
Improper or delayed snow removal significantly contributes to structural overloading, particularly for large-span or low-slope roofs, such as those found in commercial or industrial buildings.
Extreme snow accumulations have caused numerous structural failures in Sweden, including:
Partial or total roof collapses
Deformation of load-bearing members
Compromised joint integrity
Historical incidents, such as the 2006 collapse of a sports hall in Katrineholm and the 2010 roof failure in Örnsköldsvik, illustrate the real-life consequences of underestimating snow loads.
Mitigation measures
Effective mitigation of risks associated with excessive snow loads requires a combination of engineering, operational, and policy-based strategies. These measures group into three main categories: structural design enhancements, maintenance and monitoring protocols, and administrative or regulatory improvements.
The standard structural resilience measures and operational countermeasures are:
Enhanced design snow load capacity margins in high-risk zones
Regular structural assessments for aging infrastructure
Load monitoring systems for critical buildings (e.g., schools, arenas)
Snow load monitoring and roof inspections during heavy snowfall events
Emergency snow removal protocols and equipment readiness
Public awareness and training for building managers
Swegon Group AB, owned by the Stockholm Stock Exchange-listed Investment AB Latour, is a market-leading supplier in the field of indoor climate, offering solutions for ventilation, heating, cooling, and climate optimization, as well as connected services and technical expertise. Swegon has subsidiaries and distributors worldwide, as well as 24 production units located in Europe, North America, and India. The company has over 3,800 employees and had a turnover of SEK 9.3 billion in 2024.
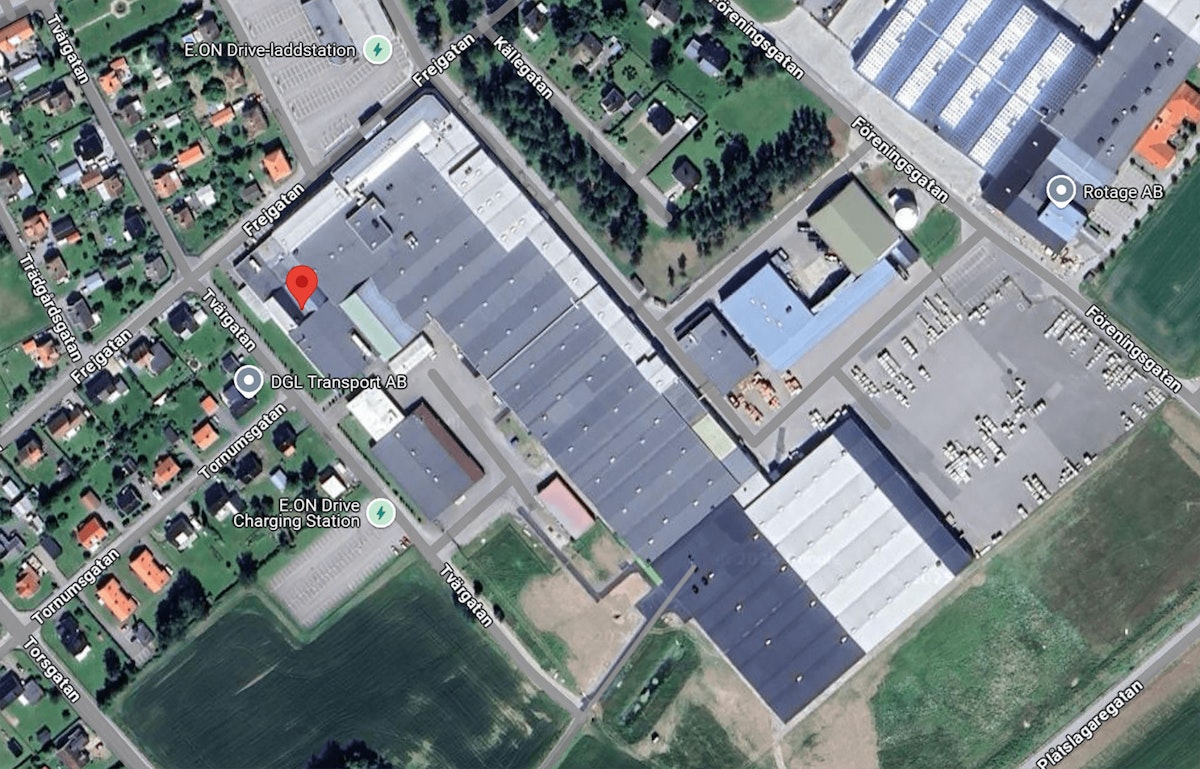
Swegon's main production building, located at Frejgatan 14 in Kvänum, is susceptible to extreme snow loads during the winter season. A potential collapse can completely disrupt the production line, resulting in days of massive economic losses (MSEK) for Swegon and posing a significant risk to the lives of the workers in the building.
The provided solution
Swegon decided to supplement its preventive measures by installing a roof monitoring solution, a comprehensive Dewesoft multiple strain gauge monitoring system. At Dewesoft, we designed and provided a monitoring system for the roof, such that when an extreme snow loading of the roof occurs, an alarm is sent to the Swegon Team to rapidly address the issue and remove snow from the roof of the main building as quickly as possible.
The system aims to measure the strains in the roof structure precisely with a fully synchronized system. The solution must integrate:
Software (DewesoftX)
Monitoring Dashboard
Connected star configuration see provided drawings)
Industrial PC
Swegon and Dewesoft specified a total of eleven strain measurement points. The setup requires two switch ports to integrate the data into a single main monitoring control cabinet. A secondary monitoring cabinet supports this. The mounting of the system is managed and handled by the internal system integrator.
The system combines both daisy-chain technology and the star configuration to meet the necessary measurement points fully. Additionally, the repeater solution enables covering the distances and ensuring the stability of the synchronized signals. The system's layout was initially defined as shown in Figure 1.


Data acquisition and measurement system
IOLITEi-1xSTG - 1 channel strain gauge amplifier
IOLITEi-1xSTG is a single-channel strain gauge amplifier (See Figure 2) featuring internal quarter-, half-, and full-bridge configurations. It offers low-noise voltage and current source excitation with freely adjustable levels.
Input voltage ranges span from ±50 V down to ±100 mV. Via EtherCAT data transfer to a PC running the powerful and user-friendly DewesoftX data acquisition and signal processing software. Typical applications are material strain measurements, precision weighing, and structural load monitoring.


IOLITEi-1xSTG key features:
Internal bridge completion (quarter and half bridges, 120 Ω & 350 Ω)
Input voltage ranges from ±50 V to ±100 mV
20 mA current input range (with internal shunt)
Adjustable voltage and current excitation (up to 400 mW)
Low-noise, high dynamic performance
Full signal and power isolation between EtherCAT and front-end
EtherCAT bus with daisy-chaining support via a single cable (up to 50 m between devices)
Full support in Dewesoft X3 software
IOLITE-REPEATER
IOLITE-REPEATER is an EtherCAT repeater node. The device allows for increasing the cable length between two IOLITE measurement devices for a lower cost than adding a measurement device. The REPEATER fits perfectly into the EtherCAT chain, daisy-chaining the signal and power from one device to the next.
General specifications of the IOLITE-REPEATER device:
Digital interface: EtherCAT
EtherCAT connectors: RJ45
Power consumption: 1200 mW
Supply voltage: 12–48 V
Operating temperature: -20 ... 60 °C
IP rating: IP20
Weight: 105 g
Housing material: Aluminum
The schematic below shows the role of the repeater in the EtherCAT chain.

.")
The final solution of the system combines both daisy-chain technology (see Figure 4) and the star configuration (see Figure 5) to fully meet the necessary measurement points. Additionally, the repeater solution (see Figure 6) covers the distances and ensures the stability of the synchronized signals. Figure 8 illustrates the final combined solution.


 to cover long distances and guarantee the reliability of the system.")


The DAQ software
Sensor balancing
DewesoftX enables sensor balancing. For the values to be correct, it is necessary to balance and zero all channels at a reasonable time. A reasonable time is during a warm summer day when the risk of snow and other adverse conditions is minimal, to establish a good starting point for all sensors.


Recorder view
The recorder displays all analog signals on its plots, allowing you to easily see that all channels are outputting a signal, as well as what the signal looks like. On the left side, you see the channel name and color to easily know which channel belongs to which strain gauge in your area (See Figure 9).

Data visualization view
The Visualization page distinctly displays all signals. The page also indicates two warning levels: 100 micrometers per meter and 700 micrometers per meter. If one of the bars were to reach 100, the bar changes color to yellow, and if it goes to 700, the bar changes color to red. The yellow lines you see that differ between all the bars are the minimum and maximum values that the signal has reached (see Figure 10.


Comparison View
The Comparison page displays all signals on the same plot, combined. This page enables easy comparison of all signals. There are also three lines, but we set the limit values to easily see which one or more have exceeded the lines (see Figure 11).

Monitoring dashboard
The dashboard page shows the exact location in the building of all sensors and four lights, green, yellow, orange and red that characterize if, and which sensor has reached the given limits (green when it is below 100 micrometers/meter, yellow if it is above 100, orange when it has reached 350 and red if it is above 700).
The exact values of each signal are displayed next to it, allowing you to view the values the sensors have recorded easily. At the bottom right, you see all IOLITE serial numbers and their given names. The numbers under the green square are the last two digits of the serial number.

Notifier
Notifier allows you to send notifications to specific email addresses. To send emails to the selected address, you first choose which email address it should come from. If the email address is a Gmail account, you can use the same SMTP server and Port (TLS) as shown in picture 5.
The username is the email address, and the password is an app key that you request from Google (the key above is already a pre-made key that you can use to create more “notifiers”). “Receiver” is the email address that you wish the email to go to, and if you want more addresses to receive the same notification, put “;” after each address (see Figure 14).


Alarms
The alarm limits are defined by different conditions, both when it is below the limit and when it returns to being above the limit. To change the alarm limits, press the setup button, which in turn opens a new tab. To change the limit, push the value to the right of “Trig level”. After changing the value, press OK, and you will see the new value on “Trig =” (See Figure 15).


Conclusion
Mitigating the risk of extreme snow loads in Sweden requires more than adherence to code—it necessitates proactive engineering, intelligent monitoring, and disciplined operational readiness.
With climate variability expected to increase the frequency and intensity of extreme snowfall events, it is incumbent upon designers, operators, and regulators alike to ensure Sweden’s building stock remains resilient. Investing in long-term mitigation strategies is not only a matter of safety but also one of sustainability and economic foresight.