Table of contents
Browse categories
Browse authors
 AB
ABAlberto Boffi
 AL
ALAlessia Longo
 AH
AHAl Hoge
 AB
ABAljaž Blažun
 BJ
BJBernard Jerman
 BČ
BČBojan Čontala
 CF
CFCarsten Frederiksen
 CS
CSCarsten Stjernfelt
 DC
DCDaniel Colmenares
 DF
DFDino Florjančič
 EB
EBEmanuele Burgognoni
 EK
EKEva Kalšek
 FB
FBFranck Beranger
 GR
GRGabriele Ribichini
Glacier Chen
 GS
GSGrant Maloy Smith
 HB
HBHelmut Behmüller
 IB
IBIza Burnik
 JO
JOJaka Ogorevc
 JR
JRJake Rosenthal
 JS
JSJernej Sirk
 JM
JMJohn Miller
 KM
KMKarla Yera Morales
 KD
KDKayla Day
 KS
KSKonrad Schweiger
Leslie Wang
 LS
LSLoïc Siret
 LJ
LJLuka Jerman
 MB
MBMarco Behmer
 MR
MRMarco Ribichini
 ML
MLMatic Lebar
 MS
MSMatjaž Strniša
 ME
MEMatthew Engquist
 ME
MEMichael Elmerick
 NP
NPNicolas Phan
 OM
OMOwen Maginity
 PF
PFPatrick Fu
 PR
PRPrimož Rome
 RM
RMRok Mesar
 RS
RSRupert Schwarz
 SA
SASamuele Ardizio
 SK
SKSimon Kodrič
 SG
SGSøren Linnet Gjelstrup
 TH
THThorsten Hartleb
 TV
TVTirin Varghese
 UK
UKUrban Kuhar
Valentino Pagliara
 VS
VSVid Selič
 WK
WKWill Kooiker
Performance Testing of Electric Formula Student Race Car
Žiga Zver, Technical Leader
UNI Maribor Grand Prix Engineering formula student team
February 4, 2025
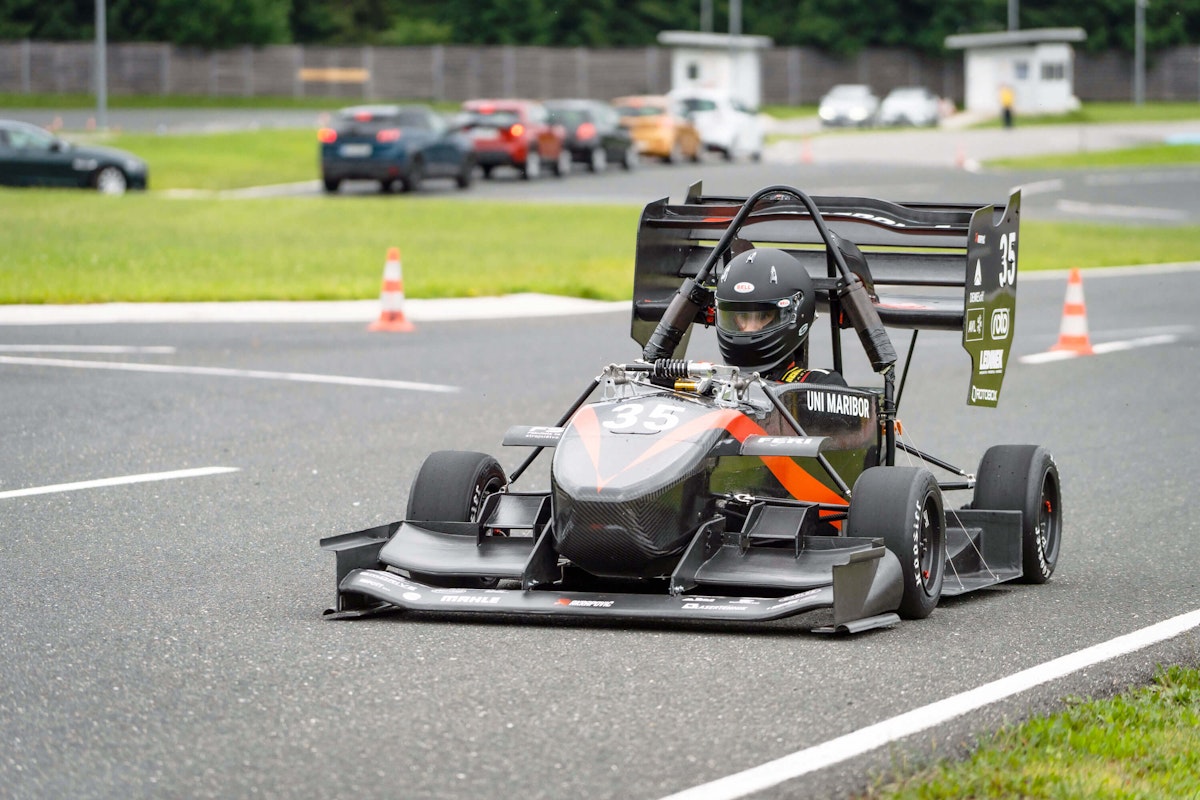
The UNI Maribor Grand Prix Engineering Formula Student Team from the University of Maribor tested its first electric Formula Student race car, built in 2024. The goal was to optimize the car’s performance for the competition by analyzing its acceleration, endurance, and aerodynamics. With support from Dewesoft, the team used advanced measuring devices to monitor the car’s performance. The testing provided crucial insights into the car’s electronics, performance, and driving dynamics, helping the team enhance their vehicle's competitiveness.

Uni Maribor Grand Prix Engineering is a student project under the mentorship of the University of Maribor's Faculty of Mechanical Engineering. We are a team of young aspiring adults with the same passion for motorsport and innovation. With the help of the faculty and our sponsors, we manage to develop and manufacture new race cars every year.
In 2024, we embarked on a journey to innovate and embrace sustainable technology with our first electric Formula Student car. The quiet hum of the electric motor and the drive towards a greener future have united our team in this new adventure. This shift represents more than technological progress; it reflects our commitment to excellence and environmental responsibility.
Formula Student
As a team, we compete in some of the world's most fantastic Formula Student competitions in Europe. Our choice of materials reflects our goal to create a lightweight and reliable car. Most components are constructed from carbon fiber composites, increasing the car's strength and reducing its weight.
Formula Student is a global engineering competition that challenges university students to design, build, and race a formula-style race car. Teams from various universities worldwide participate in this annual event, showcasing their design, manufacturing, testing, and business presentation skills.
The competition emphasizes the technical aspects of building a high-performance race car and encourages students to develop project management and teamwork skills. Participants must adhere to strict rules and regulations while pushing the boundaries of innovation to create a well-rounded and competitive vehicle.
Measurement object
We named our first fully electric racing car Missy. An electric motor that develops 86 kW powers the 185-kilogram Missy, which can accelerate to 100 km/h in just 3.1 seconds. It draws energy from a battery pack with a capacity of 7.7 kWh, sufficient for approximately 30 kilometres of electric autonomy on the racetrack.
Missy - Technical Details
| Specification | Details |
|---|---|
| Year of manufacturing | 2024 |
| Mass (kg): | 185 |
| Max power (kW): | 80 |
| Acceleration (0-100 km/h) | 3,1 s |
| Frame | Carbon monocoque |
| Wheels | Carbon 10″ |
| Engine | Emrax 208 |
Our race car must operate flawlessly and reliably in a competition, so testing the vehicle is important from several perspectives. The most important aspect is to test and prepare the car for competition, as testing allows us to identify and address any mistakes or issues.
Various problems can occur, such as mechanical, electrical, and software issues. The purpose of testing is also to gather data that can later be analyzed and used for further upgrades or improvements, as well as for validating the current race car and testing different settings.
We applied measurements and data acquisition to facilitate troubleshooting, diagnostics, and monitoring of the car's behavior while driving. Collecting and storing data while driving is essential, as it enables us to identify causes and potential improvements to the entire system during later analysis.
Selection of appropriate measuring devices
The choice of suitable measuring devices depends on the testing method and the purpose of what and how we want to measure. In this work, we received significant support from Dewesoft, which specializes in conducting measurements and producing measuring devices.
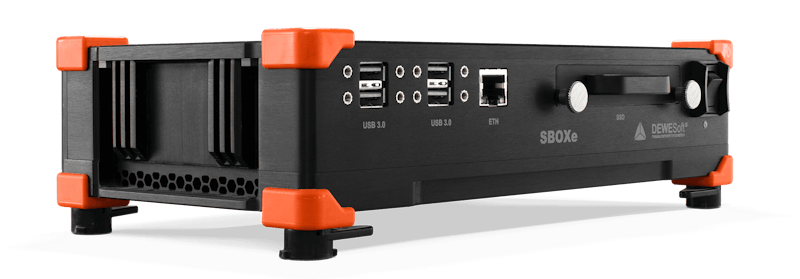
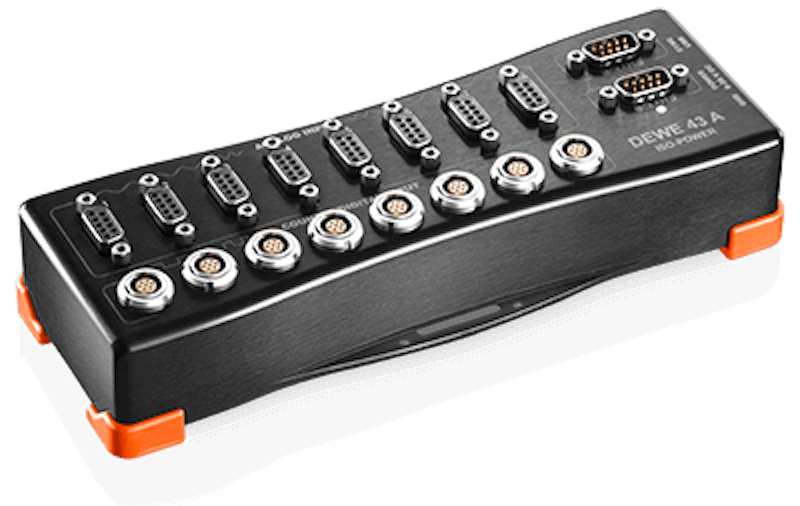
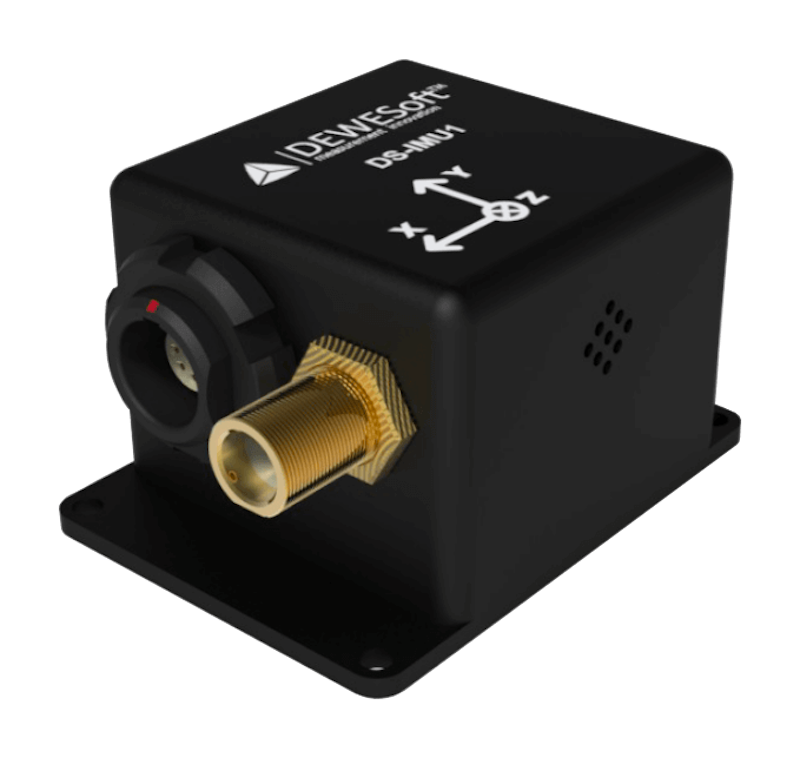
Based on our measurement needs, we used three instruments from Dewesoft's offer, which the company provided under a sponsorship agreement. We use the following measuring devices or modules: Dewesoft SBOX, Dewesoft DEWE-43A, and Dewesoft DS-IMU1.
Hardware and software used
SBOX: a powerful data processing computer and highly reliable SSD data logger
DEWE-43A: a versatile 8-channel USB data acquisition system with a hand-size footprint
Eight universal analog inputs, eight digital/counter/encoder inputs, and two high-speed CAN bus inputs
DS-IMU1: compact and rugged inertial navigation system
GPS antenna
DewesoftX software: software for signal measurement, data recording, signal processing, and data visualization


The Dewesoft SBOX is a computer that serves as data storage and for later export of this data. This computer also allows real-time monitoring and review of the measurement values. It also provides access to the licensed DewesoftX software. Additionally, it has an integrated 10 Hz GPS (Global Positioning System), allowing data capture every 100 ms.
The Dewesoft DEWE-43A is an amplifier, meaning it converts the analog signal measured from the load cell or sensor into a digital format. Such devices are ADC (Analog to Digital Converter) devices. Besides serving as an amplifier, it also can read direct CAN (Controller Area Network) communication.
The Dewesoft DS-IMU1 is a measuring instrument that functions as a GPS and an accelerometer. This device helps track the vehicle’s location, measure accelerations, slip angles, etc. It also works as a gyroscope, providing data on the pitch angle of the car during braking or acceleration.
Installing the equipment onto the race car
We installed the equipment in the most suitable locations where we could ensure proper mounting, functioning, and appropriate signal connections. The SBOX and DEWE-43A are the primary devices to which we connect all other measuring devices and sensors - see Figure 2. Therefore, they were mounted above the rear section of the monocoque and secured with tightening straps to allow access to all connections.
We positioned the gyroscope or accelerometer DS-IMU1 as close to the center of gravity as possible to achieve the most accurate measurements. It was mounted directly in the center of the monocoque, slightly forward of the driver's seat - see Figure 3.
The GPS antenna must be mounted on the vehicle's exterior to ensure unobstructed satellite access. We, therefore, installed it on the upper front section of the monocoque—above the steering wheel - see Figure 4.
The race car uses two separate CAN lines:
CAN_1: This line is the HV battery line connected to the Vehicle Control Unit (VCU). The VCU controls the powertrain and general vehicle functions, such as interfacing with pedals, lighting systems, etc.
CAN_2: The line connects the VCU and the inverter.
These two lines transmit a significant volume of essential data that the system needs to capture during measurements. We have prepared diagnostic connectors for both lines at our data acquisition device connections - see Figure 5.
Software settings
Dewesoft devices come with the software DewesoftX, which is relatively user-friendly. Before starting measurements, it is necessary to configure all parameters and calculations and select the appropriate modules and channels, etc. - see Figure 6.
Configuring the can lines
We have two CAN lines in the race car, so we also need two CAN input channels, which we capture with the Dewe-43A device. In the settings, we select the correct communication speed of 500 kbit/s. We also chose the communication mode, which, in our case, is 'Read only,' as we only aim to capture the values. See the settings in Figure 7.
The next step is to decode the messages. We do this by importing our pre-prepared file that contains the information for decoding the messages. Before carrying out the measurements, we must click the 'Store all messages' setting to save all messages during the drive.
The purpose of monitoring the messages is to ensure that all data in the vehicle is synchronized over time, allowing for further comparison of values at the exact moment. It is also important to record everything in one place and be ready for further analysis or use of the captured data. The information we capture on the CAN lines includes the following:
CAN_1:
Minimum cell voltage,
Maximum cell temperature,
HV battery voltage,
Current,
and more.
CAN_2:
Engine RPM,
Motor torque,
Motor temperature,
Bridge temperature,
Phase current,
and more.
Execution of measurements
We conducted the exact measurements over several days to achieve goals we can categorize by discipline, such as acceleration, endurance, or aerodynamics testing. These tests were carried out during routine and targeted testing sessions, with the measurement location being a karting track. During the testing period, we primarily oriented ourselves according to the weather. We wanted the external conditions to be similar to those at competitions.
To enhance data monitoring during the drive, we established live telemetry and implemented communication with the driver - see Figure 10. This communication allowed us to achieve the desired driving styles better and analyze potential issues or changes more quickly.
Before starting the testing, we always recorded the initial settings of the race car, including the car's weight, tyre temperatures, and pressures. We verified the functionality of all sensors and devices. We also noted the external conditions, such as air temperature, asphalt temperature, wind speed, etc.
Results and comparison
We followed up our measurement execution by analyzing the results by creating graphs and tables based on the data to facilitate comparisons, see Figure 12, between measurements and simulations or between current and previous measurements.
We conducted an acceleration test using the Dewesoft brake test module to select the acceleration mode, which allowed us to obtain the acceleration times. Acceleration is a competition discipline, and the test length is 75 meters.
We tracked and recorded the path of the race car using the GPS unit on the DS-IMU1 - see Figure 13. With this precise knowledge of the car's trajectory, we can accurately identify where potential errors or changes occurred on the track and determine the speed and acceleration in specific corners or straight sections.
We analyzed data from the CAN lines in the race car. In Figure 14, you see the voltage of the HV battery, the temperature at the bridge in the controller or inverter, and the reference torque.
Conclusion
Using Dewesoft equipment, we could quickly diagnose software-related issues as we monitored all electronic devices in the vehicle via the CAN lines. We also gathered valuable data that informs us about utilizing our components and what occurs during driving.
We could accurately determine the vehicle's speed using GPS, which was particularly beneficial during specific tests. We also obtained distance data to assess the race car's range. Additionally, we conducted an acceleration discipline similar to what we have in competitions.
Since we also have an accelerometer, we were able to measure acceleration at specific moments or corners, particularly in the case of lateral acceleration of the vehicle.