


Optimizing Formula SAE Suspension Through Tire-Road Force Analysis
Angelo Cuccurullo, Giovanni Marciello, Antonio Longobardi and Angelo Lo Sapio
UniNa Corse Racing Team, University of Naples
January 30, 2025
During the 2023/2024 season, the UniNa Corse Racing Team from the University of Naples developed and tested its first fully electric race car. A key focus was optimizing the suspension by analyzing tire-road forces and validating a dynamic model. Working with Deltatech, Megaride Srl, and Dewesoft, the team used advanced sensors and data acquisition tools for precise measurements.
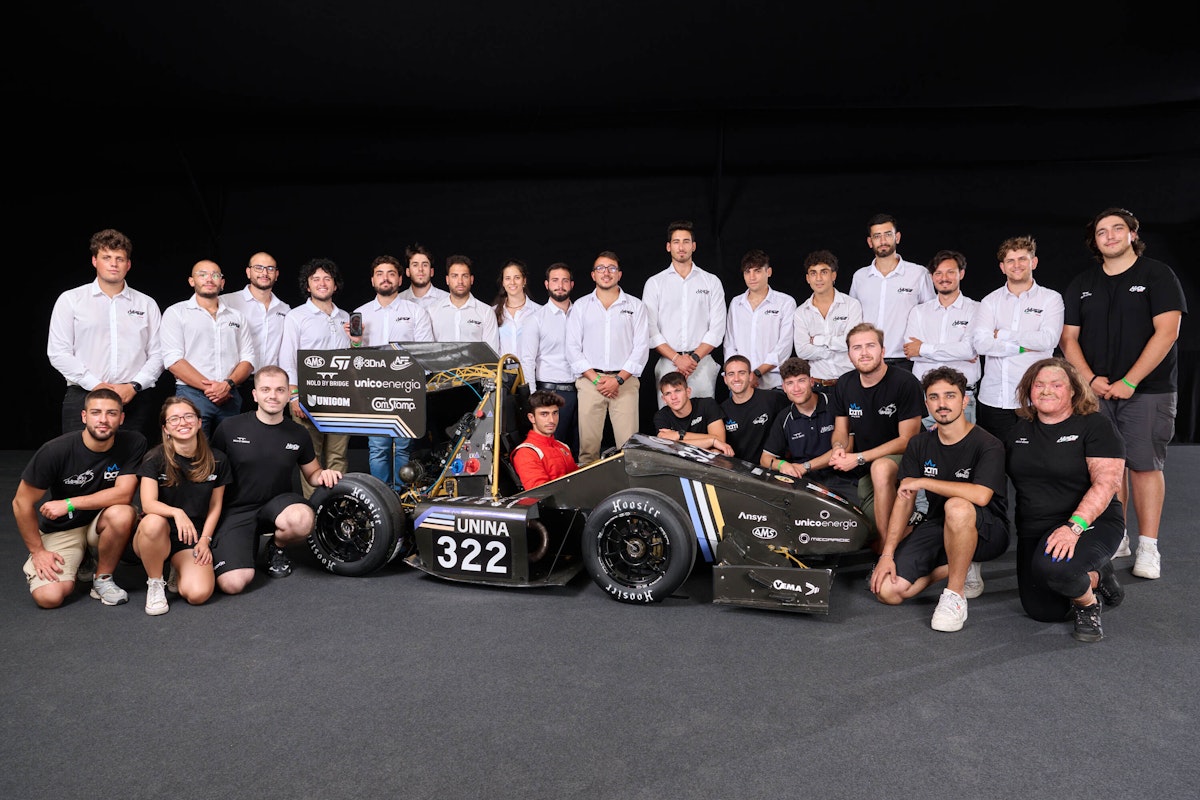
Founded in 2010, the UniNa Corse University racing team designs, builds, and tests a single-seater. They compete in the Formula Student World Championship. The University of Naples lets all team students compete in the international Formula Student SAE competition. This helps them improve their skills and provides a unique experience.
In the 2023/2024 season, the UniNa Corse Racing Team switched from a gas car to a new fully electric car. This decision reflects their commitment to sustainability and innovation.
The team ran several tests on the track, checking the vehicle's predictive dynamic model and estimating the stress on the suspension arms.
Thanks to working with Deltatech and Dewesoft, the team ran a measurement campaign. This campaign aimed to find the loads on the vehicle's suspension system.
Dewesoft provided a workshop for our engineers. They also took one of our team members to Slovenia for training. There, he participated in an enhancement course with Dewesoft technicians and learned more about the potential of DewesoftX software.
Formula Student and the car
Formula SAE is an international university competition for engineering design, initially proposed by the Society of Automotive Engineers (SAE). Students design and produce a small racing car, ensuring on-track safety and promoting clever problem-solving. They drive the prototype race car at different events, where judges evaluate its design qualities and engineering efficiency.
The Racing Team UniNa Corse from Federico II di Napoli has taken part in this competition since 2015. They compete with a vehicle that uses an internal combustion engine. Since 2021, the team has also implemented autonomous driving on its cars. During the 2024 season, the team designed the new and first electric vehicle, which will compete starting from the 2025 season.
The team completely revolutionized the new electric car’s kinematics. We found it important to understand the real loads on the vehicle. This helps us improve the change and reduce risks from incorrect evaluations.
The testing session with Dewesoft helped the team check the dynamic model of the combustion car. It also gave them important knowledge for designing the new suspension system of the electric vehicle.


Sensors and measuring instruments
The setup for carrying out the measurements included the use of various sensors; of these, the main ones are:
| Measurement Value | Sensor | Conditioning/Acquisition |
|---|---|---|
| Vertical wheel forces | Strain gauge | Half/Full Bridge amplifier |
| Shock absorber relocation | Linear potentiometer | 5V analog input |
| Wheel speed | Hall Effect sensors | Counter input |
| Steering angle | Linear potentiometer | 5V analog input |
| Brake pressure | Pressure sensor | Voltage input |
| Vehicle acceleration | IMU | CAN bus |
| Engine Control Unit (ECU) | MaxxEcu Race H20 | CAN bus |
In particular, we chose T-shaped strain gauges with two orthogonal 350 Ohm resistive grids from Micro-Measurement. We placed strain gauges on the A-arms, Pull-Rod, and Tie-Rod on the left side of the car. We used a full-bridge setup with two rosettes for each arm. This configuration allowed for greater measurement sensitivity and rejected the effects of temperature variation and bending moment.


Thanks to the SIRIUSwe-HD-16xSTGS data acquisition system provided by Dewesoft, we could acquire and record 16 channels. This included eleven strain gauges and five linear potentiometers. Dewesoft also provided the DS-IMU1 inertial measurement unit and DS-CAN2 CAN bus logger. Both are important tools for getting the vehicle's acceleration and position values. They also access all its sensors through the CAN line.


We connected all the instruments to an onboard computer. This computer managed all the data collection during the tests. We used a sampling frequency of 100Hz.

Model
To connect the strain from the strain gauges with the outside loads on each wheel's contact patch, we created and studied two models.
The first model uses the loads acquired by the strain gauges to calculate the forces acting on the tire contact patch. This calculation allows a precise quantification of the effect of the deformations on the forces transmitted to the ground.
The second model works differently. It starts with the forces on the contact patch. Then, it calculates the loads that affect the arms or other parts of the suspension. Such calculation helps to understand how the forces on the tires translate into structural loads on the vehicle.
This two-way approach helps our math models check each other. This ensures we fully understand how vehicles and tires interact.
The introduction of the TRICK. (Tire-Road Interaction Characterization & Knowledge) tool provided by Megaride Srl is crucial in this context. TRICK uses a physical model of the vehicle based on a "backward" approach. It analyzes experimental signals from onboard sensors to evaluate dynamically varying quantities, such as the vehicle's slip angle. This tool creates detailed "virtual telemetry." It includes tire data like forces, wheel position, and slip angle estimates for each corner.
This tool is essential for checking the math model. It connects the forces measured by strain gauges to those on the contact patch. Its strength and accuracy have been tested in many situations with dynamometer wheels. This improves the overall accuracy of the analyses. It also provides important support for research and development in vehicle dynamics.
In conclusion, using TRICK in the analysis method helped us get precise and accurate data. This data on tire-ground interaction forces is very important. It helps validate and improve the other models we use.
We will describe our mathematical model below.


We have to make some preliminary assumptions to calculate the reaction forces on each suspension element, such as:
All suspension components are rigid
The components subjected to axial forces only
Each suspension group is in a static equilibrium
| No. | Axle | Name | Acronyms |
|---|---|---|---|
| 1 | Front | Tie rod | TR |
| 2 | Front | Lower triangle – Forearm | FLWF |
| 3 | Front | Lower triangle – Aft arm | FLWA |
| 4 | Front | Upper triangle – Forearm | FUWF |
| 5 | Front | Upper triangle – Aft arm | FUWA |
| 6 | Front | Push rod | FPR |
| 7 | Rear | Fake tie rod | FT |
| 8 | Rear | Lower triangle – FForearm | RLWF |
| 9 | Rear | Lower triangle – Aft arm | RLWA |
| 10 | Rear | Upper triangle – Forearm | RUWF |
| 11 | Rear | Upper triangle – Aft arm | RUWA |
| 12 | Rear | Pull rod | RPR |
First, we must define the Cartesian coordinates of the suspension system's characteristic points concerning a reference point. In this case, we chose the center of the vehicle at ground level as the reference point.
For each suspension element, we find the distance between two points that define the arm. One point is outside and connects to the hub. The other point is inside and connects to the frame. Finally, we find the direction vector. We do this by normalizing the difference between the two points. This creates a matrix that shows the strength of the forces acting on the single arm.
We also looked at the moments of the arms. We calculated these moments using the same reference point we chose before. This gave us one matrix that includes the forces and moments of each arm.
The team can use this matrix to show the forces on the tire contact patch. It also shows the moments created by these forces around the center point of the wheel at ground level.
The FLArms matrix represents the axial reaction forces of all suspension components.
Using these formulas, we calculated the size of the axial forces for each suspension part. This was based on the vehicle's static vertical load (Fz).
The vehicle was sensorized with strain gauges only on the left side. We made this decision based on the test circuit. It put more load on the left side of the car. We also considered the car's symmetrical structure. The strain gauges on one side were enough for an accurate evaluation.
After setting up the model to study the forces on the contact patch, we used data from the strain gauges. We then compared the results from TRICK with the formulas listed below.
Below, we share the formulas that look at the static and dynamic parts of the vertical loads on each wheel.
In a vehicle reference system, we can calculate the lateral axle forces. These forces relate to the vehicle's lateral balance. We find the lateral loads after a yaw derivation operation. This is done by solving a system of equations
For a rear-wheel drive vehicle, we can estimate the longitudinal loads. This assumes that tangential forces match vertical forces
For deceleration maneuvers, the load for each wheel is:
For acceleration maneuvers, the load for the front wheels
The load on the rear wheels is instead:
Data analysis and results
We ran our test campaign at the Circuito Internazionale Del Volturno. It is the ideal place to test the strain gauges in various working conditions. It features long straights, constant radius curves, and mixed areas.


After completing the data collection phase, we first examined the quality of the acquisitions. The results were very good. The high sampling frequency from the Dewesoft hardware let us filter data accurately. Dewesoft hardware enabled us to perform data filtering operations without compromising their accuracy.
The images below show the contact patch force for the front and rear. This uses the models we described earlier: strain gauges (SG) and the vehicle's physical model (TRICK).


We found that the correlation between the two models is 84%. It can reach as high as 90% for the Fy.


We need to look at the front wheel's Fx negatively. It has a weaker correlation because of the steering. Its trend is also less consistent than the others.

Conclusion
This study successfully validated mathematical models correlating forces on the suspension system with tire-road interaction forces. The data was collected using strain gauges. It was supported by Dewesoft’s technology and Megaride’s TRICK tool. The results showed a strong link between physical models and sensor measurements.
Validating the calculation tools was essential to determine the limits and reliability of the mathematical model created. This validation helped predict the forces affecting the suspension system of the team's new electric single-seater. These insights will guide the design of the electric vehicle’s suspension, ensuring structural reliability and optimized functionality.
Thanks
We thank the whole Dewesoft Italia team. Special thanks go to Riccardo Petrei and Gabriele Ribichini. They made this test campaign possible. We also appreciate Marco Ribichini for his constant technical support. He was always there during installation and on-track testing.
We thank Megaride Srl for its support and for allowing us to use its TRICK tool.
We finally thank the entire UniNa Corse team.