


Motor Efficiency and NVH Testing on High-Speed E-axle Drive

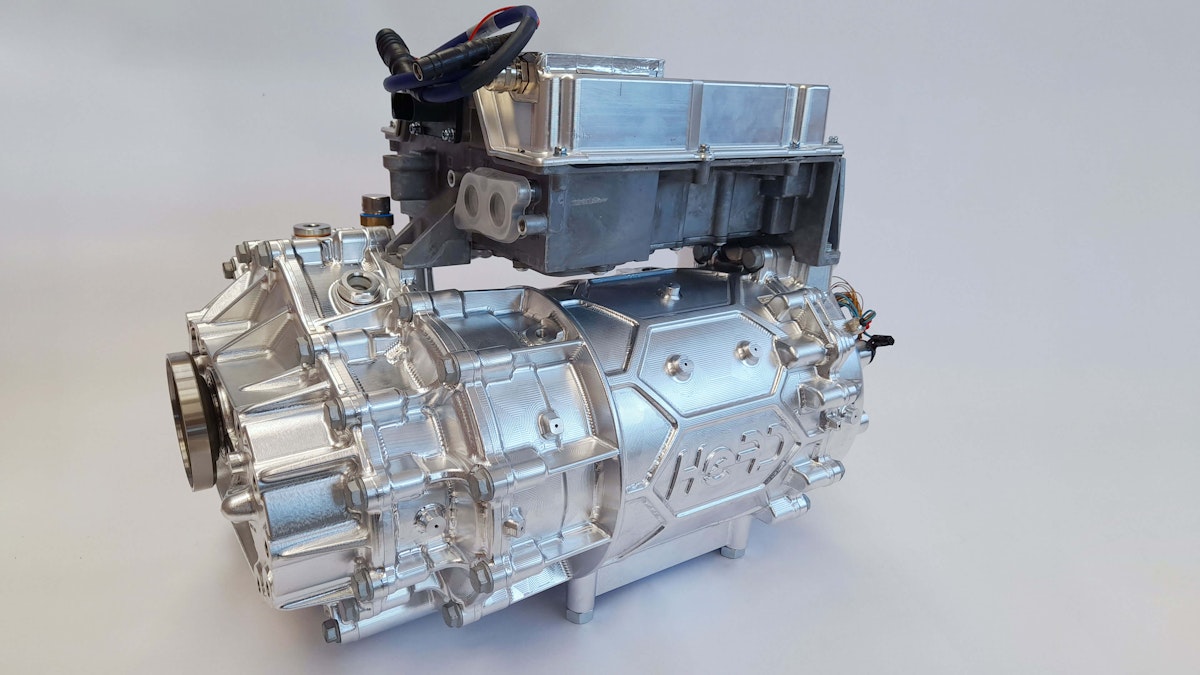
The HeAD (High-performance electrical Austrian Drivetrain) project developed a compact, integrated motor/gearbox drive for electric vehicles. The electric axle drive reaches a max speed of 24.000 RPM and axle torque up to 3000 Nm. All in a compact form factor suitable for integration on both the front and rear axle.
To achieve this, the project leader, Zoerkler Gears GmbH & CO KG, needed to complement its existing test beds with additional types of measurements. Dewesoft provided the solution for Kristl Seibt testbed integration and drive efficiency testing.
Nowadays, electric and hybrid vehicles use several core components for vehicle propulsion. These components, including an electric motor, power electronics, and a gearbox, are integrated into a single unit installable in the vehicle's axle assembly.
From 2021 to 2023, the Austrian HeAD project aimed to develop a highly integrated, high-powered electrical drive axle for automobiles using innovative control technology. The project included innovations such as:
High drive speeds of 24000 RPM
A novel battery cooling system
Integration of the gearbox and the drive control
The project’s scope pushed Zoerkler to develop and complement its existing test beds with additional types of measurements. The engineers searched for a measurement system capable of covering:
Power Analysis between inverter and motor,
High-frequency voltage-switching, and
Collection of CAN bus and vibration data.
For the smoothest operation, the system should also be fit for integration with the Kristl Seibt testbed.
The HeAD project
Besides Zoerkler Transmission Systems, the HeAD consortium included three more Austrian companies and the Institute of Energy Systems and Electrical Drives (ESEA) at the Technical University of Vienna (Technische Universität Wien (TU Wien).
The Austrian Research Promotion Agency (FFG) and The Federal Ministry for Climate Action, Environment, Energy, Mobility, Innovation and Technology (BMK) supported the HeAD project under the program named Future Mobility.
HeAD specifically developed the e-axle for cars that require a very compact design. The project developed the drive unit and battery in parallel to create a complete system with optimal performance. Its integrative structure allows installation as both front and rear axles.
The HeAD e-axle specifications
| Specification | Value |
|---|---|
| System Voltage | 800 V DC |
| HV-DC Interface: | 420-870 V DC* |
| Max. Performance (10s, 645 V DC): | 140 kW @ 350Arms |
| Max. Torque (10s, 645 V DC): | 3.020 Nm @ 350Arms |
| Max. Engine Torque (10s, 645 V DC): | 200 Nm @ 350Arms |
| Max. Speed (1.600rpm): | 180 km/h |
| Gear Ratio (Dyn. Roll radius = 308mm): | 15,04 |
| Mass: | 65 kg |
| Box Volume E-Axis: | 47,4l |
| Battery Capacity: | 60 kWh |
| Coolant Volume Flow: | 10 l/min |
| Planned Range WLTC | 450 km |
| Battery Module Mass (14 modules included) | 25 kg |
Zoerkler Gears GmbH & Co KG
Zoerkler develops and manufactures high-quality transmission systems for the international industry, including automotive, aerospace, and railway.
The Zoerkler test services include testing various gearboxes, transmissions, and other drivetrain components. Zoerkler has test stands for testing universal gears and tail rotor shafts, hydraulics, pumps, fatigue limits, brakes - and even helicopter main gearboxes.


Testing the electric axle
A wide range of measurement tasks and data analysis was required to test the e-axle, such as power and motor efficiency analysis and measuring NVH and temperatures. Dewesoft offered a versatile, flexible solution, remotely controllable by a Krist Seibt Tornado test bed, and allowing the engineers to acquire all the various signals synchronously during the measurement - see Figure 2.


Synchronously capturing the e-axle drive’s electric power input and mechanical power output, Dewesoft provided a system for the required motor efficiency testing.
The electrical input power is calculated based on the measurement between the inverter and the motor. These are frequency-variable 3-phase voltages and currents requiring a wideband Power Analyzer capable of sampling at high rates.
The mechanical output power involves the measurement of the torque and speed. Again, this requires high-frequency inputs. In this case, Dewsoft SuperCounters with 100 MHz bandwidth are perfect for getting out the best of the sensor resolution.
Zoerkler, in addition, was looking for a system capable of acquiring the vibration data of the different testing scenarios. Data to identify critical operation states and unwanted noisy behavior and indicate its root cause.
Finally, the integration in the existing Tornado test bed was a must-have. For real-time data transmission, the engineers specified a list of around 150 reduced variables, such as efficiency, speed, electrical frequency, and single-phase RMS values. DewesoftX stored the high-speed raw data in the standard Dewesoft data format, exportable in multiple file formats.

Michael Skalka, Head of Test Bench, says: “The support from Dewesoft during commissioning and test runs was uncomplicated, spontaneous, and very professional.”
Data acquisition instrumentation
Data acquisition hardware
SIRIUSi-XHS-4xHV-4xLV: 8-channel high-speed (15 MS/s) and high bandwidth power analyzer (5 MHz) with CAN input port.
SIRIUSi-PWR-MCTS2: Power supply unit for the current transducers.
MCTS-1000N: four current transducers, each set consisting of IN-1000-S zero-flux transducers, DSI-MCTS-1000N shunt cables, and connector cables 5m.
SIRIUSi-4xHV-4xLV+: Universal 8-channel data acquisition system for the torque and speed measurement.
SIRIUSi-6xACC-2xACC+: 8-channel data acquisition system for NVH measurements (IEPE).
HBK T40 torque transducer: Up to three sensors for measuring mechanical power.
IEPE accelerometers: Two IEPE accelerometers for vibration measurement.
PC: CPU AMD Ryzen 9 3900X, 12x 3.80 GHz, 32 GB RAM, GPU: ASUS RTX3060 O12G V2 12 GB, SSD used for 15 MHz live Power calculation on the Nvidia GPU (CUDA).
Data acquisition software
DewesoftX professional: Dewesoft’s standard software package for data recording, visualization, and analysis.
DewesoftX power option: SW plugin for electrical Power measurement (P, Q, S, harmonics, etc.).
DewesoftX Rotating Machinery Analyzer package: a set of DewesoftX options for rotating machinery analysis. The order tracking module mainly extracts the harmonics on the DC (battery) side.
DewesoftX CA-TESTBED module: DewesoftX add-on for connecting to the Kristl Seibt (KS Engineers) Tornado Testbed.
Electrical power analysis
The Dewesoft SIRIUS XHS Power Analyzer handles the power measurements. The analyzer measures voltages and current on the battery (DC) and the 3-phase voltages and current between the inverter and motor.
When working with a low-percentage PWM signal, 2000V inputs and a high sampling rate of 15MHz are required to acquire the short needle pulses of the inverter. Since the motor has no star-point accessible, an external star-point-adapter provided a virtual zero-reference for measuring the exact single 3-phase voltages.
Since efficiency measurement requires the highest possible accuracy, we applied zero-flux current transducers with a measurement accuracy of 0.015%. We opened the orange high-voltage (HV) cable shield to maintain the highest precision measurement on the line without its influence. The compact Dewesoft Multi-Channel Current Transducer System (MCTS) unit provided a stable supply voltage for the transducers.


 side after the battery simulator.")
The motor efficiency analysis
In addition to the electrical measurements, calculating the motor efficiency requires measuring the mechanical parameters. How much mechanical power will we get out? How fast will it be able to run in the end?
Engineering calculates motor efficiency by analyzing various mechanical and electrical parameters to assess how effectively an electric motor converts electrical energy into mechanical work. The efficiency of an electric motor is typically determined using the formula:
Motor Efficiency (%) = (Output Mechanical Power / Input Electrical Power) x 100.
Output mechanical power
This parameter represents the electric motor’s beneficial mechanical work or power output. It can be determined using the following formula:
Output Mechanical Power (in watts or horsepower) = Torque (in Nm or lb-ft) x Angular Speed (in radians per second or revolutions per minute).
Torque (Nm or lb-ft) is the rotational force generated by the motor, and it can be measured using torque sensors or calculated based on force and lever arm measurements.
Angular Speed (radians per second or RPM) is the rotational speed of the motor's output shaft and can be measured directly using tachometers or encoders.
Input electrical power
This parameter represents the electrical power consumed by the motor to produce the mechanical output. It can be determined using the following formula:
Input Electrical Power (in watts) = Voltage (V) x Current (A).
Voltage (volts) is the electrical potential difference across the motor terminals, typically measured using a voltmeter.
Current (amperes) is the electrical current flowing through the motor windings, typically measured using an ampere meter.
Once you have these values, you can calculate the motor efficiency by plugging them into the efficiency formula.
The resulting efficiency value is expressed as a percentage and represents how well the motor converts electrical energy into beneficial mechanical work. Higher motor efficiency indicates that the motor more effectively converts energy and produces less waste heat.
Torque is a critical parameter describing the rotational force generated by an engine or motor. It is typically measured in units like Newton meters (Nm) or foot-pounds (ft-lb).
Torque sensors from HBK were providing Torque (Nm) and speed (RPM) data as a pulse train. E.g., 60 kHz base frequency +/- 30kHz. This was picked up by SIRIUS counter inputs working at 100 MHz and decoded in the Dewesoft counter measurement setup.


The NVH analysis (noise, vibration, and harshness)
At first, Zoerkler wanted to use its existing electric motor NVH system for vibration measurement. They separately collected the data and post-merged it through export into another software. But after three weeks, the engineers at Zoerkler gave up and asked us for help: “Could we borrow a SIRIUS NVH data acquisition system for a short time?”
For sure! Zoerkler only needed to stack the extra SIRIUS unit with IEPE inputs on top of the other systems. Units click up together very simply with the black/orange corner feet. Additionally, only the USB and sync cable are needed and the entire DAQ system now operates as one and is fully synchronized.


The SIRIUS DualCoreADC family of DAQ systems offers a high dynamic range of 160 dB. It applies two 24-bit ADCs per channel in the background. With the IRIG synchronization technology, various SIRIUS technologies can function as one system. Instead of merging data from separate systems, the engineers now had one integrated solution.
Tornado testbed integration
Connecting to the Tornado testbed from Kristl Seibt/KS Engineers is simple. Dewesoft provides the Testbed module, which acts as an interface between DewesoftX software and testbed control systems. The standardized AK protocol executes the communication over TCP/IP.
More information is available within the Testbed module manual.
Zoerkler made a list of specific parameters needed to request or transmit data from Dewesoft to the test bed in real-time. Some of these parameters (Dewesoft channel names in brackets) were:
Effective Power of 5th Harmonic of Phase L1 (P_L1_H5).
Speed - The HBK T40 speed signal.
The component of the 13th harmonic, which we coupled back over the inverter on the DC side (U_dc/OrderH13) - we used the Order tracking module for this.
Total mechanical power (Pmech_Gesamt) calculated live by the DewesoftX math.
Mechanical efficiency in % (eta_m).
Inverter calibration


The inverter is a critical component of the power electronics system. It converts DC power from the battery into AC power to drive the electric motor. It also controls the motor's speed and direction. In May 2022, the Zoerkler engineers did the first test calibrating the inverter Electronic Control Unit (ECU).
When the servo motor is doing around 5000 rpm, the adapter gearbox makes a factor of 5:1, which gives a maximum of 25,000 rpm. Following the inverter manufacturer's recommendations, the first test ran up to 16,000 rpm.
The engineers held a constant RPM while controlling the torque in a step profile - see Figure 9. They captured the voltages and currents of the three phases next to the torque, speed, and intermediate circuit. The phases were equally distributed. There was no abnormality.
The engineers exported the Dewesoft measurement data to Matlab since they already had some analysis scripts prepared in this software.


Load and vibration test
The second measurement took place in November 2022. The primary objective of the load test is to assess how well the e-drive handles forces, stresses, and strains during operation without failing or experiencing unacceptable performance degradation.
The engineers put a controlled load profile on the motor while holding a stable rpm. Moving from one RPM level to the next, they captured the mechanical and electrical power. And also the e-drive axle’s efficiency, to get the whole picture.
The motor was in a new housing that combined it with the gearbox. This time, the engineers placed the assembly in the middle of the test bed. The servo motors on both sides provided sufficient load to test the possible mechanical power/torque according to specifications.


DewesoftX visualized the measured vibration in acceleration (m/s²) in digital meters, recorder, and FFT.

 and FFT.")
Worldwide harmonized light vehicles test cycle (WLTC) profile
Finally, the engineers exposed the HeAD e-axle system to several WLTC (Worldwide harmonized Light vehicles Test Cycles) tests to determine emissions and fuel consumption. The test simulates real-world driving conditions and includes a wide range of driving speeds, accelerations, and decelerations to reflect typical driving patterns.
Each WLTC test lasted 30 minutes. It is split into sections ranging from low to extra-high speed. The max speed on the testbed equals 131 km/h. During the tests, the motor showed a maximum power of 50kW, which meant it hadn’t yet reached the E-axle power limit.


Conclusion
Dewesoft data acquisition hardware and software support various automotive bus data, e.g., CAN bus, CAN FD, LIN Bus, FlexRay, XCP, etc. In this case, Zoerkler didn’t need to use any of these functionalities, but the engineers now possess the potential for future tasks.
In the meantime Dewesoft is able to do a full motor efficiency analysis on its own that can analyze:
Dq transform,
Resolver measurement,
Efficiency mapping, etc.
A special math function called 2D mapping was extended, and a Contour Plot widget for visualization was introduced. Check out the Motor Analysis online manual.


Dewesoft solution proved efficient and ensured fast innovation in motor development. A one-stop data acquisition system for all signals, such as electrical power, NVH, and CAN bus, was most beneficial. Dewesoft hardware and software ensured easy integration with the Kristl Seibt test bed and the availability of fast raw data for adjusting calculations and easy reporting.
The Dewesoft high-precision measurement technology and the resulting outcomes and interpretations are the basis for the most accurate measurement data evaluation possible. Thank you for that.
The Dewesoft Motor Analysis module is a complete solution supporting the development of motors, control units, and inverters by even the most demanding manufacturers.