


Monitoring and Identifying Train Particle Pollution in Tunnels

Particles released by trains affect human health and the environment. Emission levels in tunnels are critical and influenced by the type of trains passing, the speed, mass, etc. Which type of train causes the highest emissions?
On behalf of ÖBB, Austria's largest rail infrastructure operator, the Technical University of Graz is researching air pollution and particulate matter caused by various trains. Dewesoft helped with the environmental monitoring and identified the trains by their properties.
The research project of ITNA, the university’s Institute of Thermodynamics and Sustainable Propulsion Systems, aims to answer these two questions:
How much pollution per km is caused by various train types?
Since a lot of telecommunication equipment is inside the tunnels: What is the expected air filter service life?
Particle pollution caused by trains
Trains on rails cause dust, debris, and exhaust particles from the train's engine to become airborne. These particles can include particulate matter, such as soot and smoke, and various gases, such as nitrogen oxides and sulfur dioxide. The specific particles produced will depend on the type of train fuel, the track conditions, and the surrounding environment.
With a length of almost 16 km (10 miles), the Münsterertunnel is currently the longest tunnel in Austria. ITNA chose the two-track tunnel for the research due to its relatively modern tracks allowing trains to reach a speed of 200 km/h and more.
Particles released by trains can have more negative effects on both human health and the environment. People living or working near train tracks or in areas with heavy rail traffic may be at an increased risk of particulate matter exposure, which can cause respiratory problems such as asthma and bronchitis. Long-term exposure to these particles can also increase the risk of heart disease and lung cancer.
Particulate matter and other pollutants also contribute to smog and acid rain, which harms plants and animals and impacts soil and water quality. While emissions from trains can impair air quality and bring human health risks, trains are still a cleaner and more energy-efficient mode of transportation than cars and trucks.
High levels of Particulate matter (PM) and Nitrogen oxides (NOx) occur near railway stations and tracks in several urban areas worldwide. For example, in the United States, studies have shown higher PM and NOx levels near railway tracks in urban areas such as Chicago, New York City, and Los Angeles. Studies in Europe show similar results in cities such as London, Paris, and Berlin.
There are special considerations concerning emissions in tunnels. The lack of ventilation in a tunnel can cause a build-up of pollutants. Problems can occur in areas with many tunnels, such as mountainous regions or densely populated urban areas, e.g., the tunnels of the Swiss Alps and the Hong Kong metro.
In January 2023, measurements made by Copenhagen University showed that the concentration of harmful particles in the air in the city’s electric metro is 10 to 20 times higher than on the most polluted street in Copenhagen.
Regulations and standards
Regulations and standards are in place to limit the release of particles from trains, such as emissions standards set by regulatory bodies.
Austria and other EU member states are subject to the EU regulations and standards on particle emissions caused by trains. The Federal Ministry for Sustainability and Tourism (BMNT) and its environment agency, Umweltbundesamt (UBA), enforce compliance with EU standards and other air quality and environment regulations.
The EU has set up regulations and standards on particle emissions caused by trains defined in the Technical Standards for Interoperability (TSI). Set by the European Commission's Directorate-General for Climate Action, these standards cover various pollutants, including particulate matter, nitrogen oxides, and sulfur dioxide. They apply to new vehicles and engines, including trains.
In the United States, the Environmental Protection Agency (EPA) sets emissions standards for various vehicle types, including trains. EPA sets standards for particulate matter and other pollutants, such as nitrogen oxides and sulfur dioxide, which trains must meet. The standard requirements vary depending on the type of train, its engine, and the type of fuel used.
The Federal Railroad Administration (FRA) is responsible for enforcing compliance with these standards for trains and railroads. The FRA also sets safety standards for trains and railroads, which can impact emissions.


Emission monitoring and measurement
Monitoring particle levels in train tunnels is the basis for protecting the occupational health of railway employees, the health of train passengers and nearby residents, and ensuring compliance with air quality regulations.
The environmental air cools the circuits of the railway infrastructure. When a train passes, the friction between the steel rails and the train wheels creates rub-off and fine dust, which swirls around. This dust is particularly harmful to electronics.
The rail operators install filters, but experience shows they need to replace these more often than in other environments. The ITNA team wanted to do an in-depth analysis to study the ambient air pollution levels and the requirements for filter replacement.
Methods for measuring or estimating the particle emissions from trains include onboard monitoring, remote sensing, collecting samples for laboratory analysis, or emission modeling. Regulations and standards on train emissions often specify which methods operators must use to comply.
Particle emission sensors
The levels of particles in train tunnels are typically measured using air quality monitoring equipment installed in or near train tunnels. Several types of sensors are applied to measure particle emissions from trains.
The ITNA team used a dedicated sensor to measure the particular matter. In simple wording, the environmental air is pressed through a thin tube while the sensor counts the particles and detects their size - see Figure 1.
The specific sensors used may vary depending on the measurement method, the equipment used, the pollutants of interest, and the regulations and standards in place. The types include:
Particulate matter (PM) sensors: Measure the concentration of particulate matter in the air. Examples include laser-based sensors, such as the nephelometer, and electrical mobility-based sensors, such as the differential mobility particle sizer.
Gas sensors: Measure the concentration of gases in the air, such as nitrogen oxides (NOx) and sulfur dioxide (SO2).
Optical sensors: Detect pollutants by measuring particle light scattering or absorption.
Temperature and humidity sensors: Applied to measure air temperature and humidity affecting the dispersion of particles.
More factors can affect the release of particles from trains on rails:
Type of fuel used by the train: Different fuel types, such as diesel or electric, produce different types and amounts of particles.
Age and maintenance of the train and its engine: Older and poorly maintained trains may release more particles than newer and well-maintained ones.
Speed of the train: A higher velocity can significantly increase the number of particles released.
Conditions of the track: Rough or dirty rails can increase the release of particles.
Weather conditions: Wind and temperature affect how particles disperse in the air.
Surrounding environment: Factors such as proximity to other sources of pollution and local weather patterns can affect the release of particles.
Train type identification
The design of the trains and wagons influences the emissions of particles.
Aerodynamics: A train with an aerodynamic design will be more efficient and will produce fewer emissions.
Rolling resistance: The design of the train's wheels and the type of rail can affect the rolling resistance, which in turn affects the energy consumption and emissions of the train.
Weight: The weight of the train and wagons can also affect the emissions. A lighter train will consume less energy and produce fewer emissions than a heavier one.
Type of fuel: The type of fuel used by the train can also affect the emissions. Electric and hydrogen-powered trains produce fewer emissions than diesel-powered trains.
Emissions control technology: The design of the train's engine and emissions control systems can also affect the emissions. Technologies such as exhaust gas recirculation, diesel particulate filters, and selective catalytic reduction can help reduce emissions from diesel-powered trains.
The Dewesoft solution
During the surveillance period lasting a few months, all kinds of trains passed the measurement point. Unfortunately, for security reasons, it was not possible to access the internal train operator database, so to identify the train types, we used the Dewesoft DAQ solutions to detect and measure:
The axle distances,
The speed,
The approximate mass to identify the type of train, e.g., Intercity, Eurocity, Railjet, Cargo, or Nightjet, as well as
The air pressure.
We did this with six quarter-bridge strain gauges mounted in different locations on the lower part of the rails, three in each direction. Since we used the DEWE-43A data acquisition system, we needed external bridge completion adapters to connect to this type of sensor.
At a later stage of the project, the ITNA team added two additional pressure sensors. The team also mounted cameras on each side of the tunnel to optically verify the mathematical train type identification. Weather station data showed wind speed, temperature, and humidity.
System installation
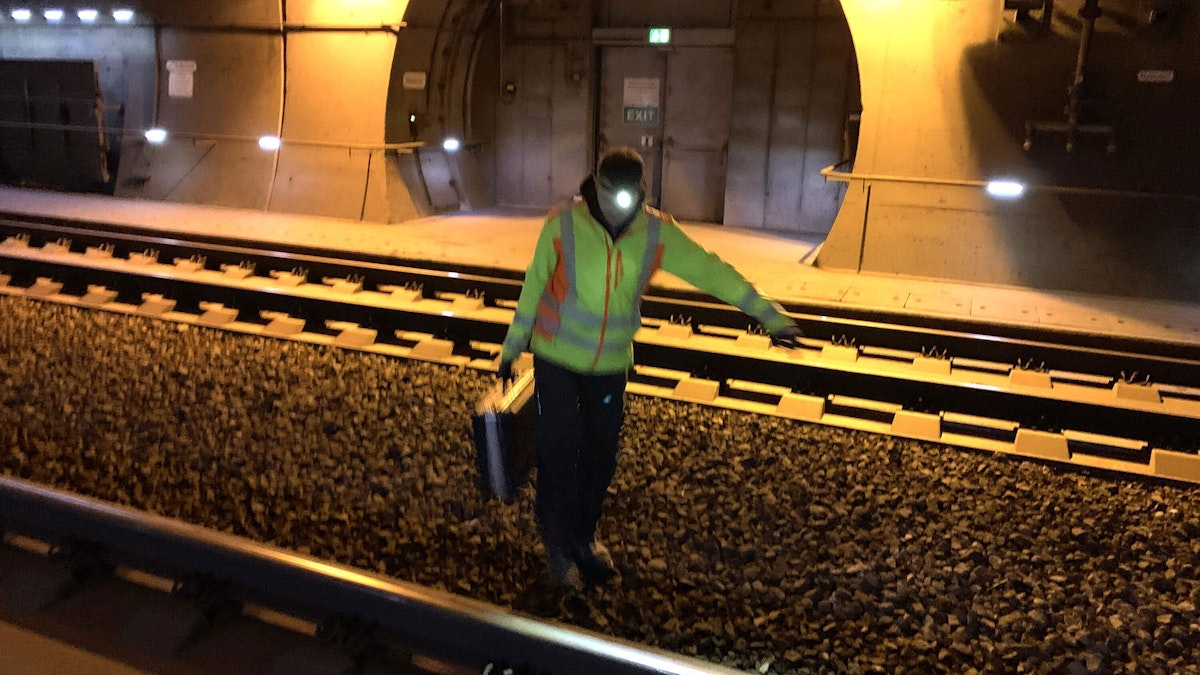
During the installation, the tunnel tracks were closed to all traffic. Our teams reached the switch cabinet by driving through one of the side entry tunnels used for service. One guy from the ÖBB staff was always around, caring for our safety. Although it was a not-so-old tunnel, we noticed the typical black dust everywhere when rolling out the cables.
Modern railway tunnels include a lot of telecommunication equipment, and proper operation is required - this generates the need for effective air filtering and optimal filter service life intervals. We were slightly surprised that our smartphones had constant and full LTE reception in the tunnel.
The cables we needed were already in place with the according length. Next, we defined the positions for mounting the sensors on the rails. We carefully ground small spots on the lower part of the rails to get a smoother surface.
Then, we chemically cleaned these spots with the appropriate alcohol and the strain gauge foil glued on with a Cyanoacrylate-based adhesive. After applying the protective film, the cable was strain-relieved, and the measurement points were ready.


Load measurements
When a train passes, the wheels push down the rail, and the strain gauge foils create a small signal. We did the first strain measurements with a high sampling rate to get an overall picture. It showed us that a sampling rate of around 300 Hz was the minimum so as not to distort the signal. Since the measurement lasted for months, we had to define trigger conditions to only capture data when something happened.
Trigger level setting
Quarter bridge strain gauges are easy to install and frequently used but have the disadvantage of sensitivity to temperature change. You would imagine that the tunnel temperature should be close to constant. Even small changes affect the sensors.
As it turned out, setting the trigger level to a fixed value was inadequate and caused some false alarms. With a low slope, the signal changes smoothly, making it hard to define a value-crossing trigger - see the line in pink in Figure 6.
The DewesoftX data acquisition software offers a variety of mathematic processing capabilities, such as formulas, filters, latch functions, etc. To increase the slope, we did some tests calculating the derivation.
We achieved the best result by using a double-derivation process with an attached 30 Hz filter and applying a level-cross. Having stored a data set, we qualified the trigger levels in post-processing (recalculated) to fit all types of trains. In Figure 6, the blue curve shows a stable trigger signal {0,1} with all strain gauges logically OR-ed.
In the trigger section, we used pre- and post-triggers. If the post-trigger time is over, but the train is longer than expected, we could still catch all data using the “Post time extension” checkbox. So, with the trigger active, the system will continue to listen for triggers and add the post-trigger time after the last trigger event. So, we ensured having one data file per train.


Train identification by pulse profile
Figure 7 shows the measurement of a train passing by on track 4, and the light-green curve shows the strain gauge signal. The first block of pulses has a higher amplitude than the ones following, which indicates that there was one locomotive pulling seven wagons. Each of the wagons has a bogie with two axles, the fast double-pulses, it is a passenger train. And taking the speed into account, it’s a Railjet.
The yellow curve on top indicates the pressure sensor. When the train arrives, there is an abrupt pressure increase, followed by an extended negative pressure caused by a suction effect. A fast-passing train can suck people or objects too close to the track area.
The pressure difference is 1000 Pa! For comparison, standards specify that the difference in pressure between two neighboring rooms must not exceed 50 Pa for people to be able to open a connecting door (< 100 N opening force).
The start and end of the yellow curve indicate that the negative pressure remains for some time after the train has passed. The tunnel needs to be refilled with air but acts as a resistance to the airflow. The tunnel is like a “drinking straw” compared to the outer environment. The light blue line on the bottom is the signal from the pressure sensor on the other track. This pressure curve looks similar to the yellow one but without the initial short peak.
The Technical University of Graz is exporting the measured data to Matlab, where they have already written a script for determining speed, type of train, etc., and correlating it with air pollution, etc.


Conclusion
The 16 km long tunnel provided a homogenous measurement environment without influence from wind, rain, snow, or other emission sources such as traffic fumes, industrial smog, or heating from private households.
The ITNA research project is ongoing but has reached some preliminary and partial results.
One would assume that a heavy freight train is causing the highest pollution. Passenger trains drive at much higher speeds and thus swirl around a significant amount of dust. The university staff also noticed a difference between tunnels with one- or two-directional traffic since the fresh-air supply comes along different ways.
The axle distances of the train types, such as passenger or freight trains, vary since the bogies are not standardized. These differences make the mathematical identification slightly more complex than expected.
“The system is running stable. We have had no failures so far,” scientific assistant Philip Leonhardt from ITNA says. “We are not everyday users of Dewesoft, so I don't know all the features. The main advantages are simple setup, quick sensor configuration, and reliable measurement data.”
 and I in the tunnel.")