


Modal Testing and Analysis of an Aeronautical Propeller Blade
Giuseppe Basile and Giacomo Paris, Mechanical Engineering students
University of Trieste, Department of Engineering and Architecture
September 3, 2024
In situ vibration measurements using accelerometers provide essential data for analyzing a system's inherent dynamics. We used Dewesoft to make a modal analysis of an aircraft propeller blade, highlighting its resonance frequencies and vibration modes. Through measurements, we better understand the structure's dynamic behavior and, most importantly, demonstrate the fundamental value of experimental measurements.
As Kelvin said, "If you cannot measure, you cannot improve." Indeed, measuring enables engineers to make decisions based on facts rather than opinions. Knowing the current state of a process is a necessary condition for predicting its evolution and, therefore, optimizing it. Indeed, experimental measurements may answer questions you have not yet asked.
Data acquisition instrumentation from modal testing
A modal test is generally performed by exciting the structure with an impact hammer or a shaker and then measuring its vibratory response with one or more accelerometers affixed to the studied body.
We performed measurements in a controlled environment, the technical laboratory of the University of Trieste´s engineering department. We used this instrumentation:
8-channel Dewesoft KRYPTON data acquisition system
Impact hammer with IEPE force sensor
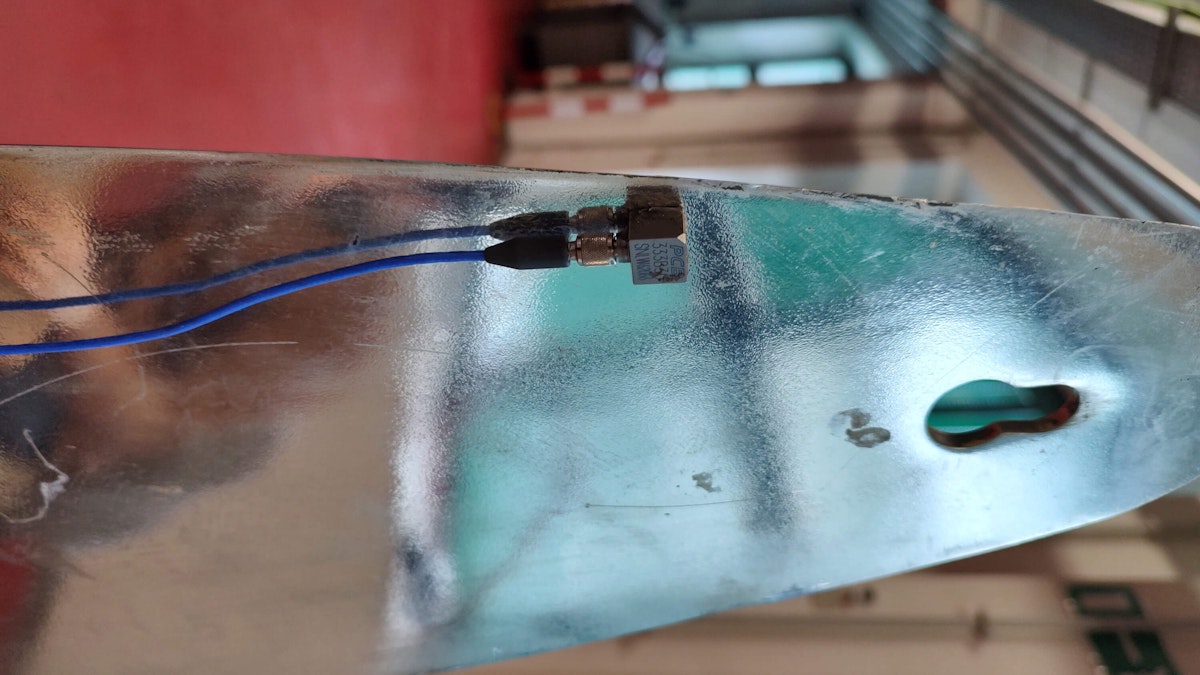
IEPE uniaxial accelerometer


Setup
Firstly, within the DewesoftX software, we define the sensors we intend to use. We have:
Hammer
First accelerometer (acc 1)
Second accelerometer (acc 2)


Furthermore, we specify that all the sensors used are IEPE type and that, in the case of the hammer, the physical quantity we want to measure is a force [N]. Next, we define the instruments' sensitivity: for the hammer, it is 20 𝑚𝑉𝑁, while for the accelerometers, it is ten 𝑚𝑉𝑁.
To perform the modal analysis, we select and click to activate a test module, specifically the Modal Test, a mathematical module for calculating the transfer function between two signals.

One must remember to set the roving hammer/response group, which is essential for analysis. Next, we set Preserve calculated groups so that when we switch to a new measurement, the results of the previous measurements are intact. Therefore, we must have:


At this point, we operate on the acquisition parameters of our system. We can define the resolution, that is, the distance between the spectral components of our spectrum. We set a value of 4096, so the acquisition duration turns out to be 1.64 𝑠.


An essential parameter is the sampling rate, the frequency at which a signal is sampled and channeled into the data acquisition system. According to Nyquist's theorem, the frequency of the phenomenon of interest must be at least twice that of the phenomenon of interest. An initial estimate of possible natural blade frequencies may be within the hundred or a thousand Hz range.
Consequently, we have defined a sampling frequency of 5000 𝐻𝑧. Since we want to see the blade's vibration modes up to 1500 𝐻𝑧, we must sample at least 3000 𝐻𝑧. However, we decided to increase this limit to have enough margin of error.
In the Excitation section, we enter the number of nodes we will strike with the hammer and define the trigger.


We configure the trigger so data acquisition and processing begin when a specific force intensity imparted through the hammer on the input channel is present. In our case, we set a value of 5 N and configure it to automatically re-trigger so that several hammer impacts, precisely three per node, can be executed one after the other.
In addition, we can define the time window. In our case, we used the Force window, a form of windowing that reduces spectral leakage effects when applied to the signal acquired, thus improving the spectral resolution and data quality of the modal analysis.
In the Response section, we enter the appropriate response channels of the accelerometers:
1) first accelerometer (acc 1)
2) second accelerometer (acc 2)


Both must be configured in the same group for the sensors to measure acceleration simultaneously.
In the output channels section, there are several terms that the software indicates with Used and that deserve attention:


FRF H1: In this case, there is no noise on the input, which makes the measurements more accurate. All noise is assumed to be present at the output.
Ordinary Coherence: Coherence is a numerical value between 0 and 1 that measures the degree of linearity between two correlated signals.
Ordinary Mode Indicator Function (MIF): is a tool used in modal analysis to identify blade resonance frequencies.
We can display the MIF value in DewesoftX - see Figure 8.

.")
Finally, in the geometry editor section, we define the geometry of our structure by marking the nodes on which we will apply the impact hammer.
Procedure
Once we have configured the software adequately, we must determine how to
constrain our structure. We used a foam rubber foundation to simulate a free constraint - see Figure 9.


This constraint causes localized damping that is not evenly distributed along the entire structure but concentrates in a specific area, the base of the blade in contact with the foam rubber.
The effect causes the manifestation of complex modes: the nodes of the structure do not oscillate in phase with each other, so different points of the propeller blade reach maximum displacement at various times, presenting a delay in the oscillations. See the positions of the accelerometers in Figure 10.


Next, we place the propeller on the foam rubber and arrange the accelerometers on the structure using beeswax.
At this point, we could proceed with measurements using the instrumented hammer. We adopted a modus operandi involving an average of three blows per excitation point and a waiting time between each hammering equal to 10 seconds. Once struck, this interval allows the structure to dampen vibrations and return to its initial equilibrium conditions.
In the software, it is possible to display simultaneously:
Hammered over time.
Hammered over frequency.
We proceed to the next one once we are satisfied with the measurement. At the end of the set of hammers on the node of interest, the software allows you to read the FRF graph directly relative to the excitation point.
Experimental FRFs and vibration modes
Having arrived at this point, we proceed on the DewesoftX software with the Modal Analysis module:


The module prompts you to process a given number of FRFs, which in this case is 44. Once you have imported all FRFs, you can view them and define a frequency range, in this case, 160 Hz. See the averaged FRF of all the frequency response functions in Figure 11.


In DewesoftX, we can see the AutoMAC (Modal Assurance Criterion). “Auto” in AutoMAC means the two modal forms come from the same test.

 in DewesoftX.")
A value of AutoMAC equal to one indicates that the two modal forms are identical, while a value trending to zero indicates that they are different. On the main diagonal, the value is 1 since we compare two identical modal forms.
The frequencies described in Figure 13 are the dampened ones. The Dewesoft Modal Analysis module also calculates the damping ratios for each mode.

.")


Conclusion
Now, we can see the modal shapes in the software. We meticulously captured the blade's vibratory response by configuring our setup with an impact hammer, uniaxial accelerometers, and the Dewesoft KRYPTON data acquisition system. The process involved careful calibration and triggering to ensure data accuracy and integrity. We optimized critical parameters such as resolution and sampling rate to capture the relevant frequency range and ensure that our analysis was comprehensive and reliable.
Using a foam rubber foundation to simulate a free constraint introduced localized damping, highlighting complex vibration modes and underscoring the importance of realistic experimental conditions. The results, processed through the DewesoftX software, provided clear insights into the blade's frequency response functions (FRFs), damping ratios, and modal shapes.
In our modal analysis of an aircraft propeller blade, we successfully identified its resonance frequencies and vibration modes using in situ vibration measurements with accelerometers. The Dewesoft system allowed us to measure and analyze the blade's dynamic behavior precisely.
This experimental approach underscores the essential role of accurate measurements in engineering, aligning with Kelvin's principle that improvement predicates the ability to measure.