


How Precise is Measuring Sound Power by Sound Intensity?
Konrad Schweiger & Vid Selič, Head of Application Center and NVH Product Manager, Dewesoft
August 13, 2024
The most common way to measure the sound power of devices, e.g., machines or household appliances, is using the envelope method with multiple microphones according to ISO 3744 or ISO 3745. However, you can also determine sound power using a sound intensity probe with a pair of matched microphones, which might be more manageable. The test engineer walks around the D.U.T. using either point- or scanning method, ISO 9614-1 or ISO 9614-2, respectively.
These methods offer a deeper insight into the directional sound characteristic of the device under test through a sound map. Many noise test codes refer to these methods, but how accurate is the sound power measurement?
Before we compare the different measurement principles, let’s repeat some of what we learned in the Dewesoft Pro Training on sound power measurement.
What is sound intensity?
We define Sound Intensity as sound power per unit of an area. It depends on the distance from the sound source and its acoustic environment. Sound intensity is a vector quantity that describes the amount and direction of sound energy. The unit for sound intensity is [W/m2]. You calculate it as a product of sound pressure and particle speed.
What is sound power?
Sound power is a characteristic of a sound source, typically expressed in a logarithmic scale as sound power level, corresponding to the emitted sound energy levels of noise sources. It is independent of distance from the source and, therefore, a practical way of comparing various sound sources. Sound power can be measured in different ways, either by sound pressure or sound intensity.
What is sound pressure?
Sound pressure, or acoustic pressure, is the variation in local pressure from the surrounding atmospheric pressure induced by a sound wave. In the air, sound pressure is typically measured with a microphone, while in water, we apply a hydrophone. The standard unit for measuring sound pressure in the International System of Units (SI) is the Pascal (Pa).
Mathematically, sound pressure, denoted p, is defined by
where
is the total pressure,
is the static pressure.
The Dewesoft Sound Intensity module acquires, calculates, and displays all three of the above-described sound quantities: sound intensity, sound pressure level, and sound power level.
The D.U.T. - Reference Sound Source (RSS)
To precisely define sound radiation over a wide frequency range (100 Hz—20 kHz), we chose the Reference Sound Source B&K 4204 as the test device according to ISO 6929.
This device works like a rotating fan, generating a constant, long-term, stable white noise sound. It is mainly used in building acoustics applications, e.g., to determine the sound absorption or insulation of rooms or different materials. It made a pretty rugged impression.
Since the device's sound power was around 92 dB(A) when performing the measurements, we had to wear industrial earplugs for hearing protection - needed if occupational noise exposure to the human ear is >80 dB(A).
The calibration report was current, and the measurement conditions were well known: An external calibration lab determined the Total Sound Power and the individual octave bands in a semi-anechoic room (over a reflective plate) according to ISO 3745 precision grade.


List of equipment
Dewesoft SIRIUS mini data acquisition system, compact and portable noise and vibration analyzer, DB19008866, HW 4.0, FW 5.3.30.16, calibrated 26.06.2024, as found
DewesoftX Software 2024.2 - acquisition and digital signal processing software
Sound-Intensity-Plugin - plugin for DewesoftX software
Sound intensity probe: GRAS 50GI-R, Serial No. 482052
Sound pressure calibrator GRAS 42AG
Phase calibrator according to IEC 61043, GRAS 51AB, SN: 210878
Function generator Rigol DG1022 for noise signal (for phase calibration)
Reference Sound Source according to ISO 6929, B&K 4204, Serial No. 552298, calibrated by accredited test lab on 19.12.2023
Anechoic chamber owned by EN ISO/IEC 17025 accredited AUVA General Accidents Insurance Company, located close to Vienna
Ambient conditions:
21.2 °C
55.1% relative humidity
What is a sound intensity probe?
A sound intensity probe is a specialized instrument used to measure sound intensity, the sound power per unit area, usually expressed in watts per square meter (W/m²). Sound intensity is a vector quantity with both magnitude and direction. The probe allows for determining the directional characteristics of sound fields, which is essential in various applications such as noise source identification, sound power determination, and acoustic research.


Components of a sound intensity probe
A typical sound intensity probe consists of a pair of closely spaced, typically a few centimeters apart, microphones that measure the sound pressure at two different points. The spacing between the microphones allows for calculating the pressure gradient, which is essential for determining the particle velocity component of the sound intensity vector.
A rigid spacer maintains a fixed distance between the two microphones, ensuring accurate measurements of the sound pressure gradient. Each microphone has a preamplifier that conditions the signal for further processing and connects to a data acquisition system that captures the signals from the probe microphones. The system processes the signals to compute the sound intensity by analyzing the phase and amplitude differences between the microphone signals.
Working principles and applications
The probe can calculate the sound intensity by analyzing the difference in sound pressure levels between the two measurement points. The fundamental principle relies on the following steps:
Pressure Gradient Measurement: Microphones perform Sound pressure level measurements that capture sound pressure levels at two points separated by a known distance. The pressure difference between the two microphones determines the pressure gradient.
Particle Velocity Calculation: The pressure gradient is related to the particle velocity of the sound wave. You calculate the particle velocity using the pressure gradient and the known separation distance.
Sound Intensity Calculation: You calculate the sound intensity as the product of the sound pressure measured by one of the microphones and the particle velocity calculated from the pressure gradient. The result is a vector quantity that indicates both the magnitude and direction of the sound energy flow.
Unlike traditional sound level meters, which measure sound pressure levels without directional information, sound intensity measurement probes provide both the magnitude and direction of sound energy flow. By providing directional data, sound intensity probes help accurately locate noise sources. They can also measure sound power directly in background noise, making them useful in noisy environments.
Engineers use sound intensity probes in various applications, including noise source identification, acoustic research, environmental noise monitoring, building acoustics, and, in our case, to determine sound power.
Preparing the sound intensity probe
The sound intensity probe consists of two pair-matched microphones. By production, the matching pairs are selected to have the minimum possible phase errors between them. You achieve the highest accuracy by doing an additional phase calibration on site; this will eliminate small changes caused by cabling.
The function generator - you can also use the SIRIUS Analog Output + software function generator - provides a small noise signal to the GRAS 51AB phase calibrator connected to the microphones. The procedure is ready in the default Sound Intensity screen in DewesoftX software, so you just need to click a button and wait.
Once we completed the procedure, the measured result was available as a phase calibration table in the Sound Intensity channel setup.


Measurement setup
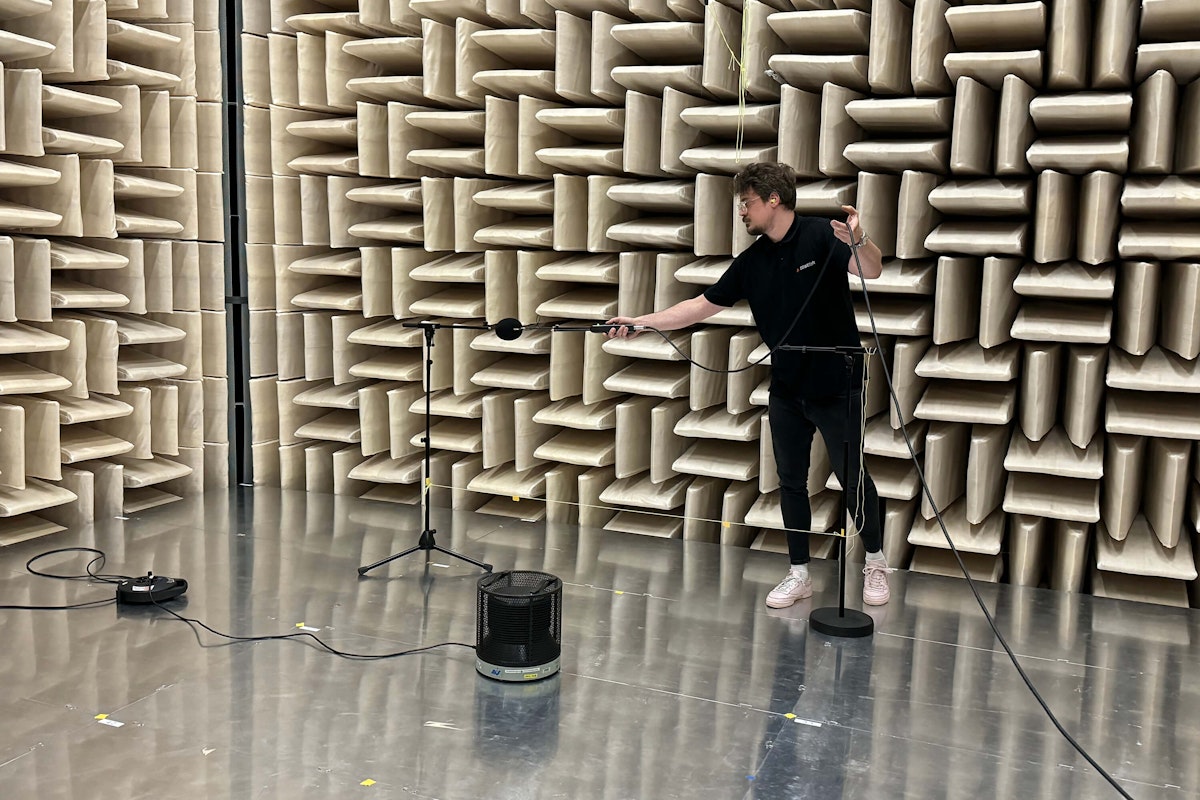
We modified the fully anechoic chamber to a semi-anechoic chamber by inserting a reflective ground plate, aiming for the same conditions as in the Reference Sound Source calibration report. Generally, you execute the ISO 9614 methods in free-field conditions over a reflective surface like the floor. This setup implies that sound intensity needs to be measured over five surfaces as all the sound energy emitted downwards by the source reflects through these five surfaces. On each of the five surfaces, you need to measure the time-averaged sound intensity before including the surface area in the later calculation of the Sound Power.
We selected the frequency spacer for the recommended frequency range of 100-12500 Hz for the Sound Intensity Probe. Since the scanning method introduces a lot of uncertainties - depending on the test engineer, one will move the probe faster or slower over the sector of the D.U.T., the point method, according to EN ISO 9614-1, was the means of choice.
Around the D.U.T., we defined a cube totaling 1,9 x 1,9 x 1,5 m. Since we could not measure from the bottom, the cube resulted in five surfaces. We then split each surface into four sectors and centered the Sound Intensity probe in the appropriate sector for each measurement.
Since the D.U.T.'s emitted sound is very homogenous, the data did not change after a few seconds of averaging; the segment measurement times diminished to 10 seconds each.


Measurement and data acquisition
To ensure precise positioning of the Sound Intensity probe, we used tripods to the left and right of each surface, with a connecting rubber band as a help. We marked the lower positions with yellow tape on the band while we rotated the top arms of the tripods 90 degrees to guide the higher positions. We moved the whole setup between each side of the cube, and stickers on the floor, which also had been marked before, gave orientation.


Measurement results and conclusions
After we had measured, we exported the Total Sound Power and the individual octave bands to MS Excel.
Below, on the left side of the table, you see the values of the test report for Sound Power done by an accredited laboratory based on ISO 3745 hemisphere setup. In the middle are the Dewesoft measurements of Sound Power done using the Sound Intensity principle, and on the right side is the difference.
Since the accredited lab's calibration report showed (Z) weighting results, we could also convert these to (A) weighting to match human ear behavior. We can do this conversion simply by adding the A-weighting reference curve for each band - see also the explanation in Dewesoft PRO Training for more information. At 1 kHz, the (Z) and (A) values match since the correction value is 0.


For the total Sound Power Lw(A) at the bottom of the table, you can see a deviation of around 1 dB. We can explain this through the different frequency ranges used. While Figure 8.'s accredited test lab report covers a frequency range from 20 Hz to 20 kHz, the Dewesoft measurement covers 100 Hz to 12,5 kHz. To cover the whole range, we must combine two measurements using different spacers, e.g., 12 mm and 100 mm.
Since the two measurement methods are different in principle, when measuring Sound Power based on Sound Intensity, the ISO 9614-1 specifies a tolerance of +/-2 * s (standard deviation) for the individual bands, which is:
+/-4 dB for bands 50-160 Hz
+/-3 dB for bands 200-630 Hz
+/-2 dB for bands 800-5000 Hz
+/-4 dB for 6300 Hz band
The Dewesoft Sound Intensity plugin matches the Precision grade specifications. It also partly compensates for the plastic spacer behavior between the microphones. It even further improves the accuracy, especially in the higher bands like 6 kHz to 12.5 kHz, which sets us apart from the competition.