Table of contents
Browse categories
Browse authors
 AB
ABAlberto Boffi
 AL
ALAlessia Longo
 AH
AHAl Hoge
 AB
ABAljaž Blažun
 BJ
BJBernard Jerman
 BČ
BČBojan Čontala
 CF
CFCarsten Frederiksen
 CS
CSCarsten Stjernfelt
 DC
DCDaniel Colmenares
 DF
DFDino Florjančič
 EB
EBEmanuele Burgognoni
 EK
EKEva Kalšek
 FB
FBFranck Beranger
 GR
GRGabriele Ribichini
Glacier Chen
 GS
GSGrant Maloy Smith
 HB
HBHelmut Behmüller
 IB
IBIza Burnik
 JO
JOJaka Ogorevc
 JR
JRJake Rosenthal
 JS
JSJernej Sirk
 JM
JMJohn Miller
 KM
KMKarla Yera Morales
 KD
KDKayla Day
 KS
KSKonrad Schweiger
Leslie Wang
 LS
LSLoïc Siret
 LJ
LJLuka Jerman
 MB
MBMarco Behmer
 MR
MRMarco Ribichini
 ML
MLMatic Lebar
 MS
MSMatjaž Strniša
 ME
MEMatthew Engquist
 ME
MEMichael Elmerick
 NP
NPNicolas Phan
 OM
OMOwen Maginity
 PF
PFPatrick Fu
 PR
PRPrimož Rome
 RM
RMRok Mesar
 RS
RSRupert Schwarz
 SA
SASamuele Ardizio
 SK
SKSimon Kodrič
 SG
SGSøren Linnet Gjelstrup
 TH
THThorsten Hartleb
 TV
TVTirin Varghese
 UK
UKUrban Kuhar
Valentino Pagliara
 VS
VSVid Selič
 WK
WKWill Kooiker
Mapping DC Electric Motor Efficiency on Test Bench
Team H2politO: Luca Ghi, Luigi Radano, Simone Manzone, and Salvatore Scalzo, engineering students
Politecnico of Turin
September 26, 2025
A team of engineering students at the Politecnico of Turin (Italy) is designing low-energy consumption vehicles. The team made and applied a DC electric motor test bench to measure and analyze electrical power input and mechanical power output under various conditions. Utilizing hardware and software provided by Dewesoft, the team obtained the data to create an efficiency map of the Permanent Magnet Direct Current (PMDC) motor in their prototype vehicle, IDRAzephyrus.

This detailed project, part of their participation in the Shell Eco-Marathon, involved measuring and analyzing electrical power input and mechanical power output under various conditions to optimize performance. Their meticulous approach and interdisciplinary collaboration highlight their commitment to innovative and sustainable engineering solutions.
The H2politO team is a unique blend of students from diverse engineering disciplines at the Politecnico of Turin. Year after year, students in aerospace, automotive, cinema, communication media, electronics, energetics, management, information technology, mathematics, materials, mechanics, and Mechatronics contribute to continuous vehicle improvement.
H2politO and its vehicles are participating in the Shell Eco-Marathon (SEM), an international competition for low-energy vehicles. During the competition, the aim is to complete a 16 km run in a maximum of 36 minutes, making 10 laps of the track. Fuel consumption is measured while doing this, and the team using the least fuel wins.
The Team has two vehicles participating in the two categories:
ICE Urban Concept (JUNO),
Hydrogen Fuel Cell Prototype (IDRAzephyrus).
This project concerns the prototype vehicle IDRAzephyrus - whose powertrain is shown in Figure 1. Its engine consists of a Fuel Cell, a Fuel Cell Control Unit (FCCU) that includes a DC/DC converter controlling the charge of a supercapacitor stack, and a motor controller powering the onboard Permanent Magnet Direct Current (PMDC) motor.
Achieving high subsystem efficiency is paramount to obtaining a competitive result. However, the team's strategic approach during the competition also plays a significant role.
The Vehicle Dynamics & Strategy division leverages a data-driven methodology to develop a comprehensive car model. This model facilitates the acquisition of crucial information, enabling further refinement and optimization of various vehicle components.
Test project
The test aimed to gather electrical power input and mechanical power output information to obtain the efficiency map of the PMDC motor. To do this, we planned to stabilize the motor at a certain speed while supplying a set current, which allowed us to take relative torque and voltage values.
Torque meter
We used a Kistler torque meter Type 4503A, already available to the Team, to measure the torque applied from the DC electric motor. The torque meter, which has a torque range of 20 Nm and a maximum speed of 7000 rad/min, provided information on the speed of the axes as it already includes a sensor.
Due to the low torque output, we chose to test the DC electric motor using a transmission system with different planetary gear reductions. This transmission system would increase the torque output to enter the instrumentation's sensing range.
DC electric motor controller
To control the electric motor, we used the same actuation board mounted on the car to get the same current control and voltage variation as in the car. A PC connected to the electronic board sent the motor-on and strategy signals.
Load applied on the shaft
For the first solution, we used the magnetic brake to manually regulate the current flowing through the inductor to control the rotational speed (Figure 2).
In the second setup, we applied a second PMDC motor as a mechanical load (Figure 3). This way, the back or counter EMF (electromotive force) generated by the loading motor is sent to an electronic load that can impose a fixed voltage corresponding to a fixed speed. During the tests, we used the Maxon RE50 with a Neugart WPLE40 transmission (20:1 transmission ratio).
Electric motors tested
The team's first idea was to test all the available electric motors (Maxon)—see all datasheets in Tables 1 to 6—but there was not enough time to complete more than one efficiency map. Consequently, the tested motor was the Maxon RE40 (Table 1) coupled with the Maxon GP42C transmission (Table 3).
Maxon RE40
|
Nominal voltage |
24 V |
|
No-load speed |
7580 rpm |
|
No-load current |
137 mA |
|
Nominal current |
6 A |
|
Resistance |
0.299 Ω |
|
Inductance |
0.082 mH |
|
Torque constant |
30.2 mNm/A |
|
Speed constant |
317 rpm/V |
|
Rotor inertia |
142 g·cm2 |
|
Thermal resistance housing-ambient |
4.7 K/W |
|
Thermal resistance windings-housing |
1.9 K/W |
|
Winding thermal time constant |
41.5 s |
|
The motor thermal time constant |
809 s |
|
Maximum mechanical speed |
12000 rpm |
|
Weight |
480 g |
|
Maximum efficiency from the datasheet |
91% |
Maxon RE50
|
Nominal voltage |
24 V |
|
No-load speed |
5950 rpm |
|
No-load current |
236 mA |
|
Nominal current |
10.8 A |
|
Resistance |
0.103 Ω |
|
Inductance |
0.072 mH |
|
Torque constant |
38.5 mNm/A |
|
Speed constant |
248 rpm/V |
|
Rotor inertia |
536 g·cm2 |
|
Thermal resistance housing-ambient |
3.8 K/W |
|
Thermal resistance windings-housing |
1.2 K/W |
|
Winding thermal time constant |
71.7 s |
|
The motor thermal time constant |
1370 s |
|
Maximum mechanical speed |
9500 rpm |
|
Mass |
1100 g |
|
Maximum efficiency from the datasheet |
94% |
Maxon GP42C
|
Maximum speed |
8000 rpm |
|
Maximum continuous torque |
7.5 Nm |
|
Maximum torque |
11.3 Nm |
|
Gear ratio |
26:1 |
|
Inertia |
9.1 g·cm2 |
|
Mass |
360 g |
|
Maximum efficiency from the datasheet |
81 |
Neugart WPLE040-20
|
Maximum speed |
18000 rpm |
|
Maximum continuous torque |
8 Nm |
|
Maximum torque |
12 Nm |
|
Gear ratio |
20:1 |
|
Inertia |
32 g·cm2 |
|
Mass |
600 g |
|
Maximum efficiency from the datasheet |
88 |
Neugart WPLE040-25
|
Maximum speed |
18000 rpm |
|
Maximum continuous torque |
8 Nm |
|
Maximum torque |
12 Nm |
|
Gear ratio |
25:1 |
|
Inertia |
32 g·cm2 |
|
Mass |
600 g |
|
Maximum efficiency from the datasheet |
88 |
Project issues
Thermal problems
Due to continuous testing, the rise in temperature of the DC electric motor could create damage. For this reason, considering the Maxon datasheet, a Simulink model has been made so that it was possible to evaluate the maximum time before reaching the maximum temperature on both the armature and the housing.
The motor model is simple and based on the motor's electrical and mechanical equations (in the Laplace domain), including a tentative mechanical efficiency 𝜂𝑚: this model simulates both the tested and the braking motor. Then, we used two PI controls to set the current on the tested motor and speed on the brake (which univocally determines the motor one, too).
We determine the difference between electrical and mechanical power as the heat flow Φ generated. This value is the input for the thermal model; taking datasheet thermal resistance 𝑅P and time constant 𝜏P values, we can obtain the following equation for temperature:
The temperature 𝜗 is defined by:
This equation is used for the winding, so the resistance is between the winding and the case, and the case—so the resistance is between case and environment. Of course, the critical element is the winding.
The simulations indicated that the maximum temperature 𝜗 =150 °C was reached only for a current of 14 A at high speeds, and in praxis, testers never employ a current of 15 A —nor are any currents above 11 A. We hadn’t tested his condition, so we acquired the data without concerns about time.
To consider the temperature effect, we employed two thermocouples to sample the temperature of the DC electric motor and the transmission during the tests' execution (Figure 4). Moreover, we used a fan to cool down the powertrain and control the setup. We manually adjusted the fan by varying the supplied voltage.
Mechanical setup
From a mechanical point of view, the goal was to couple the motor and the loads with the torque meter, supporting them appropriately. The main constraints were related to the torque meter, the wheelbase of its support, and the height, and we fixed the coupling of its shaft (Figure 5).
Supports design
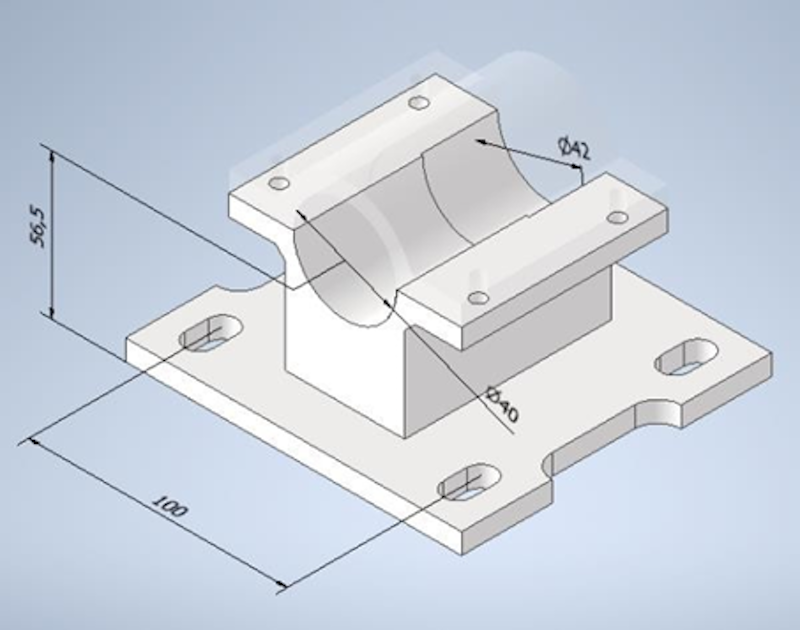
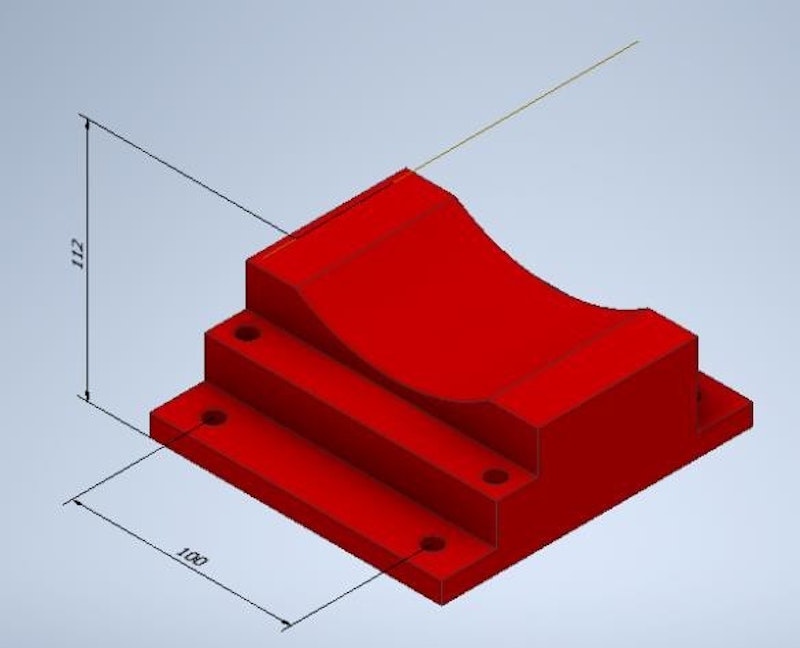
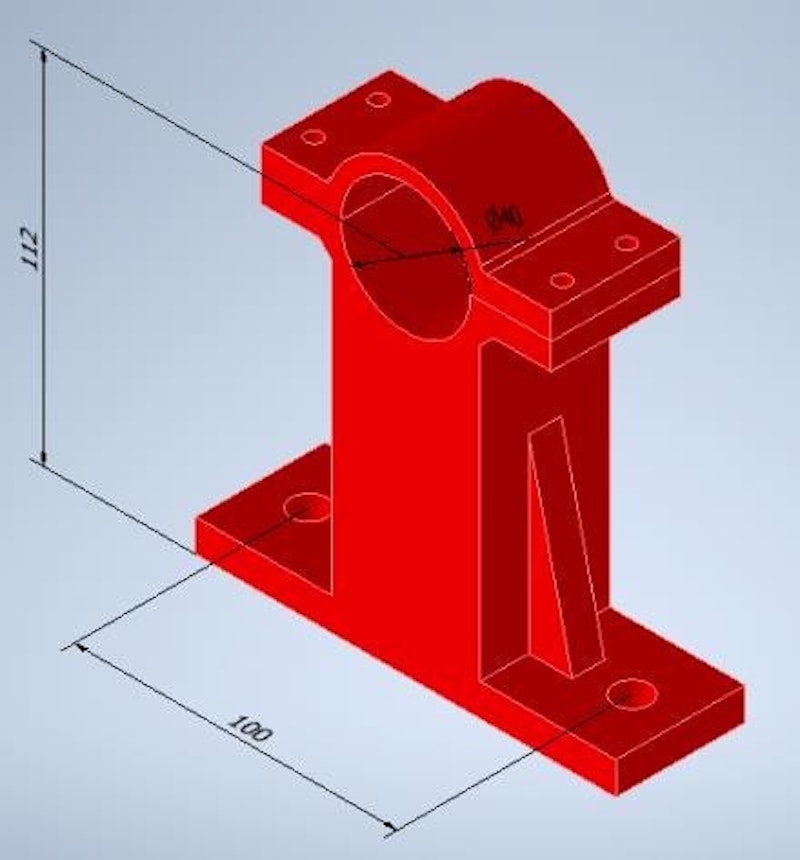
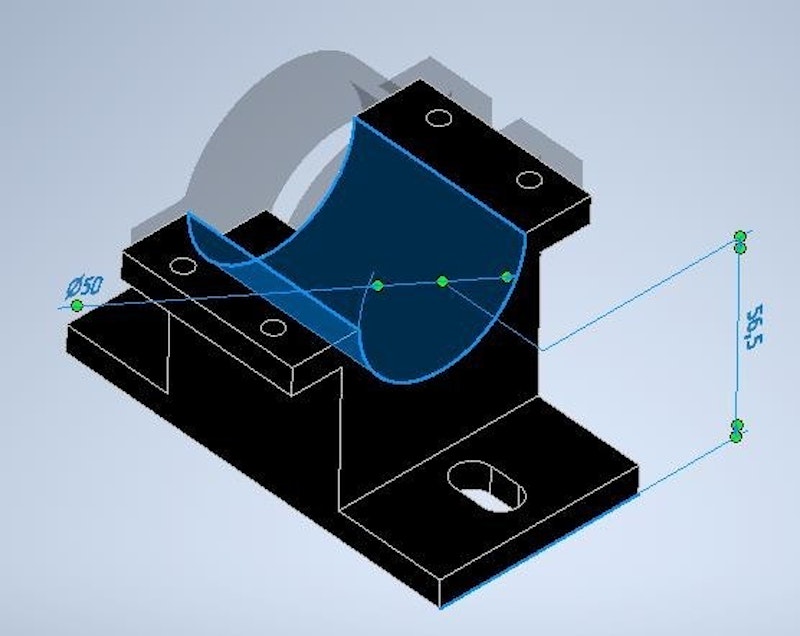
Due to the in-line setup, we decided to use two aluminum profiles as a bench test ground to set the wheelbase of the supports, designed to keep the shafts’ axis at the same height (Figure 6).
We designed three main supports, one for the tested electric motor and the others for the two types of loads. Due to cost and time reasons, we have used 3D printing in Polylactic Acid (PLA).


We applied three aluminum blocks under two supports to make them smaller and minimize the printing time. The aluminum blocks were 55.5 mm high, so the motors’ supports have an axis height of 56.5 mm.
Coupling
We coupled the shafts of the various components through Jaw Couplings, PHE L075HUB, a generic Jaw standard coupling hub with a solid bore provided by SKF. This coupling ensured the proper inner diameter and the appropriate keyway slot to transmit the torque.
PHE L075HUB
|
Maximum speed |
11000 rpm |
|
Nominal torque (Nitrile Element) |
11.9 N·m |
|
Nominal inner diameter |
6.35 mm |
|
Maximum inner diameter |
24 mm |
As shown in Table 7 and from the permissible torque of the keyways, this type of joint is suitable for the presented application.
The following equation can compute the admissible torque Mt of the keyway:
where pmax is the maximum permissible pressure, d is the shaft diameter, and l and h are the keyway's length and height, respectively.
Consulting the technical drawings in the datasheets guaranteed us the appropriate tolerances. In particular:
to the inner diameter of the hubs.
Adhere to UNI 6604 for the keyways’ slot dimensions and tolerances. Figure 11 shows an example of coupling hub manufacturing.
Electrical setup
In this setup, a power supply unit (PSU) limited to 6A@30V powered the electric motor (see Figure 12). We connected the PSU in parallel with a Super Capacitors SC stack to reach higher powers, with the target working point being 15A@30V. In this way, the SCs act as a buffer and allow the motor to sustain a higher power for a limited time.
The SC pack comprised a series of ten Cornell Dubilier DSF607Q3R0 capacitors (see the data in Table 8).
Cornell Dubilier DSF607Q3R0
|
Single voltage |
3 V |
Pack voltage |
30 V |
|
Single capacitance |
600 F |
Pack capacitance |
60 F |
|
Single internal resistance |
3.5 mΩ |
Pack internal resistance |
35 mΩ |
|
Energy density |
9.15 Wh/kg |
||
The same controller board used in the IDRAzephyrus prototype powered the PMDC motor. The controller supplies the motor with a Pulse Width Modulation (PWM) signal output from a half-bridge Metal Oxide Semiconductor (MOS) configuration. Due to hardware limitations, the actuation imposes a maximum PWM Duty Cycle of 95%, supplying the motor with 95% of the SC voltage, corresponding to an average voltage of 28.5 V.
Due to the limited current supplied by the PSU, which causes the SC stack to drop in voltage, and the PWM duty cycle limitation, we encountered a voltage saturation condition. We could only test the motor up to a limited speed for the target, making it impossible to complete the entire map.
Interfacing with the data acquisition (DAQ) system
During the setup of this project, a selection of the parameters to log was made, in particular:
Motor Voltage
Motor Current
PSU Voltage
Motor Torque
Motor Speed
2x Thermocouples
The DAQ system handled the voltage measurements internally. To provide the voltages to the DAQ system, we needed a DB9 cable. The required pins for voltage measurement are In+ and In-. The data in Table 9 are from the DAQ system manual.
| Pin | Name | I/O | Description |
|---|---|---|---|
| 1 | Exc+ | O, Power | Sensor supply, excitation + |
| 2 | In+ | I, Singal | Sensor Output + |
| 3 | Sns- | I, Singal | Sense - |
| 4 | AGND | I | Analog Ground |
| 5 | Reser. | I/O | Reserved / Not Connected |
| 6 | Sns+ | I, Singal | Sense + |
| 7 | In- | I, Singal | Sensor Output - |
| 8 | Exc- | O, Power | Sensor supply, ecxitation - |
| 9 | Reser. | I/O | Reserved / Not Connected |
The current was measured using a current clamp provided by Dewesoft. Dewesoft also supplied the thermocouples and the specific purpose adapter we used. The Torque and speed data were acquired using a BNC connector converted to DB9 with a proprietary adapter.
Data acquisition and analysis
Dewesoft supplied us with the versatile and powerful SIRIUS Modular Data Acquisition (DAQ) System. SIRIUS provides high-end signal conditioning amplifiers for almost any signal and sensor and offers a high dynamic range (160 dB) and galvanic isolation.
All SIRIUS instruments include the DewesoftX data acquisition software. During the tests, we used the DewesoftX in two of its core modes of operation:
Measure: This mode allows you to personalize the logging parameters by setting up the different channels on the DAQ system. It is also where you configure the data conversion and the sensor's linearity connected to the DAQ. You can also use it to save the data during a test. In this mode, you can perform some calculations to create new channels, where the values are evaluated through a timestep analysis of the signal from the DAQ, performing some approximations like the calculation of Root Mean Squared (RMS) value and the change of frequency of data sampling. Through math calculations, you can also define some new channels.
Analyze: This mode allows the analysis of the various channels after the test and analyzes the behavior through different graphs and displays.
In analysis mode, we could load the data from a previous recording performed in measure mode through the software's data file page. It is also possible to load data from .txt and .csv files. This page's data is in various file formats, like Matlab, .csv, txt, and .dat.
Once we had selected the data to analyze, the Setup page allowed us to modify the sensor data conversion since the software also saved the data as raw analog data.
This page allowed us to associate a channel with a measurement unit and set maximum, minimum, and offset values, permitting the sensor to be linearized. We can also change the exported sampling frequency as it can differ from the original one fixed in this mode. Creating new channels based on existing ones is also possible on this screen.
The data can be displayed in various modalities on the Analysis page, from the numeric display to the analog display and multiple kinds of plots.
The Print and Export pages allow you to print or export the data (Figure 14) and the graph (Figure 15) in other formats.
First test results
We did the first series of tests on a Maxon RE40 motor connected to a Maxon GP42C transmission.
We first performed the test on a setup with a load applied through the magnetic brake. This solution's problem was difficulty stabilizing the speed correctly and on time due to the motor's heating and increased internal resistance.
For this reason, we soon decided to move to the second load setup, applying the load on the shaft through the Maxon RE50 motor attached to a Neugart WPLE040-20 transmission. We controlled the motor by limiting the voltage from the back EMF due to the motor's rotational speed.
This control gave us better results, as the electronic load automatically regulated the current to stabilize the shaft’s speed. The information was registered using DewesoftX for constant current applied on the motor tested from 7A to 10A, while it was also registered information on 4A with magnetic brake as load. The speed was stabilized for 10 seconds from 8000 rpm to 1000 rpm with a step of 500 rpm. The results are shown from Figure 16 to Figure 19.
For the analysis, we extracted the data through DewesoftX to a MATLAB-compatible format to compare with track test data and simulations made with Simcenter Amesim. We related this data to the motor and the transmission datasheets.
We then analyzed the data to understand the behavior according to the formula of the electric motor:
In particular, we had to respect the formula at every point in two different situations:
Pure electric behavior when at low speed, so we could neglect the magnetic component:
Pure magnetic behavior, when at high speed and so the electric is negligible concerning the field generated from the speed:
Note that a voltage of about 10 V for every situation means an internal resistance of about three times higher than what is on the datasheet.
The main problem was that the resistance influence was present at low speed but not at high speed, meaning only an error in the data logging.
We found a difference in the power requested from the power source during actuation and the power supplied at the motor, which accounts for about 20% of the board's efficiency.
This efficiency cannot be accurate, as it should be visible in an increased temperature, which was not present.
Second test results
We conducted another test campaign with a new motor and an updated bench test.
To test the motors more precisely, we created a code that automatically reduces the maximum voltage on the electronic load after a specific time.
We tested the motor again, but this time on the Maxon RE40 connected to the Maxon GP52C transmission. Before the test, some data was logged on our side to complete the internal resistance locking for the motor shaft and to examine the voltage and current applied. It turns out to have an internal resistance of about 0.5 Ω.
Then, we tested the motor on the bench for currents ranging from 4 A to 10 A and speeds from 8000 rpm to 1000 rpm with a step of 500 rpm.
First, we calculated the efficiency η of the motor for each sample taken, from the voltage applied V and current supplied I to the torque T obtained at certain speed ω:
See the powertrain efficiency curve in Figure 20.
We again analyzed the data to calculate the efficiency of the motor ηm (Figure 22), neglecting the Joule losses and assuming a constant internal resistance, where k is the torque constant (in N∙m/A), numerically equal to the constant of speed V (in rad/s):
The researched results were a value for an ideally constant friction torque value for the motor and a map of efficiency for the transmission as a function of torque and speed, in addition to an estimation for the electric resistance of the motor.
The friction torque found was 0.15 N∙m, which we must still confirm with more specific tests. The transmission efficiency (Figure 23), assuming this friction torque, will be obtained as follows:
We have the map of efficiency for the transmission fitted with the equation:
𝜂𝑡 = 0.8633 − 6.844 ∙ 10−3 ∙ (𝑖 ∙ 𝑘 ∙ 𝐼 − 0.15) + 2.051 ∙ 10−5 ∙ 𝜔
The last result, the internal resistance of the electric motor, has been calculated according to this equation:
Conclusion - data usage
We then used the data to improve the IDRAzephyrus’ Amesim model, modifying the values for the motor no-load current according to the friction torque found and the internal resistance to 0.481 Ω.
We then modelized the transmission efficiency using the map created with the data, which the model used to choose the efficiency every moment according to speed and torque on the motor side.
According to the actual performance comparison, this data collection significantly improves the motor's expected energy consumption and performance during the IDRAzephyrus’ Shell Eco-Marathon run simulation.
Figures 24 and 25 present the speed and SC charge-discharge comparison.