


How Easy is DewesoftX DAQ Software to Learn?

March 27, 2025
DewesoftX (DSX) is an advanced software for data acquisition (DAQ). It helps measure and analyze data with high precision. This software is used in many industries, such as automotive, aerospace, energy, and industrial applications. DewesoftX is known for its easy-to-use interface. It allows real-time data visualization, acquisition, processing, and reporting. All these features are available in one place. It integrates seamlessly with Dewesoft hardware and supports various third-party devices. DewesoftX offers strong tools for signal processing, synchronization, and analysis. It is also very customizable. This lets users adjust the software to fit their testing needs quickly and easily.
Despite its power, the software is easy to learn. Its interface is intuitive and graphical, and a tight integration with Dewesoft hardware contributes to its ease of use. This article will step you through the basics and show how easy DSX is to learn and operate. If you’re ready, let’s start!
The measure mode
The “Measure mode” inside the DewesoftX software is where you set up and perform your measurements. It allows you to define:
Channel setup
Math setup
Setup and control storing strategy
Define measurement screens and display widgets
Setup management
When you first launch DewesoftX, it automatically goes to the Setup files screen, where you will see any existing setups. To load one of them, double-click on it, and its settings will be restored.


Let’s create a new setup from scratch to learn how it works. Please click the New Setup icon (it looks like two black gears), and it will take you to the Channel Setup screen, as shown below.
The channel setup screen
Your system will show various types and quantities of input channels depending on your Dewesoft hardware. Please note that the Analog In icon is active by default, so your analog inputs are shown in the central part of the screen.
NOTE: If you don’t have any DAQ hardware, you can use DewesoftX software in demo mode. Simply right-click the Amplifier Name column buttons to choose virtual “demo” amplifiers for each channel. We used this method to make the screenshots below. You can select USB modules (SIRIUS, DEWE-43A), RT DAQ modules (IOLITE, KRYPTON, XHS), and EtherCAT modules (KRYPTON, IOLITE).


You can enable channels to record by toggling the Used button on the left side of the list. In the screenshot above, all of the analog channels will be recorded. However, you can toggle any channel to Unused with a single click.
Colors are assigned by default, but you can change them by clicking any color icon. Channels are also named by default, but you can enter the names you like. It’s that simple. Other columns show you essential information about each channel. Notice the moving bar graph showing the “live” input Values. Range settings and engineering units are also shown in the grid.
The final two columns are buttons:
The Zero button removes the offset from a DC signal, adjusting its baseline to 0.
The Setup button is described in the next paragraph.
Configuring channels
DewesoftX supports many types of channel inputs. From analog to digital signals, video, and network protocols like CAN/CAN FD, Ethernet, OPC UA, and more.
Analog inputs
Click any analog channel’s Setup button, and a graphical setup dialog will pop up:
Here, you can pick your measuring range, set your engineering units and scaling, and more. This dialog automatically adapts to the input amplifier on this channel. A strain gauge amplifier has settings different from those of a thermocouple or accelerometer. The Setup screen changes automatically to fit. Because of the close connection between hardware and software, DSX knows which amplifier is on each channel. The screenshot above shows a typical voltage amplifier setup. The signal lines and even the connector pin-outs are displayed graphically.
Low-voltage input amplifiers can be ordered with typical 2-pin BNC, banana jack, or multi-pin connectors. Multi-pin connectors typically provide pins for sensor excitation and even TEDS interfacing for automated sensor identification. TEDS is fully supported by DSX software. DSX will show the correct pin-out diagram for your hardware.
Engineers like the “live” waveform display because it changes in real time based on the chosen range and settings. Linear scaling is also easy to configure, using either the by two-points or function (y = mx + b) method. Direct calibration to the live signal is also available for both DC (average) and AC (AC RMS) signals. DSX software can also handle non-linear scaling, such as table-based and polynomial methods. We will cover this in a future article.
NOTE: You can get detailed help anywhere in DSX by pressing F1 on your keyboard.
Counter inputs
Most Dewesoft systems have one or more SuperCounter® inputs. These inputs connect to RPM and tacho sensors, incremental encoders, quadrature encoders, and more. They can also be used for up/down event-counting operations, timing, pulse-width measurements, and more. Setting up these channels is easy and intuitive. Just click the Setup button for the counter that you want to configure.
Digital inputs
Dewesoft SuperCounters can be used as three discrete digital input lines if you prefer! Dedicated digital input (and output) hardware modules are available for all Dewesoft systems. Digital input lines are easy to configure because they have only two states: on and off. Digital inputs can also trigger recording start and stop. They can also be used within the math engine for various functions.
As with Analog inputs, click the Setup button on the right-most column to configure your Digital inputs.
Video input
High-speed synchronous cameras are available, but inexpensive DirectX web cameras are also available for less demanding applications. Webcams use software to sync within a few hundred milliseconds. In contrast, Dewesoft cameras are hardware synced with microsecond data alignment. They record video at higher speeds than ordinary webcams.


Video adds essential context to your data. Seeing what the test looked like helps you understand what the data means. When data is graphed, it’s easier to see trends and spot anomalies. Below is a replay of a relay test using a fast DS-CAM.


Connect one or more of our DS series industrial cameras for faster speeds and perfect synchronization. DS-CAM cameras offer high-speed video with up to 333 frames per second (fps) at full HD resolution. By lowering the resolution, you can achieve up to 600 fps. Using one of our CAM-BOX interfaces, systems with eight cameras, each running at 333 fps with full HD resolution, are possible.
NOTE: DewesoftX supports multiple types of video cameras:
DirectX cameras
DS-CAM synchronized cameras from Dewesoft
High-speed cameras from Photron®
Infra-red cameras from OPTRIS®
IP cameras from Dewesoft
OK, we have some channels set up and ready to record. We skipped over setting the sample rate and recording mode, but they will operate at default values for now. Let’s move on to the next step.
Flexible screen design
One of our first innovations was flexible screen design, and we keep improving it. You can drag and drop widgets onto the screen. These include recorder graphs, scopes, digital and analog meters, and FFT graphs. You can also resize and position them as you like. You can assign any channel(s) you want to them. Then, create another screen—and another if you wish. Everything is saved as part of the setup file.
The measure mode
Click Measure in the menu bar to show your screens. A default Recorder screen will appear. This screen has a prominent icon in the horizontal menu bar.
The left side of the screen shows the properties of the selected widget. Here’s where you can configure how it looks and how it behaves. For example, maybe you want the data to show as RMS or AVE instead of the peak-to-peak waveform. You can also control the gridlines and other visual aspects of the widget.


The right side of the screen shows the channel list. All channels you set to be used on the setup screen are shown here. Assigning them to be displayed in a widget is as easy as selecting the widget and then clicking the channel in the list.
NOTE:
The left side shows the properties of the selected widget
The right side shows the channel list
Channels are grouped by type, such as analog, digital, CAN BUS, etc. This keeps everything tidy and makes finding the channel you need fast and easy.
Display widgets
Clicking the + widgets icon pops up a list of them. You can display just your favorites or all of them at your option. If you want to add a new oscilloscope graph, click it from the widget list, and it will appear on the screen. DSX will automatically activate the design mode so you can move channels around, size them, assign channel(s) to them, and configure their settings. Done? Unclick the Design button, and you’re ready to go.


NOTE:
You can click inside the widgets to adjust real-time properties when you're not in design mode. For example, you can click on the center of a recorder graph channel’s name to auto-scale it on the amplitude axis. You can also click the high or low-scale values and type in whatever you want.
Any screens you have created for a particular setup are saved with that setup.
You can connect multiple displays to your system and show different screens on these monitors!
You can add and design screens even when you are recording data!
You can put a star next to your favorite widgets so that they will appear only on the Favorites subscreen. We have shown them all here so you can see what’s available.
Custom display screens – easier than ever to create and manage
Here’s an example of a custom screen that took only five minutes to create. Select your widgets, then point-and-click operations to size and move them into place, assign channels, and set their properties. The possibilities are unlimited. You may create as many screens as you like and design and name them freely.
NOTE:
Setups can contain many custom screens, not just one. You can add as many as you need.
Any combination of widgets can be used on any screen. Even the standard recorder screen can be completely customized.
You can create “subscreens” to organize them better and avoid filling the icon bar.
You can create screens designed to be printed reports, arranged against a white background and in portrait orientation for easy printing after a test.
Storing and triggering options
You can record continuously when necessary. Just click STORE, and the recording will begin. Many applications need triggering. We have made it easy to set up the system to record precisely what you want.
Storage modes
Unless you change it, DewesoftX will operate in the default storage mode, “always fast.” It will operate like a tape recorder, recording continuously at the selected dynamic sample rate.


If you want to trigger the system based on one or more signal levels, use the “fast on trigger” storage mode. When you do this, trigger setup controls will appear automatically. With these controls, you can define the conditions that will start the recording and those that will stop it. You can decide how to trigger when you choose a channel to start or stop triggering. You can trigger from the peak-to-peak signal, average, or RMS value. You can also choose to trigger on the positive or negative slope.
Trigger setup
You can also use relative time to start or stop recording. For example, you may want to start recording based on a signal level and record for three minutes before stopping—or an hour—whatever you prefer. Using absolute time to stop or start recording is also possible. For example, you can set up DewesoftX to record daily between 3:00 and 4:45 AM. The options are endless.


Multifile triggering and replay
Our unique “multifile” mode captures multiple trigger events to a single file for easy review. The screenshot below shows trigger #2 from a series of triggers. The highlighted data block shows this in the reply reference bar near the top of the screen. Click the arrows on the left side of the reference bar to step through the triggers. Click and drag to zoom in on any recorder graph to see exactly what you want. Right-click to un-zoom back as many steps as you like. Once you know these few basic things, reviewing your data is smooth and effortless.


You can export all the data or a selection to a wide range of file formats. You can send the report to an office printer or create a PDF file. If you want to modify the screen's appearance, you can do this freely using the same procedures as before the data was captured!
Fast on trigger, slow otherwise mode
This mode captures fast-triggered data exactly as shown on the previous page. But what about the data that passed between the triggers? Using the “fast on trigger, slow otherwise” mode, the data between the triggers is stored at a reduced rate. Since the rate is slower, we also capture the RMS, peak-to-peak, and average data values. This gives us a unique look at the data that we couldn’t capture at full speed. This saves disk space and reduces data review time.


More triggering tricks and tips
It’s often helpful to see what happened just before the trigger level was reached. You can enter the number of milliseconds you want to add to the beginning and end of a triggered recording. Simply enter the desired pre- and post-time values.
You can also enter a “Holdoff time” that prevents a re-trigger until a selectable number of milliseconds have elapsed since the previous trigger.
The Pre, Post, and Holdoff time fields are shown in the middle of the screenshot above.
DewesoftX provides a rich suite of triggering capabilities, all requested by the engineers and technicians who use our systems. Despite its power, triggering is graphical and easy to do.
NOTES:
The storing screen offers four powerful recording modes: “always fast” runs continuously at the dynamic sample rate, “always slow” runs at a reduced rate, “fast on trigger” only stores data when trigger conditions are met, and “fast on trigger, slow otherwise” stores fast triggered data and reduced data in between triggers.
“Fast on Trigger” captures triggered data sections at the dynamic sample rate.
“Fast on Trigger, Slow Otherwise” captures triggered data at the dynamic sample rate and reduced rate data between triggers.
Selecting either of the triggered data modes automatically reveals the trigger setup controls.
Notice that when you set up a trigger start or stop channel, you get a preview of that channel in a graph. The peak-to-peak, RMS, or average signal can be shown. This provides a “live” preview, including a vertical white line in the graph when the trigger conditions are met.
If you add multiple channels to either start (or stop) recording, they will act as an “or gate,” so any of them will start (or stop) recording.
Save and reload huge data files
Nothing would be more frustrating than recording a file that takes minutes or even hours to open. That never happens with DewesoftX. Normal-size files open in the blink of an eye, and even the largest ones open in just a few seconds. In the Analyze mode, DewesoftX displays all the data files you’ve captured. Clicking any of them shows essential information in the bottom half of the screen. This includes a list of the channels, the storage mode, the sample rate used, and more.
Ready to review the data? Double-click the file name, and it will reload instantly. The screens you designed will also reload.


Quick reload
Even gigabyte-sized files open up in less than one second, like the 10 GB file below. The recorder graphs show the entire data set when opening a file. Want to zoom in? Click on the graph, drag to the right, then release. This positions the vertical cursors at the beginning and end of where you want to zoom in. Now, click once between the cursors, and this area will instantly be zoomed between the cursors. Not enough? Click, drag, and zoom to do it again. And again. There is no limit. If you went too far, simply right-click between the cursors to step back once or as many times as needed.

Fast post-processing
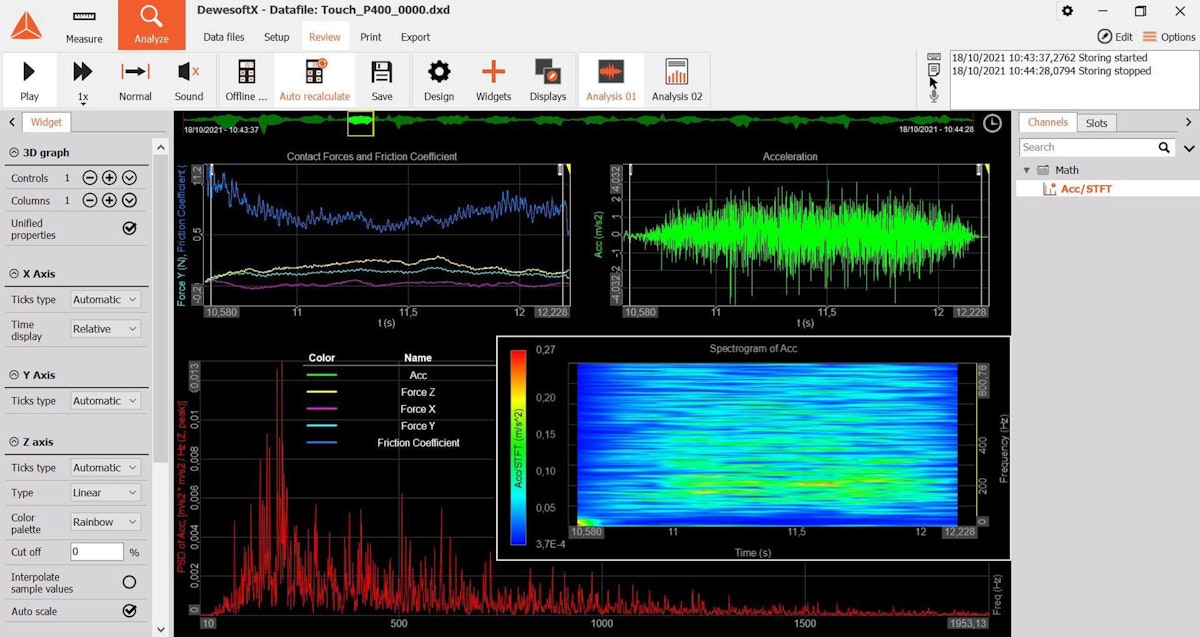
Remember those math channels that you set up before recording? After recording, you can also create or edit existing math channels in the Analyze mode. When you edit an existing math function, DewesoftX recalculates the data. Or, when you make a new math channel, DewesoftX will crunch the numbers for you.
In the Analyze mode, the recorder graphs have cursors that allow you to zoom in and out. The cursors also show the measured values where they intersect with the data. Notice the yellow cursor at the top of the screen and in the time-history graphs during replay. You can grab this cursor and move it through the data. All channels, including video and GPS displays, are synchronized to it.
Exporting your data
DewesoftX provides easy data exporting to a wide variety of data formats, and the list keeps growing. Excel®, FlexPro®, and MatLab® are popular, but many other formats are available. You can export all of the data or just a selection.


Review and analyze your data on any computer
Some computer-based DAQ systems need you to use the system to analyze data. Others require you to buy costly software licenses to run the software on a different computer. We don’t think that’s fair. You can run DewesoftX without any license on any Windows® computer. So you can sit in your nice office chair in front of a big monitor and use all of the features of DewesoftX’s Analyze mode.
NOTE: Some of DewesoftX's most popular features are its quick data reload and nearly instantaneous zooming and un-zooming. Scientists, engineers, and technicians worldwide rely on this powerful combination of capabilities daily.
Create math channels
Math functions are great, but you shouldn’t need a doctorate to use them. DewesoftX makes it easy to create a wide range of powerful math functions and apply them to your data.
Adding math functions
Clicking the Add Math button will reveal a whole suite of pre-defined math functions. You can even define which ones will be shown on the main math screen by checking them as “favorites” here so that you don’t have to search through the list next time. These functions are grouped according to type, such as:
Formulas and Scripting,
Filtering,
Statistics,
Reference Curves,
Time Domain Analysis,
Frequency Domain Analysis,
Machinery Diagnostics,
Acoustics,
Strain/Stress,
etc.


Graphical formula editor
You can build your formula by clicking the operators and functions shown below. Notice the wide range of functions in the tabbed section. These include basic math, trigonometry, Boolean logic, arrays, signals, and measuring functions.


Filter creator
Several kinds of filters are included, including FIR and IIR. Pick the type, select your channel(s), and make a few other choices, and it’s created for you. It is important to note that your raw channel is not affected. Filters become a new channel recorded in parallel with your raw channel. You can change filter settings after recording, and DewesoftX will recalculate that channel accordingly.


Automatic calculation of basic statistics
DewesoftX can extract more meaning from your data, like the RMS, min, max, crest factor, etc. Just checkmark the ones you want for any or all of your input channels.


NOTE: You can apply math functions before or after you record your data.
Advanced signal processing modules
Some advanced software plugins manage specific measurement applications. These include:
Rotating machinery analysis: Features like order tracking, torsional vibration, balancing, orbit analysis, and classic vibration analysis such as FFT.
Structural dynamics: In this domain, we cover modal test and analysis, fatigue analysis, and sine processing.
Electrical power and power quality analysis. These modules cover electrical tests, where you can calculate hundreds of power, energy, and harmonics parameters and perform efficiency and loss mapping of electric motors and inverters.
Acoustics analysis: These modules cover several noise analysis techniques such as Class 1 sound level meter, sound power, and sound intensity analysis.
Combustion analysis: This module analyzes the combustion process within internal combustion engines of all types. You may combine it with the electrical power analysis and motor analysis modules to perform a complete analysis of hybrid engines.
And others.
![]()
Conclusion
DewesoftX is known for being easy to use and offering great value. It is a smart choice for data acquisition and analysis professionals. Its intuitive user interface allows engineers to set up measurements quickly without extensive training, saving time and resources. The software supports seamless integration with various hardware and sensors, offering unmatched flexibility across the automotive, aerospace, and energy industries. DewesoftX has strong built-in tools for data visualization and analysis. This means you don’t need extra software. It helps cut costs and makes workflows easier.
Remarkably, DewesoftX software is included with all Dewesoft instruments at no cost, and updates are free. No software subscription or maintenance fees are required. Regular updates and strong customer support help ensure long-term reliability, making DewesoftX a key tool for accurate and efficient data collection.