


Impact Attenuator Assembly Testing and Model Validation on Formula SAE Race Car
Matteo Pippa and Davide Zanchetta
Race UP team, University of Padua
October 21, 2024
According to regulations, all Formula SAE race cars must have an impact attenuator assembly in front of the chassis. This assembly is designed to protect the driver’s legs during a frontal impact. It consists of an Impact Attenuator (IA) and an Anti-Intrusion Plate (AIP). In the design phase, students at the University of Padua use a mathematical model to verify compliance with regulations. The Race UP team validated their model through a drop tower test campaign, during which, thanks to the Dewesoft support, they detected the accelerations suffered and the assembly damage.
Formula SAE, a prestigious competition that originated in 1981, attracts university students worldwide. The students design and construct single-seaters from scratch, showcasing their skills and knowledge. Top experts in the automotive industry evaluate the final rankings, assessing design, cost management, and creating an economically sustainable production model (Static Events).
As a result, the competition requires diverse skills that span various disciplinary fields, including engineering, design, project management, and cost analysis. It represents an excellent launching pad into the workforce for students from multiple faculties. The cars' performance in track races, called Dynamic Events, is a key factor in the rankings. These events test the cars' longitudinal, lateral, overall performance, and reliability.
Prof. Giovanni Meneghetti introduced the competition at the University of Padua in 2003. The Race UP team initially participated only in the Combustion category, which focused on vehicles with internal combustion engines. In 2016, they began developing a fully electric single-seater in parallel. The latter, in the 2023 season, participated in Formula ATA and FS East, achieving the following results:
1st place in Cost at Formula ATA
3rd place in Acceleration at Formula ATA
4th place overall at Formula ATA
8th place overall at FS East


SGe-06 - the electric prototype
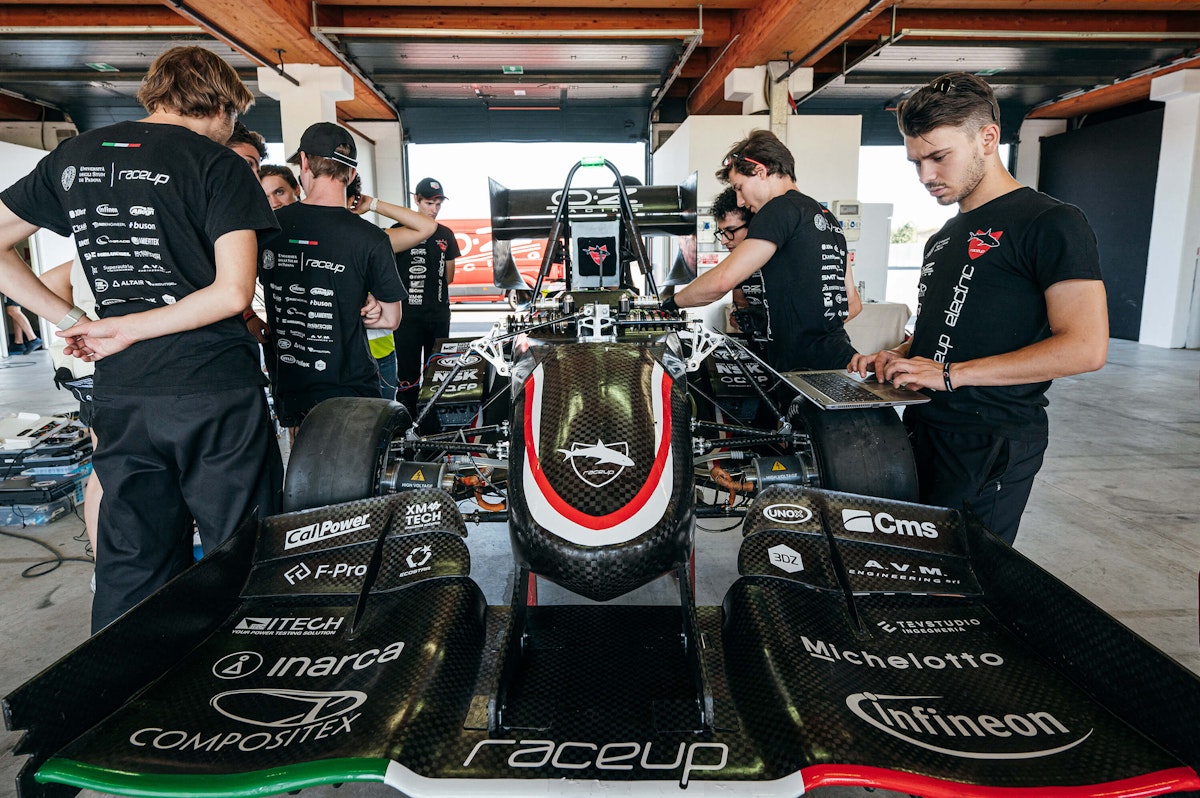
The Race Up race car, SGe-06, is the sixth electric prototype of the University of Padua. The Electric division developed it during the 2022-2023 academic year.
The car uses four electric motors and a carbon fiber body to ensure solidity, lightness, and instant power released to the ground.
We revised the aerodynamic elements of the previous prototype to ensure greater downforce. Additionally, we updated the steering wheel’s graphic interfaces to help the driver monitor all the important driving values. We have improved the telemetry system to transmit the data to the pits, where it is analyzed live.
It is the first electric prototype of the Padua team to finish the Endurance test. It allowed us to rank as the number one Italian team at the FS EAST event at Hungaroring.
Race Car SG e-06 Facts


| Specification | Detail |
|---|---|
| Weight | 208 Kg |
| Suspension | Push-Rod Suspension |
| Wheels | OZ 10" rims |
| Engine | Four synchronous motors of 35 kW |
| Structure | Carbon fiber monocoque, 19.8 Kg |
| Downforce (Max. speed) | 560N, 15 m/s |
The monocoque
The electric SGe-06 has a characteristic carbon fiber monocoque with a sandwich panel structure that forms the car's chassis. Composite materials are highly developed in the automotive racing sector thanks to their excellent lightweight and rigidity performance.
The impact attenuator assembly is a fundamental part of the chassis, which the team designed and developed. The Formula SAE racing competition requires an impact attenuator attached to the race car’s front. Its function is to absorb most of the car’s kinetic energy through progressive crushing in the event of a frontal crash.
Teams must physically test custom designs to show that the attenuator absorbs at least 7350 Joules energy. A 300 kg vehicle impacting a solid impact barrier with a 7.0 meters/second velocity should decelerate at less than 20 g’s average and 40g’s peak.


SAE Impact Attenuator rules
We conducted a crash test to validate our design and compliance with regulations. In particular, the Formula SAE rules concerning position and attachment include the following points:
The Impact Attenuator must be in front of the monocoque, with a minimum section of 100 mm in height, 200 mm in width, and 200 mm in length relative to the chassis.
The IA must have a maximum ground clearance of 350 mm, a closed frontal section, and must not penetrate inside the chassis upon impact.
The IA must be securely and directly attached to the Anti-Intrusion Plate (AIP) and have a less extensive section than the AIP itself—the attachment between the IA and AIP must have bolts or adhesives capable of withstanding specific loads.
The AIP must be directly attached to the monocoque and not extend beyond the front part of this. The attachment between the AIP and monocoque can be bolted, glued, or welded.

The AI assembly
In recent years, as the Race UP Team Electric, we have developed an IA Assembly that is entirely our own design. After several design iterations, we created the assembly using only carbon fiber, making it incredibly lightweight while maintaining high efficiency for its intended function.
Our AIP is a simple panel characterized by 14 plies of GG 200 P X1 120 T300 and GG 200 P WS T700, two different types of carbon fiber fabric.
Our IA features a truncated pyramid geometry, entirely laminated with six plies of varying GG 200 P WS 100 T700 heights.
")
")

For the attachment between the IA and AIP, we used an impact-resistant and high-temperature-resistant epoxy resin adhesive called Ergo 7440. This adhesive was applied between the surface of the IA flange and the base of the AIP.
After manufacturing the component, we must perform an IA Assembly test for validation. In particular, according to the regulations, the test must simulate the mass of a 300 kg car impacting a non-yielding solid barrier at seven m/s, respecting the following requirements:
Vehicle deceleration must not exceed 20 g on average and at a peak of 40 g.
The absorbed energy must be ≥7350 J.
To simulate this test, a drop tower test can be conducted by dropping a mass of at least 300 kg. In our case, we used a 306 kg mass. The height is adjusted to achieve the required velocity, absorbed energy, and the desired peak and average deceleration.
Regarding the IA Assembly during the test:
IA must be attached to the AIP using the chosen method - in our case, adhesive bonding.
The entire IA Assembly must be attached to a test fixture - similar to a stool, which simulates the final part of the monocoque, as shown in Figure 4.
In this way, the test also simulates the IA Assembly's attachment method to the monocoque and the behavior that the last portion of the monocoque would undergo upon impact.


Measurement instruments
To acquire data regarding the drop tower, we applied an IEPE accelerometer PCB Y356A16 and adequately fixed it to the end of the mass that we dropped onto the IA Assembly.


We configured and wired the connectors as required by the acquisition interface Dewesoft provided, the SIRIUS-HD-16xLV, which allowed us to acquire data from the accelerometer.

While configuring the interface and the accelerometer, we also set up the Dewesoft DS-CAM-1100m GigE camera. This ensured synchronization between the camera frames during the component's breakage and the real-time data captured by the accelerometer. This device was necessary for verifying a finite element model that simulates the crash to validate the design choices of the Impact.
For data acquisition during the crash test, we used Dewesoft's instrumentation and their DewesoftX software. This setup allowed us to define the acquisition trigger with the camera and ensure detailed post-processing of the results. In this manner, we compared the timeline captured by the camera and the numerical model simulation performed using RADIOSS, commercial software from the Altair HyperWorks suite. The data acquired from the accelerometer was then imported into Matlab as a vector to generate the required graphs using a script developed by the RaceUp Team.

Data acquisition
The test took place on February 24, 2024, at the OZ Racing company in a dedicated space where the drop tower was located. The Dewesoft Italia provided all the measurement instruments. After positioning the accelerometer above the 306 kg mass, the drop tower test was conducted for data acquisition and setting up all the Dewesoft instrumentation.
The camera, operating at 1000 Hz, required careful calibration and testing to check its light sensitivity and see if the carbon fiber structure reflected the surrounding light. After running several tests to ensure proper communication between sensors, we were ready to begin. Since we had only one chance to break the component and collect data, there was no opportunity to repeat the test.
Therefore, we initiated the data acquisition parameters and dropped the mass onto the IA Assembly after a few seconds.
Model
The model developed by the Race UP Team to predict the rupture of the IA Assembly, later confirmed by the drop tower test, is based on Mamalis's theory (1997). According to this theory, when the component breaks, the carbon fiber layers open like petals. As the material crumbles, debris builds up and forms a wedge that moves through the laminate's thickness, penetrating deeper where the carbon layers are weakest.


The dissipation mechanisms are multiple and classified into the following points:
Crack propagation
Petal bending
Splitting between petals
Bending damage in fibers where the bending moment is maximum
Friction for sliding between adjacent laminates
Friction for wedge penetration into the laminate
Among the various dissipation mechanisms, the two that absorb the most energy are the friction force between the wedge and the petals (T4 in Figure 9 on the right) and the pressing force (P4 in Figure. 11 on the right) that causes the bending fracture of the petals at the base.
To determine a critical condition where breakage occurs at the base of the petals, Navier's formula we used where the stress σ reaches the compressive rupture stress of the laminate.
Where represents the half-thickness of a petal, which itself has a thickness equal to half of the laminate, therefore:
J is the inertia of a petal with unit depth:
While the bending moment is equal to the pressing force acting at a distance , which in turn is equal to , therefore, we obtain:
Substituting into the first equation, we obtain:
We can calculate the friction force from , known as the coefficient of friction as:
At this point, the energy-absorbing force component is equal to the sum of the vertical elements of and , multiplied by two due to the symmetry of the problem and multiplied by the perimeter of the section :
where is usually equal to ; however, it can be used as a calibration parameter. is typically between 30° and 40°, while is between 0,55 and 0,65.
We applied this theory using a Matlab code that helps us predict how the IA Assembly will behave during the drop tower test. By entering details such as the number of carbon layers, the type of carbon, and the thickness of each layer, the script calculates the predicted length of the Impact Attenuator that won't be crushed. This allows us to optimize the design, ensuring that nearly the entire Impact Attenuator is crushed, while protecting the AIP and stool, as required by regulations.
In particular, we set up our IA sizing script to the following layup, which h indicates the height of the various sections of carbon skins. In this case, we only used one type of carbon, the T700. The section with height h6 has a zone with six carbon skins, the section with height h5 has five carbon skins, and so on. This setup indicates that the IA was sized with a thicker skin at the base of the component, making it locally more resistant to breakage. The sum of all sections equals the height of our Impact Attenuator (205 mm).


To be subsequently verified with experimental data, the output values we obtained are as follows. It's also worth noting that the estimated weight of the Impact Attenuator is 276 grams:
Crushed length: 183 mm
Weight: 276 grams
Specific energy absorption (SEA): 52 J/g
Non-crushed length: 22 mm
The theoretical model is evaluated and compared with experimental data obtained using the appropriate instrumentation during the drop tower test. Figure 11 presents the position of the IA Assembly just before the test. As mentioned, the accelerometer was placed above the dropped mass to collect the data.

Once we conducted the test, we collected the acquired data for analysis. See the IA Assembly in Figure 12.

In parallel, we developed a model to simulate the impact, providing a clear understanding of the choices made for the numerical modeling of the absorber. RADIOSS, a commercial software from the Altair HyperWorks suite, was chosen for numerical analysis. This software is a finite element solver specialized in explicit simulations of large and nonlinear displacements, such as automotive industry accidents and impacts.
We expect the condition to reproduce for the experimental test, where we mount the shock absorber on a base replicating the vehicle's monocoque in terms of stiffness. Therefore, if this support undergoes plastic deformations, the vehicle's monocoque will also undergo plastic deformations in the event of a crash. We must avoid these latter deformations, as they would invalidate the test and the design.
This work, resulting from a master's thesis, is divided as follows:
Definition and discretization of the geometry with four-node shell elements.
Definition of loads and constraints to be inserted into the free-falling mass and support structure model.
Definition of the material to explain how RADIOSS requires material parameters to be defined in the material card.
Definition of properties used for a laminate and a sandwich panel structure. The goal is to provide clear steps to reproduce the actual laminate in a CAE environment.
Definition of contacts.
Data analysis
At first glance, the results were very satisfactory, and the IA Assembly passed the test. The AIP and the stool underneath, simulating the monocoque, had no visible failures. The next phase is to analyze the accelerometer data using another Matlab script we developed. This script lets us obtain the acceleration and absorbed energy values with their graphs.
We analyzed the peak acceleration from the data we collected, which included thousands of data points recorded during the test. To focus on the moment of impact, we looked at time intervals where the acceleration ranged from 0g at the start of the impact to 0g when the mass reached the lowest point of the IA. This allowed us to isolate the crush event and produce the graph shown below.


The graph shows a maximum deceleration peak of 33,868 g and an average deceleration of 15,914 g. The obtained values fully reflect the regulations' requirements regarding the maximum deceleration that the component can undergo.
At this point, we can derive the values of absorbed energy, from which we can calculate the velocity attained by the falling mass just before the impact. The graph in Figure 14 shows the values of absorbed energy (Joule) plotted against displacement (mm) obtained from the acceleration parameters.


A peak absorbed energy of 7563 J was obtained at a displacement of 185 mm, once again complying with the regulations. Additionally, the presence of an elastic rebound of the component, characterized by the change in direction represented in the graph, can be observed. This change is because, besides absorbing energy, the IA Assembly also underwent an elastically returned deformation.
The final length of the IA affected by the crash is approximately 182 mm out of the entire component's 205 mm. Still, the displacement value of about 185 mm highlighted the presence of an elastic rebound.
The output values of the initial script fairly reflected the values obtained experimentally regarding the predicted non-crushed length. The position of the impact was measured by integrating the vertical acceleration twice.
From the total AI height of 205 mm, the graph showed a displacement of about 182 mm, leaving 23 mm of the height unaffected by the crash (this was also confirmed with calipers on the actual component after the test). The sizing script predicted a non-crushed length of 22 mm. To demonstrate this comparison, the graph below shows the displacements in both the theoretical and experimental models.


The graph in Figure 15 highlights the difference between the experimental and numerical curves. This variation can be attributed to human imperfections during the manufacturing process, especially in the fabrication and lamination of the component.
With the obtained value of absorbed energy, it was possible to calculate the velocity of the mass just before impacting the IA Assembly. This velocity corresponds to a free fall motion with total energy equal to the system's kinetic energy. Therefore:
The obtained velocity exceeds the minimum velocity the seven m/s test allowed. Therefore, we fully achieved all the minimum values required by the regulations. This result was possible because we lifted the mass to a height that allowed us to meet the requirements, and the IA Assembly was sized based on the requirements we had to meet. The experimental results also confirmed the theoretical model based on Mamalis's theory.
Below is a numerical-experimental comparison, reproduced frame by frame, showing the progressive damage of the absorber following the impact. We used the DS-CAM provided by Dewesoft for video acquisition, which allowed video capture at 1000 fps integrated into a single DAQ with the multi-axial accelerometer.
We used DewesoftX software to control the camera, setting the acquisition trigger and scanning one frame for every millisecond. Afterward, we carefully processed the results. This section aims to establish a direct comparison between the damage observed during the experiment and the predicted damage from the numerical model.
Figure 16 compares the numerical and experimental models, highlighting the layup variation points of the component, i.e., the various heights ranging from six plies to five plies.


We defined the color distinction appropriately to compare the advancement of the mass during impact. White lines were created at the same distance corresponding to the stiffness variation on the actual absorber, allowing for a correspondence between the numerical and experimental models.


The test snapshots show that in the early moments of contact between the mass and the absorber, the material undergoes plastic deformation, causing the sidewalls to bend inward. The first fractures in the composite appear around 7-8 milliseconds into the test, as the plastic deformation in the sidewalls leads to the collapse of the absorber.
Starting from 7-8 ms, we observed that the rupture occurs in the least rigid area of the corrugated structure, well before the indicated point on the absorber. The initial rupture involves only the absorber part composed of the first two composite layers. It is important to note that the damage begins around 7-8 ms and continues until the complete rupture of the first two composite layers, without involving other parts of the absorber until 12-13 ms.
Figures 19 and 20 show that the rupture at the end of the section with the first two layers matches the model closely. The rupture is similar to what was captured by the camera during the same experimental time window, between 12 and 13 milliseconds.


Conclusion
Thanks to the instrumentation provided by Dewesoft, we validated the sizing of a critical component in the vehicle's safety. The drop tower test gave us valuable data to compare with analytical and theoretical models. This comparison helped us identify the model's limitations, providing a foundation for future improvements. These refinements aim to enhance safety in the automotive industry.
The test and data analysis showed a strong similarity between the numerical and experimental models, indicating that we have reached a point of convergence in the component's design. The IA Assembly is now optimized in terms of both performance and weight, making further improvements difficult while still complying with regulations. This is evident from the minimal non-crushed length observed after the drop tower test.
For future developments, we could explore creating a "structural nose." This design would integrate the Impact Attenuator directly into the car's nose, which would also support the front wing. This approach is similar to what is used in Formula 1. With the help received from this year's test, it could be a good starting point for developing a new, faster, and safer car.