


Finite Element Model Validation by Experimental Modal Analysis
Bruna Di Dato (Structures Division member)
PoliTo Sailing Team, Department of Mechanical Engineering, Polytechnic University of Turin, Italy
October 12, 2023
At the Polytechnic University of Turin, a team of students is designing and constructing sailing boats. They select materials and dimension the structures of the prototypes through simulation software and testing sessions. Considering structural vibration, the students conducted an experimental modal analysis on a centerboard to validate a Finite Element Model. They have used Dewesoft data acquisition hardware and software for the comparison.
The PoliTo Sailing Team is a group of students at the Polytechnic University of Turin involved in the designing, constructing, and sailing of skiff (R3 class regulation) and Moth prototypes.
Skiffs are often called flat-bottom or center console boats, as they have a flat bottom, a pointed bow, and a square stern. The bottom of a skiff boat only dips a few inches into the water, making it highly maneuverable in shallow water.
The Moth is a small development class of sailing dinghy. Originally, it was a small, fast, and home-built sailing boat designed to plane. Since 2000, the Moth has become a largely commercially produced boat designed to hydroplane on foils.
The team’s main goal is practical training of future engineers: to design means to compromise between an idea and what can actually be built. In this view, the theoretical background is not enough. The sports team optimizes manufacturing processes, experiments with different sandwich combinations, and models hull and sail geometry.


We split our team into nine working divisions. The Structures Division is involved in designing all structural components of the boat, testing and choosing materials, and always having an eye on sustainability and innovation. We do structural dimensioning using Finite Element (FE) analysis. We aim to optimize resistance and weight while observing the behavior of the components when they are in action.
When a complex boat component is to be analyzed, we must find the balance between our will to build a mathematical model, an FE model, as detailed as possible, and the computational cost. We usually do this through appropriate approximations.
To have a FE model good enough, we needed material datasheets coherent with the manufacturing methods used. Next, we needed to validate the FE model to ensure its accuracy. One method to dynamically validate FE models is Modal Analysis; it compares the model’s first few vibration modes with Experimental Modal Analysis (EMA) data from the matching manufactured part.
Finite element model development
Within the Spaccaderive project, the object analyzed was a centerboard. In Italian, ‘Spaccaderive’ means centerboard breaking, to call back the bending test until failure.
This component is a hull appendage primarily used to provide lift to counter the lateral force from the sails. Sailors use the centerboard as a recovery platform upon which they can stand, providing increasing leverage in case the sailboat overturns via a capsize.
Because of the critical forces produced, such an event was considered the sizing case for the static Finite Element analysis. The FE models of a centerboard can have very different levels of complexity depending on the modeling technique used.
The model we compare to the experimental modal analysis data is quite detailed. We developed the model with an FE analysis software package provided by Altair, Hypermesh Optistruct.


The centerboard consists of two Carbon Fiber Reinforced Polymer (CFRP) shells bonded with MMA (Methyl-Methacrylate) structural adhesive. These shells we simulated using the PCOMPP property, suitable for composite, assigned to CQUAD4 elements. We modeled the carbon fiber using data from a composites testing campaign in 2021.
Once we finished the shells’ ply-up, we placed an internal overlap at the center board's leading edge, between the adhesive and the epoxy foam used as a core for the component. We modeled the overlap as we did the carbon fiber in the shells. The adhesive and epoxy foam we modeled as isotropic materials using CHEXA elements. The foam has a shear modulus G of 8 GPa.


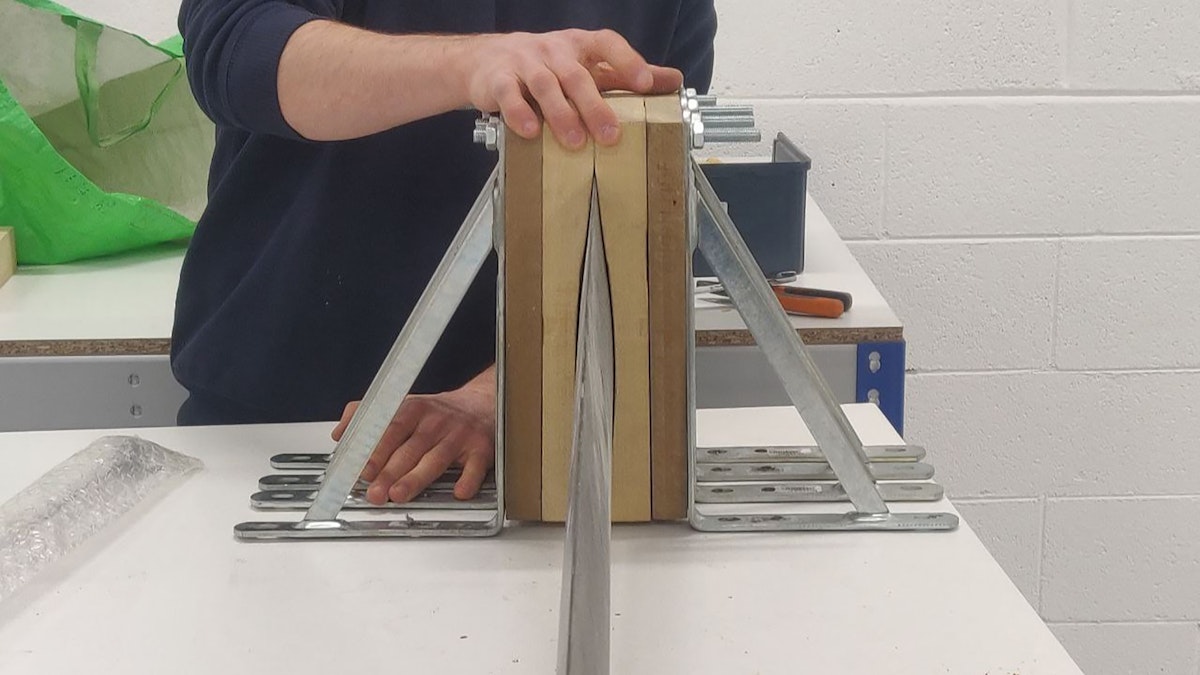
We also added the clamping system designed for the experimental modal analysis to the model considering the properties of the used material, the rivets, and the steel supports - shown in Figure 3. This system even represents the clamping conditions of the operating centreboard, i.e., all six degrees of freedom we fixed at the hub.
With these material parameters defined, we conducted a modal analysis of the centreboard within the Optistruct solver. The team calculated ten natural frequencies and the corresponding mode shapes from 0 Hz to 430 Hz.
Experimental modal analysis (EMA)
We performed the experimental modal analysis in a lab made available by the Polytechnic University of Turin. We clamped the structure and left a free length of 1515.43 mm. In Figure 4, it is possible to see the data acquisition system and the clamping system.


We located 25 points on the structure and consistently placed the accelerometer in one of them with a single-sensor approach. We afterwards used those points to create a simple but accurate two-dimensional model visualizing the acceleration of each modal shape point.
Using an impact hammer, we excited the centreboard with an impulse that exerted a forcing function normal to the centreboard plane of symmetry along the z-axis. Different hammer impulses were given in 24 points, equally distributed on the surface, exploiting the properties of the receptance matrix. The accelerometer fixed in node no.19 recorded the system’s vibrating responses.


The recorded modal data had a frequency resolution of 0.1 Hz and was the means of at least three repeated measurement runs. We made the assumptions of linear elastic behavior and point impact.
Elements of the set-up:
Centerboard and constraining system (6 DOFs fixed).
SIRIUS data acquisition system provided by Dewesoft (DAQ System).
INPUT: Dirac-like impulse using impact hammer. It has a force sensor measuring the amplitude and frequency content of the energy stimulus imparted to a test object. For each hit impulse, the magnitude is normalized on the same reference value to make the inputs in each point comparable.
OUTPUT: Acceleration on the z-axis, measured by an accelerometer at point 19 - see Figure 5.
Post-processing software provided by Dewesoft (DewesoftX).
Figure 6 reports the frequency response function (FRF) of the structure.


Comparison and validation of the finite element model
The FE model previously described is the result of some changes we applied. Due to an unsatisfactory outcome of the data comparison, we added the overlap and modified the epoxy foam modulus after evaluating its mechanical properties by an experimental bending test.
We correlated all the modes from numerical to experimental analysis. Using a specific DewesoftX widget, we transformed the FE model 3D mesh geometry into a wireframe model with 25 nodes aligned with the reference geometry. We didn’t find the correlation of the 8th mode from the FEA because none of the natural frequencies extracted from the experimental FRF data matched the mode shape searched.


Table 1 includes the natural frequencies of the mode shapes for both the numerical and the experimental analysis. The modes are labeled with a B, IP B, TB, and T, referring to whether they are Bending, In-Plane Bending, Torsional Bending, or Torsion.
The 4th mode, an in-plane bending mode, was not shown in the Frequency Response Function (FRF) because the accelerometer we used only measured acceleration in the z-direction.
In the experimental FRF, we had poorly separated natural frequencies, highly damped in the range of interest. We couldn’t find the correct correlation of the 6th natural frequency extracted from the FEA.
| Mode Shape | FEA [Hz] | EMA [Hz] | Difference [%] | |
|---|---|---|---|---|
| Mode 1 | B | 11.89 | 8.7 | 26.8 |
| Mode 2 | B | 62.78 | 48.1 | 23.4 |
| Mode 3 | T | 95.43 | 92.6 | 3.0 |
| Mode 4 | IP B | 98.17 | Not measured | - |
| Mode 5 | T | 147.69 | 117.4 | 20.5 |
| Mode 6 | TF | 242.73 | - | - |
| Mode 7 | T | 260.53 | 255.0 | 2.1 |
| Mode 8 | TF | 337.65 | - | - |
| Mode 9 | T | 399.05 | 401.0 | 0.5 |
| Mode 10 | TF | 427.98 | 473.9 | 10.7 |
| Mean | 12.4 |
Conclusion and next steps
While the frequencies estimated by the FEA for the torsional modes are similar to the ones of the EMA, the flexural modes are associated with higher relative errors. There is a positive trend in the difference in the percentage of bending and TB modes. I.e., the error decreases with frequency increase, but values in general are still high.
We will apply more methods for the modal parameter identification stage to verify the correspondence between the FE Model and EMA results. We will use the Modal Assurance Criterion (MAC) to indicate the degree of consistency of the mode shapes and learn of the modal switching phenomenon due to model inconsistency.
A Stabilization Diagram will help us distinguish between stable and unstable frequency poles. Though the post-processing is still not done, the reported results still lend some observations.
Both the FE model and the experimental modal analysis can be affected by some issues. Determination of the natural frequencies and mode shapes is reliable when the vibration modes considered have some degree of damping and their natural frequencies are distinct. Looking at the FRF data, it is clear that the band between 150 Hz and 300 Hz is not fit for the analysis.
It might be beneficial for me to repeat the experiment. Changing the input and, this time, using a shaker that provides a random signal, white noise, excitation, and then comparing the obtained FRF. The hypothesis of linear elastic behavior may not be suitable for the object of interest. Some non-linearity tests appear to support this presumption.
Moreover, the efficiency of the constraint system could have affected the validity of the experimental results. We aim to test its stability or repeat the EMA in a different configuration.
We might enhance the correlation between the FE model and the real object. We consider adjusting the material properties in alignment with the production methods and increasing the element count when discretizing the component.
Once again, this test was a reminder of the difficulty that hides behind collecting reliable data about a structure’s dynamic behavior. The PoliTo Sailing Team will continue to analyze better solutions and optimize the efficiency of our FE models. We will experimentally test the components and materials produced ourselves.
The PoliTo Sailing Team would like to thank Samuele Ardizio, Riccardo Petrei, and all the Dewesoft Italia Team who helped us. This test was possible thanks to their efficient technical support and the instruments provided. Big thanks also to Ing. Massimiliano Mattone, contact technician for PoliTo Labs, who always helps us when there is something to break scientifically.