


Experimental Modal Analysis on Robotic Martian Rover’s Wheel
Damiano Carra, Enrico Sabbatini, and Lorenzo Caraccio
Polytechnic University of Turin
September 16, 2024
Focusing on technology demonstrators for astronaut assistance on future planetary missions, the DIANA team pioneers advancements in space robotics. DIANA recently unveiled ARDITO, a modular space rover. ARDITO’s innovative design includes airless wheels tailored for the Martian environment, providing exceptional grip and stability. To ensure the durability and performance of these wheels, the team collaborated with Dewesoft for an Experimental Modal Analysis (EMA).
DIANA is a team of around 75 Politecnico di Torino students from different study courses and countries interested in space robotics. Since 2008, we have been aiming to advance space robotics applications at Politecnico di Torino, the Polytechnic University of Turin. We are developing and prototyping technology of space rovers for astronauts’ assistance and support in future manned missions on other planets. Intense collaboration with many companies around Piedmont, Italy, and internationally makes our work possible.
DIANA is active in numerous research fields and has shared multiple publications. During its 15 years of activity, DIANA developed and built four different rovers, the last one called ARDITO. ARDITO is a modular platform designed to support astronauts on planetary missions.


The European Rover Challenge is one of the most prestigious events in Europe and the world for space and robotics. Academic teams worldwide compete to present their rover designs on the most prominent artificial Martian track. Since 2018, we have competed in this competition with three different rovers, the latest being ARDITO.


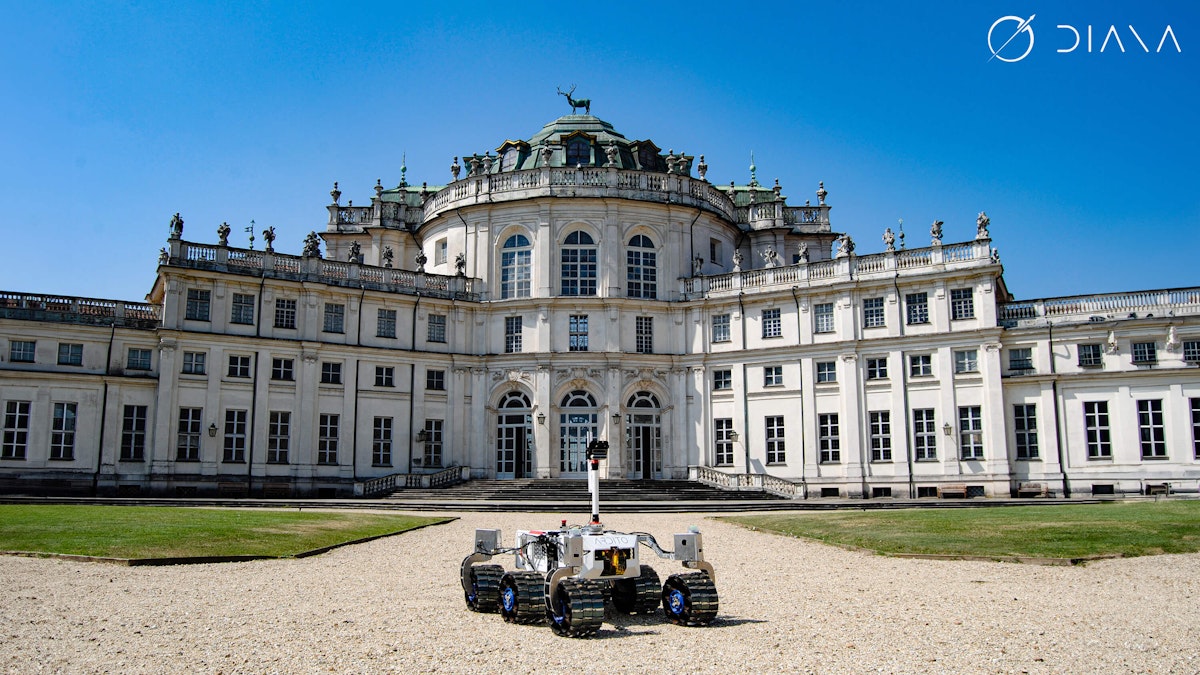
ARDITO - the Martian rover
ARDITO is Team DIANA's fourth rover, equipped with a robotic arm and a soil sampling system. It is built with cutting-edge technology to ensure maximum performance and efficiency and is fit to tackle challenging terrains and harsh environments.
The rover's arm allows it to manipulate and interact with objects, while its sampling system enables it to collect and analyze samples from sand and soil. With its advanced sensors and cameras, ARDITO can navigate the most challenging landscapes and gather valuable data for scientific research. This versatile and sturdy rover is a true asset to our exploration efforts.
Based on NASA’s patented rocker-bogie suspension mechanism, ARDITO’s locomotion system comprises six driving wheels, four of which can steer. The six-degrees-of-freedom arm, equipped with a sensorized claw, allows it to mount and manipulate scientific payloads. The system aims for autonomy through front-mounted stereo cameras and proprietary navigation algorithms.
ARDITO’s wheels
While effective on Earth, conventional pneumatic wheels are unsuitable for the challenging Martian environment. ARDITO has a unique solution - specially designed airless wheels to overcome this. These wheels provide exceptional grip and stability and serve as shock absorbers, making them ideal for the rugged Martian terrain.
Ensuring the longevity and performance of ARDITO's wheels is a top priority. Three flanges extend radially along the hub, preventing excessive deformation of the elastic components and ensuring long-lasting performance.
Given the elastic properties of the airless wheels, it is crucial to analyze their natural frequencies. This analysis, essential to prevent stress and vibrations from compromising the system’s integrity, was made possible through a fruitful collaboration with Dewesoft. Their expertise and instrumentation were instrumental in conducting an extensive Experimental Modal Analysis (EMA).


Experimental modal analysis
The initial phase only analyzes the hub for a thorough component characterization. The goal is to correlate the FEM model predictions with the EMA measurements. Therefore, this test campaign will allow us to relate the mathematical model with the real one and understand the range of its natural frequencies. This will help us determine if these frequencies can influence the hub’s elastic part, which is the subject of future studies.
The EMA setup
The EMA setup consists of the following components provided by Dewesoft:
Dewesoft SIRIUSie-8xUNI+: versatile data acquisition system that provides high-end signal conditioning amplifiers for almost any signal and sensor.
PCB 086C03: modal impact hammer.
PCB 356BA43: triaxial shock accelerometer, 0.5 mV/g, 10k g range, mechanically isolated.
DewesoftX data acquisition and analysis software with Modal Testing and Modal Analysis modules.
The Dewesoft Modal Testing option enables measuring transfer functions of mechanical structures with hammer or shaker excitation.
The Dewesoft Modal Analysis option automatically detects frequency response functions measured with the Dewesoft Modal Testing option.
During the initial test campaign, geometry restricted data acquisition to the hub’s three radial flanges. Due to the component’s complexity, fifty-six measurement points were strategically identified and distributed uniformly across the three flanges and the hub region that interfaces with the remainder of the ARDITO structure.
Using many accelerometers would have required a complex and time-consuming setup. To address this challenge, we leveraged the inherent property of modal analysis, known as "measurement reciprocity,"
This principle allowed for the placement of a single accelerometer at a fixed point on the structure. Subsequently, all fifty-six points were excited using the instrumented hammer while maintaining the accelerometer’s position. This strategy ensured the acquisition of a highly accurate modal model.
To further streamline the data analysis for subsequent investigations, we limited data collection to the z-axis. A preliminary FEM analysis showed that the most significant modal contributions from the flanges occurred along this axis. This information guided our decision.
Finally, we placed the hub on a polyurethane foam surface to simulate a free-free boundary condition. This placement eliminated any potential constraints introduced by the support structure, allowing for the accurate characterization of the hub’s natural frequencies.


Results
We correctly set up the DewesoftX software and excited all the points using the instrumented hammer. Each point was hit a sufficient number of times to avoid errors. As a result, we obtained all the necessary data and the summary Mode Indicator Function (MIF) graph for the entire acquisition. Upon examining the MIF graph, it became evident that many resonance peaks are distributed in clusters across the whole range analyzed.
 plot.")
This observation suggests it would be easier for us to initially focus on the frequency ranges of 500-800 Hz and 1000-1500 Hz. These two ranges stand out as distinct groups compared to the others. We could also consider the frequencies above 4 kHz, but we excluded them from the study due to their high values and lack of relevance to the study.


Modal shape identification
We used the "Modal Analysis" module in DewesoftX to find the modal shapes within the 500-800 Hz and 1000-1500 Hz frequency ranges. This tool helped us identify which peaks in the MIF graph were modes of the hub’s wheels.
Range 500-800 Hz
While the MIF graph reveals several peaks within this frequency range, only one mode is identified at 626.11 Hz.


Range 1000-1500 Hz
The second frequency range exhibits a more significant number of modes occurring at the following frequencies:
|
1213,57 |
1245,43 |
1268,23 |
1291,39 |
1313,26 |
|
|
1336,77 |
1350,21 |
1359,49 |
1378,67 |


FEM analysis
FEM analysis provided a more significant number of modes compared to those identified by EMA. It is reasonable to assume that the lower number of modes obtained from the experimental test is due to the restriction of data collection to the z-axis. The FEM analysis gives a series of modes at the following frequencies:
|
616,15 |
616,53 |
1203,2 |
1204,2 |
1210,9 |
1214 |
|
1214,9 |
1215 |
1216,6 |
1238,4 |
1239,2 |
1240,9 |
|
1245,8 |
1249 |
1250,5 |
1261,5 |
1262 |
1263,1 |
|
1264,4 |
1266,4 |
1271,4 |
1305,6 |
1306,8 |
1331,8 |
|
1333,6 |
1350,8 |
1352 |
1376,1 |
Preliminary analysis
A valuable initial step in comparing modal shapes involves matching the modes based on their frequency proximity. To achieve this, we used an Excel spreadsheet to arrange the modal frequencies obtained from EMA in the first row of the table and those obtained from FEM in the first column. This operation identifies which FEM modal frequencies most closely align with those obtained from EMA, calculating the percentage error between the matched pairs.


Upon preliminary examination, we observed that the modal shapes obtained from EMA match some of the ones derived from the FEM analysis with excellent accuracy. The final step of this preliminary analysis involved the creation of a graph by plotting several points equal to the number of obtained modal-shape pairs.
The size of each point qualitatively represents the percentage error between the two frequencies in a pair. Following this, we will perform a first-order linear regression, obtaining a line in blue on the corresponding graph in Figure 13.


The resulting line exhibits a slope close to 45°, indicating that the mathematical model accurately represents the original model. Additionally, the dispersion of the mode pairs is minimal, suggesting a good overall quality in the execution of the modal analysis.
Conclusion
Experimental Modal Analysis (EMA) is crucial for understanding the wheels' natural frequencies, thereby preventing stress and vibrations that could compromise the rover's integrity. By meticulously correlating FEM model predictions with EMA measurements, we have gained invaluable insights into the wheels’ natural frequencies and modal shapes.
This thorough understanding is crucial for ensuring the rover's long-term durability and performance on challenging terrains. The collaboration with Dewesoft has provided the tools and expertise to achieve precise and reliable results.
The analysis is the first step toward deeply understanding ARDITO and its behavior. However, we still need further studies in modal correlation to understand the wheels' behavior better. Such studies will also improve our ability to represent the component through mathematical models.
Thanks
DIANA thanks Riccardo Petrei, Samuele Ardizio, and the Dewesoft team for their professionalism and dedication. Their efforts were instrumental in understanding DIANA’s needs and providing exceptional assistance. We look forward to collaborating again in the future.