Table of contents
Browse categories
Browse authors
 AB
ABAlberto Boffi
 AL
ALAlessia Longo
 AH
AHAl Hoge
 AB
ABAljaž Blažun
 BJ
BJBernard Jerman
 BČ
BČBojan Čontala
 CF
CFCarsten Frederiksen
 CS
CSCarsten Stjernfelt
 DC
DCDaniel Colmenares
 DF
DFDino Florjančič
 EB
EBEmanuele Burgognoni
 EK
EKEva Kalšek
 FB
FBFranck Beranger
 GR
GRGabriele Ribichini
Glacier Chen
 GS
GSGrant Maloy Smith
 HB
HBHelmut Behmüller
 IB
IBIza Burnik
 JO
JOJaka Ogorevc
 JR
JRJake Rosenthal
 JS
JSJernej Sirk
 JM
JMJohn Miller
 KM
KMKarla Yera Morales
 KD
KDKayla Day
 KS
KSKonrad Schweiger
Leslie Wang
 LS
LSLoïc Siret
 LJ
LJLuka Jerman
 MB
MBMarco Behmer
 MR
MRMarco Ribichini
 ML
MLMatic Lebar
 MS
MSMatjaž Strniša
 ME
MEMatthew Engquist
 ME
MEMichael Elmerick
 NP
NPNicolas Phan
 OM
OMOwen Maginity
 PF
PFPatrick Fu
 PR
PRPrimož Rome
 RM
RMRok Mesar
 RS
RSRupert Schwarz
 SA
SASamuele Ardizio
 SK
SKSimon Kodrič
 SG
SGSøren Linnet Gjelstrup
 TH
THThorsten Hartleb
 TV
TVTirin Varghese
 UK
UKUrban Kuhar
Valentino Pagliara
 VS
VSVid Selič
 WK
WKWill Kooiker
Experimental Modal Analysis of a Pedestrian Platform
Guillermo Fernández and Antolin Lorenzana
Structural Dynamics Group, Escuela de Ingenierías Industriales, University of Valladolid (UVa)
May 5, 2025
Understanding a structure’s dynamic behavior is the key to safer and more comfortable design. We performed experimental modal analysis (EMA) in a controlled laboratory to know how a pedestrian platform behaves under dynamic loads. We measured and analyzed the platform's response to dynamic loads. This testing helped us identify its natural frequencies, damping ratios, and vibration modes - crucial aspects in engineering design, failure detection, simulation, and finite element model (FE) calibration. EMA with Dewesoft provided valuable insights on improving real-world scenarios.
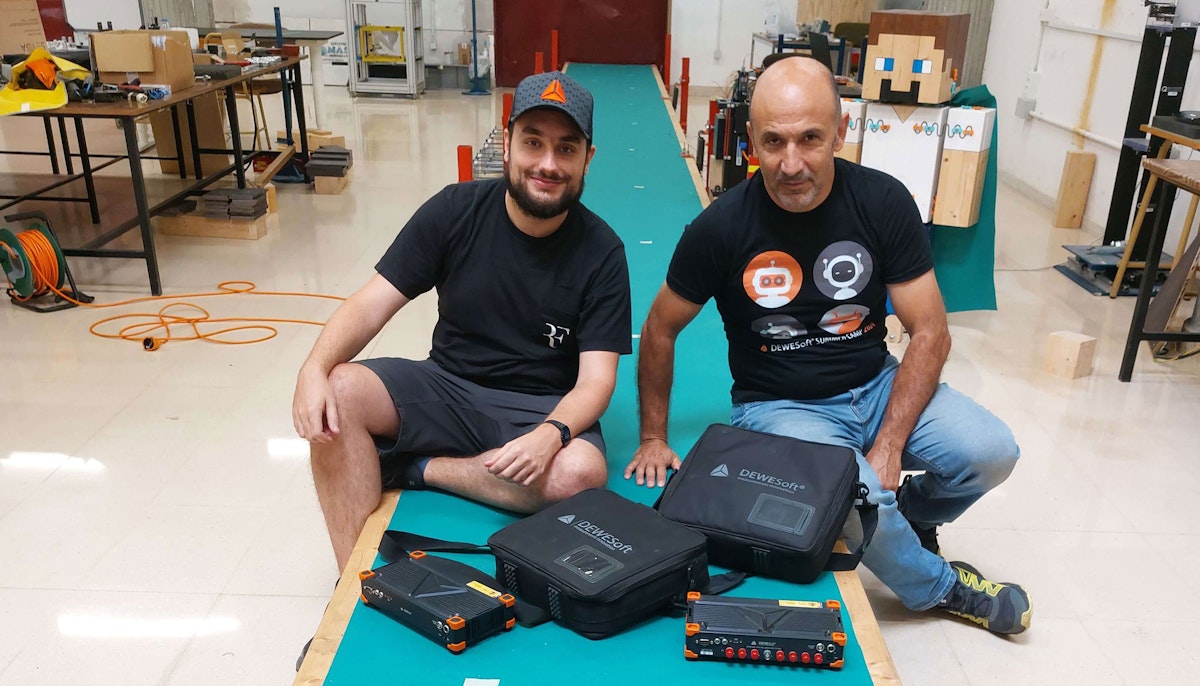
This study focuses on a slender platform demonstrator built at the Structural Dynamics Laboratory in Valladolid. We present the procedure to determine the platform’s response to shaker-generated dynamic loads. We use the experimental modular analysis (EMA) technique, employing sensors, Dewesoft Sirius data acquisition system (DAQ), and DewesoftX software. We illustrate the identification of natural frequencies, damping ratios, and vibration modes to enhance the stability and performance of similar structures in real-world environments.
The platform comprises ten laminated spruce wood beams chosen for their high strength-to-weight ratio and excellent damping properties. The beams have a nominal section of 100x140 mm² and a nominal length of 13.5 m, with slightly rounded longitudinal edges.
We drilled these beams, numbered from 0 to 9, with 13 holes of 12 mm diameter, equidistant and centered, with a spacing of 1.1125 m and a covering of 0.075 m at each end. The total width is 1 m, classifying the structure as slender as its nominal length is 13.5 times its width). See the general appearance of the demonstrator in Figure 1.
Threaded rods housed in the drilled holes hold the beams together. Along with two thick steel nuts, this achieves a simply supported configuration at the ends, separating the platform from the laminated spruce wood sleeper. This configuration, as shown in Figure 2, is crucial for the platform's stability and performance.
In addition to the fixed supports at the ends, the platform middle rests on tension springs. The springs are attached to the platform using a clamp fixed to the threaded rod using a nut. We mounted these elastic supports at specific sections on both edges. Considering the platform’s length (L = 13.5 m), springs are mounted at L/3, L/2, and 3L/4 from an end, as seen in Figure 3. We estimate the total platform’s weight to be 822 kg.
EMA setup and measurements
The demonstrator must be instrumented with the EMA technique to test its dynamic response. Regarding the support configuration (simple and elastic), we considered 16 points - eight at each lateral edge A and B, but only instrumented 14. A conceptual diagram of the platform is in Figure 4, where red points correspond to depicted supports, and the rest are free, meant just for future works and configurations.
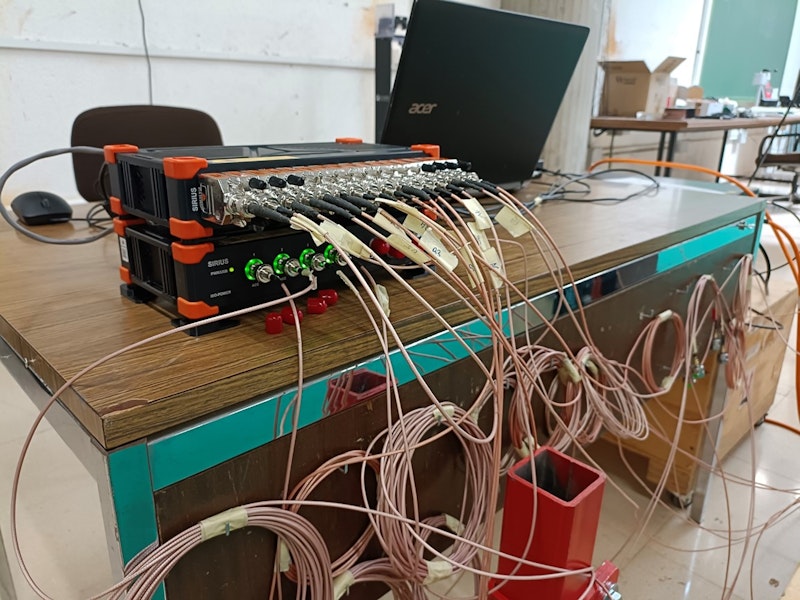
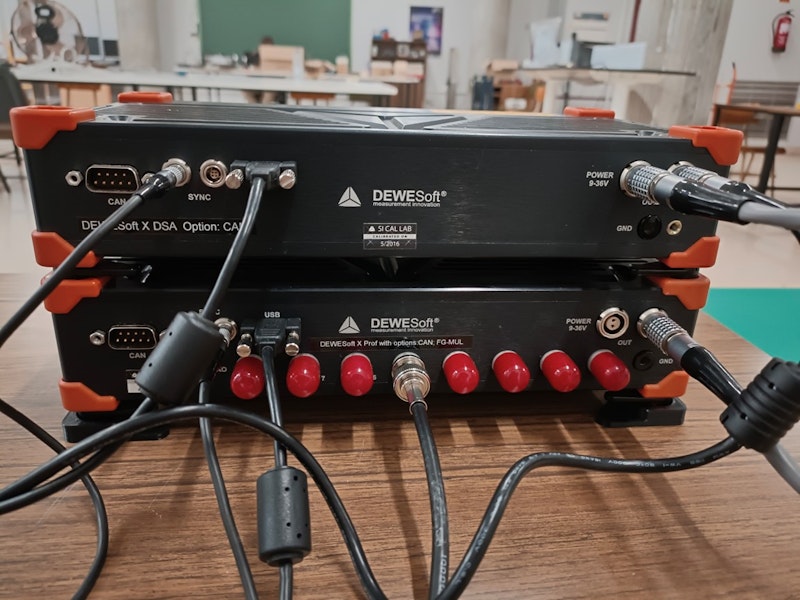
We needed a time-varying excitation force synced with dynamic response devices to test the structure using EMA. We mounted a shaker at position S in the diagram. Using permanent magnets, we attached ten piezoelectric accelerometers to the platform at the red points in the vertical direction. We also placed two accelerometers at the shaker. We put one on its fixed mass and the other on the moving mass that causes the dynamic excitation force - see Figure 6a.
Hardware and software used
Dewesoft SIRIUS data acquisition system - We used SIRIUS-HD-16x STGS for vibration measurement.
Electrodynamic Shaker – APS® Dynamics APS113
Piezoelectric accelerometers – All of them are MMF® KS76C.100 IEPE Accelerometers
Dewesoft DSI-ACC adapters
MATLAB® R2023a
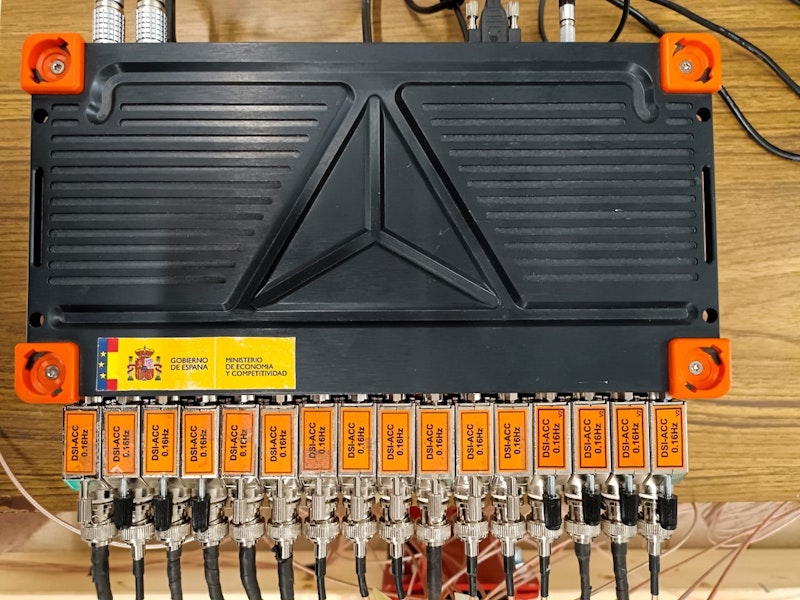
Magnetic sensor mounting is a widely used non-destructive technique where ferromagnetic materials are in place – as is the case of the supports and the shaker. Using analog input and output channels, we wired everything to two Dewesoft Sirius DAQ devices at the control demonstrator table – see Figures 5a and 5b.
A laptop with DewesoftX software is needed to establish a USB connection with the Sirus and perform the test.
We used Dewesoft DSI adapters with TEDS IEEE 1451.4. These can turn any DSUB9 universal analog input amplifiers into direct IEPE, charge, thermocouple, shunt, voltage, LVDT, or RTD input (see Figure 5c). Sensor adapters make measuring with the accelerometers possible.
Once we complete the instrumentation step, software configuration starts. EMA is possible with Dewesoft equipment since, at the lab, we have the software add-on Modal Testing in one of the Sirius devices. This setup allows the measuring and processing of experimental data gathered by the twelve accelerometers to compute the acceleration Frequency Response Functions (FRFs).
These frequency-domain functions provide a simple way of understanding the demonstrator’s response. These functions are a ratio between the response at the ten red instrumented points of Figure 4 and the excitation dynamic force provided by the shaker. We calculate one FRF for each red point, and the one that relates the response to the same point as in the shaker is called Driving Point Acceleration FRF (DPA).
Figure 8 shows our DewesoftX channel setup. We only used the twelve wired accelerometer channels with the same point notation as in Figure 4. Additionally, we used the shaker’s moving mass accelerometer to estimate the dynamic force since the moving mass is known (13.2 kg).
Multiplying the signal by the weight constant provides the software with the vertical force needed for FRF calculations (see Figure 8). Note that the function generator uses random white noise to produce dynamic forces in a good range of frequencies.
With all the hardware and software setup, we can carry out EMA. The SIRIUS DAQ system runs at a 400 Hz acquisition rate for this laboratory example. The Modal Testing software module makes the needed calculations from time-domain acceleration recorded data and the force excitation one to obtain FRF functions.
Once we have all the data averages - in this case, 14 - we achieve a frequency-domain experimental response. The response allows us to understand the platform’s dynamic response through its Natural Frequencies, Damping Ratios, and Vibration Mode shapes. We used a custom template in the software, including widgets like Recorder, 2D Graphs, Modal Circle, etc. See this DewesoftX Analyze Mode screen in Figure 10.
Main results
We developed this test as a working example of the EMA application, so we need to briefly describe several concepts apart from the main goals and methodology before indicating the main results and conclusions regarding the tested laboratory demonstrator. These are:
Natural Frequencies (f) - refers to the specific frequencies at which a structure vibrates when disturbed. These frequencies are intrinsic to the structure’s physical properties, such as its mass, stiffness, geometry, and boundary conditions. When a structure is excited at one of its Natural Frequencies, resonance occurs, leading to significant amplitude vibrations.
Vibration Modes (mode shapes) - describes the specific patterns of displacement a structure undergoes when vibrating at each Natural Frequency. Each mode corresponds to a unique frequency and represents a distinct way the structure can vibrate. These modes are fundamental in understanding how structures respond to dynamic loads.
Damping Ratios (𝛏). These ratios quantify the energy dissipation mechanisms within a structure, affecting how quickly vibrations diminish. Higher damping reduces the amplitude of vibrations and shortens the duration of oscillations, enhancing structural stability and comfort.
These parameters are critical in designing and analyzing structures to ensure their safety and performance under dynamic conditions. Considering this and establishing a frequency range analysis of 0 to 20 Hz in this particular example, three modes have been identified by carrying out EMA. Figure 10 indicates the natural frequencies at which the modes occur and their corresponding shapes. This representation is possible in DewesoftX, which previously in the Geometry Editor introduced the geometry specifications of Figure 4 with all the points:
You may find video animations of these mode shapes in the editor to obtain a more accurate virtual representation of vibration at natural frequencies. The first mode, which occurs at 2.60 Hz, is a pure bending one, whereas the other two, at 7.24 Hz and 15.11 Hz, present a mixed bending and torsion shape.
Slight torsion occurs at the longitudinal axis of the platform, parallel to the slender structure's first (length) dimension. A video of the excitation force and response at one of the elastic supports—from Figure 3—is also attached. Since displacements are small, a more general video of the vibrating platform during the EMA procedure would not have provided the desired displacement view.
After averaging the input signals from the sensors, we obtained 15 acceleration FRFs. Since the FRF is a complex function, magnitude and phase define it. Figure 14 is a simple detail of Figure 10. It presents only the magnitude (amplitude) of all FRFs in the same plot, the first 2D Graph widget.
This detail shows that the peaks occur at the structure's natural frequencies. The Y-axis scale is logarithmic and represents a linear magnitude – the ratios of response and excitation, m/s2/N, SI units for acceleration and force.
To provide a more specific and detailed view of the natural frequencies associated with the FRF peaks, we exported our stored data to a MATLAB® file. We plotted a selection of the two particular FRFs in Figure 15. The first blue line corresponds to Detector Package Assembly (DPA), the shaker’s position point response measurement. In contrast, the second red line relates the response measured at B6 point - see Figure 4 - with the excitation at S. Notation for the functions above is A, which typically represents Acceleration FRF in scientific texts.
Finally, DewesoftX can also be used to estimate the viscous damping ratios by applying different techniques. In this work, both 3 dB peak attenuation and modal circle fitting are presented and compared.
The first one is the easiest. It computes the dimensionless ratios (ξ) associated with each vibration mode by taking the frequencies at which the peak level attenuates 3 dB and then comparing its difference with the natural frequency. Figure 16 depicts this, while Table 1 indicates the estimated software values.
Damping Ratio Values: 3 dB Peak Attenuation
| Mode | Natural Frequency (Hz) | Damping Ratio (𝛏) |
|---|---|---|
| 1st | 2.60 | 0.00147 |
| 2nd | 7.24 | 0.00760 |
| 3rd | 15.11 | 0.00759 |
The results show what we expected from the previous FRF figures. We obtained a more significant damping ratio for 2nd and 3rd modes, meaning oscillations are damped quicker with a higher energy dissipation.
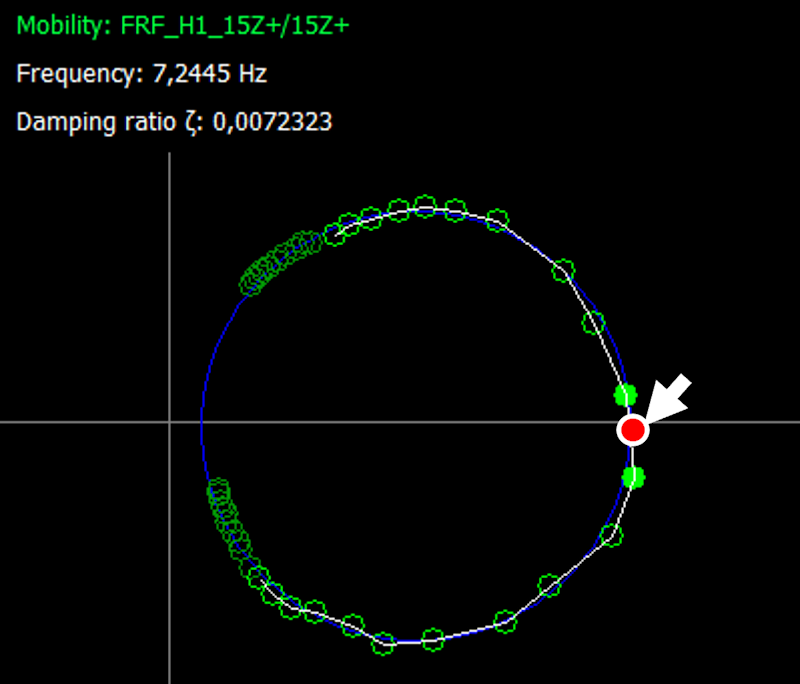
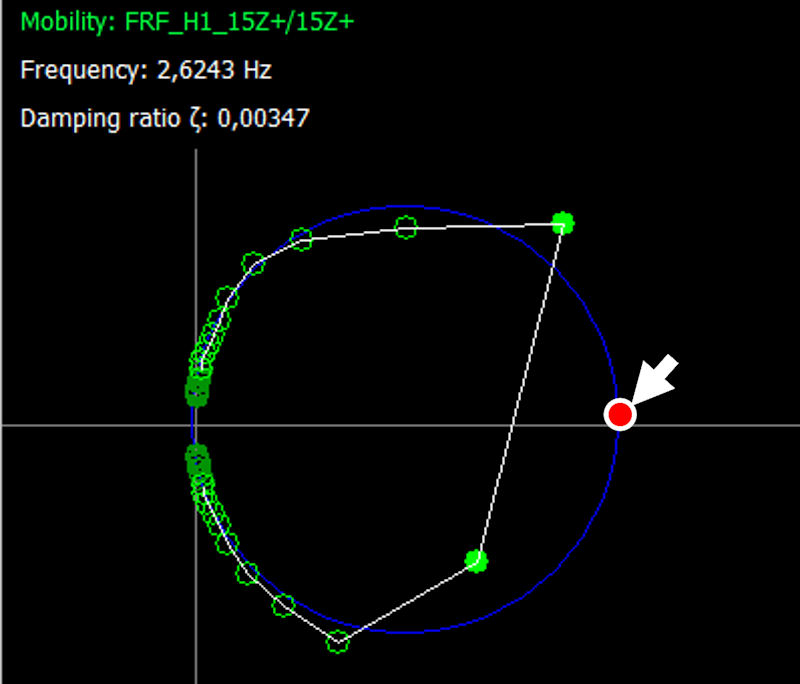
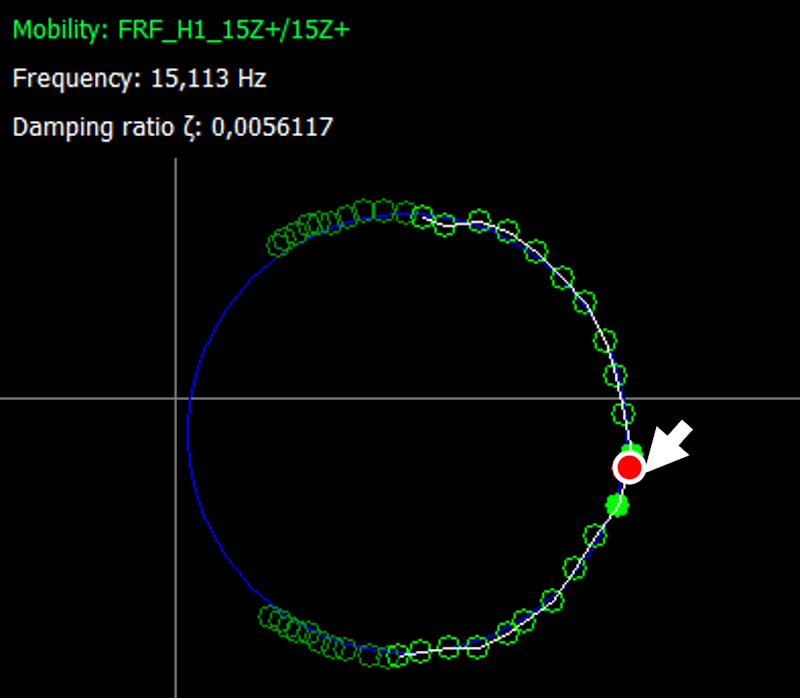
The second approximate method for computing these ratios is a Modal Circle Fitting. Here, a different FRF called Mobility, the vibration velocity ratio against excitation, is fitted to a circle with a specific number of points. Then, we estimate the corresponding values at the natural frequencies previously observed with Driving Point Mobility. Figure 17 visualizes these, and the values are in Table 2.
Damping Ratio values: Modal Circle Fitting
| Mode | Natural Frequency (Hz) | Damping Ratio (𝛏) |
|---|---|---|
| 1st | 2.60 | 0.00347 |
| 2nd | 7.24 | 0.00723 |
| 3rd | 15.11 | 0.00561 |
The 3 dB peak attenuation and Modal Circle Fitting methods both provide estimations of viscous Damping Ratios, but they yield slightly different results. The 3 dB peak attenuation method indicates higher or approximately equal Damping Ratios for the 2nd and 3rd modes - 0.00760 and 0.00759, respectively. In comparison, the Modal Circle Fitting method indicates 0.00723 and 0.00561, respectively. For the 1st mode, the 3 dB method estimates a lower damping ratio (0.00147) than the Modal Circle Fitting (0.00347).
These discrepancies highlight that both methods are estimative (and valuable) and may yield variations in Damping Ratio values due to different underlying computational approaches and assumptions.
Conclusions and related works
This example study successfully demonstrated the use of Experimental Modal Analysis (EMA) to evaluate the dynamic behavior of a pedestrian platform demonstrator in a controlled laboratory setting. We employed the Dewesoft SIRIUS DAQ system and DewesoftX software to identify the platform’s natural frequencies, vibration modes, and damping ratios, providing critical insights into its dynamic response.
The first mode at 2.60 Hz exhibits pure bending, while the higher modes in the frequency range analyzed combined bending and torsional characteristics (at 7.24 Hz and 15.11 Hz). These findings are crucial for enhancing pedestrian structures' design, safety, and comfort. The work underscores the importance of precise instrumentation and advanced experimental tools in structural dynamics.
Furthermore, the successful application of EMA techniques in this laboratory setting indicates its potential for broader implementation in real-world scenarios. Integrating these insights can lead to better-informed decisions in designing and maintaining pedestrian platforms. Ultimately, it can contribute to enhanced public safety and infrastructure reliability.
Acknowledgments
We wish to acknowledge the AEI, Spanish Government (10.13039/501100011033), and “ERDF - A way of making Europe” for support through the grant PID2022- 140117NB-I00. Guillermo Fernández also wishes to acknowledge the “Investigo Program CP23/174 – Financed by the EU, NextGenerationEU”.
References
Dewesoft, “What is Modal Analysis?”, May 2023. [Online]. Available at: https://dewesoft.com/blog/what-is-modal-analysis. [Accessed: May 27, 2024].
Avitabile, P. "Experimental modal analysis - A simple non-mathematical presentation," S V, vol. 35, pp. 20-31, 2001.
Sujatha, C. “Basics of Experimental Modal Analysis,” in: “Vibration, Acoustics, and Strain Measurement,” Springer Charm, 2023. https://doi.org/10.1007/978-3-031-03968-3_9