


Evaluating Energy Consumption of Electric Minibus

Vehicle Technology Assessment Laboratory (LETEV) at the National Autonomous University of Mexico (UNAM)
December 9, 2022
A publicly funded university project wished to evaluate the energy needed to run electric minibuses on various lines in Mexico City. This testing project required an autonomous real-time measurement system with a sample rate of up to 1MS/s capable of relating the bus position to voltage and power consumption data. Test drives have now been performed at different speeds and with various loads using Dewesoft data acquisition systems and sensors.
The Vehicle Technology Assessment Laboratory, LETEV (Laboratorio de Evaluación de Tecnologías Vehiculares) is a project of the Institute of Engineering of the National Autonomous University of Mexico (UNAM). The Ministry of Education, Science, Technology, and Innovation (SECTEI) of Mexico City is financing the project, which seeks, among other things, to determine the energy demand and driving range of vehicles with hybrid and electric powertrains under reel driving conditions in Mexico City.
For this purpose, field tests on commercial vehicles and prototypes were initiated. The tests had to integrate the data from a specific database of Mexico City driving cycles on lines of the urban transport system Metrobús.


Pilot tests on an electric minibus
During the first months of 2022, LETEV defined the need to implement and install a portable data acquisition system inside an electric minibus used by the "METROBÚS" transport system. As a result, the laboratory chose a SIRIUS-R2DB system as it has the necessary autonomy to perform this type of testing.
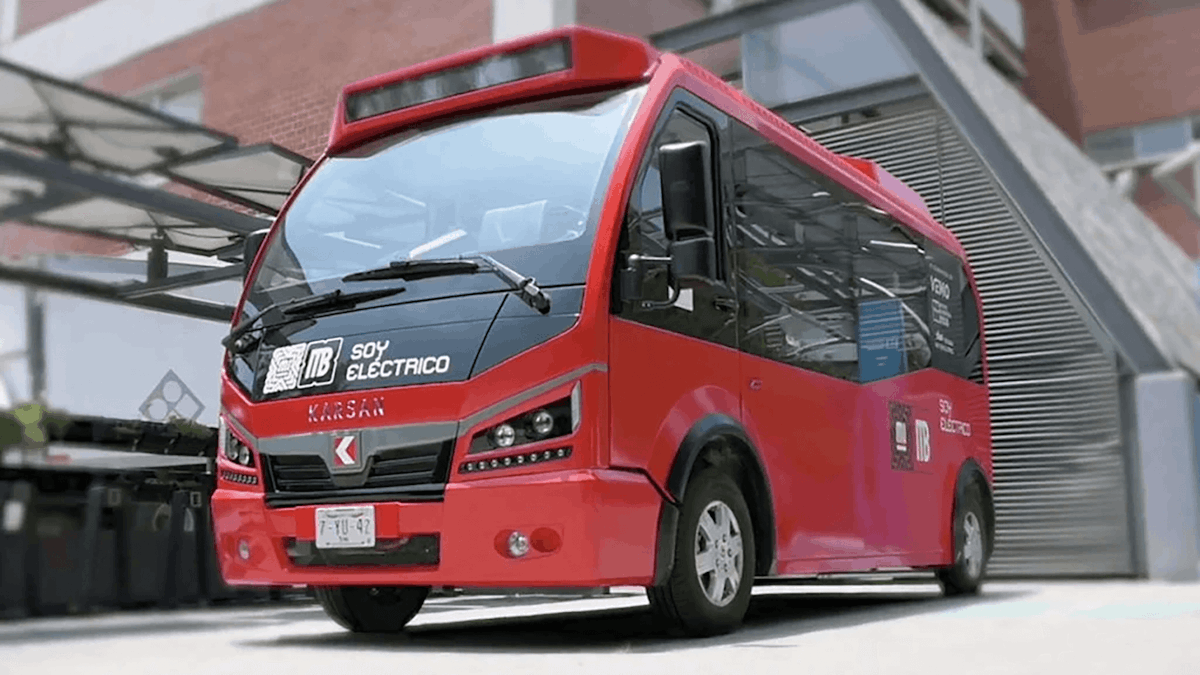
Voltage and current sensors combined with the signal from the "GPS" geo-positioning module were used inside the minibus to record instantaneous data of the variables associated with the vehicle's travels. A special emphasis was on measuring the voltage and current demanded by the battery bank. Figure 1 shows the electric vehicle - a mini- or microbus - on which LETEV did the testing.


Why Dewesoft?
A completely autonomous system that did not depend on a power line to work was essential to cover the testing needs. Another decisive factor resides in the capacity of said system to observe the graphs generated from the acquisition in real-time and have a sample rate of up to 1 MS/s. Finally, the system should have the capacity to obtain the position of the minibus and correlate it with the corresponding measurements of voltage and current consumed.
A SIRIUS-R2DB system with a SIRIUSir-HS8xLV card and a SIRIUS-HS-2xHV-2xSTG+-DUAL card fulfil such criteria. The SIRIUS-R2DB is a compact mobile data acquisition system with a built-in data logger, powerful data processing computer, touch screen, mouse, keyboard, and internal batteries for autonomous work. When needed, Dewesoft even supplies Li-ION battery packs for stand-alone, in-vehicle, or remote test and measurement applications.
Furthermore, LETEV used the Dewesoft Power Analysis solution to facilitate the analysis of the data obtained and to define the battery bank capacity concerning the minibus’ speed, distance, and load capacity. Such data can, among many other things, be useful for battery development - efficiency analysis, cell characterization, resistance tests, shock tests, short-circuit analysis, overheating/overload tests, ageing tests, etc. And even for monitoring applications (data logging, transient logging, charge and discharge analysis, etc.).
Many parameters can influence the energy consumption and driving range of electric vehicles. These parameters can be environmental parameters like temperature, weather conditions, road quality, different driving situations (uphill, downhill, city, dirt, or mixed drives), or different driving styles. Dewesoft's Power Analyzer allows energy analysis taking into account all these parameters during driving tests.
List of components used for measurement
SIRIUS-R2DB with a SIRIUSir-HS-8xLV card and a SIRIUS-AMP-2xHS-HV2xHS-STG+-DUAL card
DS-CLAMP-1800DC - Hall effect clamp meter
DS-GPS-SYNC-10Hz - 10 Hz GPS receiver/antenna with PPS and NMEA protocol
Characteristics of the minibus
The electric minibus used during the tours was of the Jest model from the Turkish company Karsan. The Jest gets its power from a 100% electric BMW motor offering high acceleration performance. BMW lithium-ion batteries and charging technology power the minibus.
| KARSAN JEST Electric Minibus Specifications | |
|---|---|
| Maximum Power | 135 kW |
| Maximum torque | 290 Nm |
| Battery | Li-ion 360V - 88 kWh |
| Maximum speed | 70 km/h |
| Length | 5.845 m |
| Wheelbase | 3.750 m |
| Weight | 5000 kg |
| Capacity | 22 passengers |
The Karsan electric minibus has ten fixed and two folding seats, as shown in Fig. 2. At maximum load, ten passengers are assumed to be standing.


The tests
The methodology used to prepare the tests was as follows:
Define the route(s) of interest.
Carry out at least three instrumented trips on the line(s) of interest for each load condition. The extreme cases - a journey without passengers and a journey with the vehicle’s maximum capacity - were evaluated.
Perform data processing and analysis.
Quantify the energy consumption of transport units.
Route 4 of the METROBÚS transportation system was selected to carry out the evaluation. The trajectory began at CETRAM Pantitlán, arriving at the Hidalgo station, located next to the central mall in Mexico City, and returning to the starting point. During the evaluation, the trajectory followed routes identified by the yellow line in the satellite view of Figure 3. The average distance travelled is estimated to be 19.3 km per section.


The characteristics of the tests carried out on the electric minibus can be seen in Table 2.
| Test | # of test repetitions | Characteristic of test |
|---|---|---|
| 1 | 3 | Vehicle with four passengers, without ballast and regenerative mode 1. |
| 2 | 3 | Vehicle with four passengers, with the ballast of approximately 1000 kg and regenerative mode 1. |
| 3 | 3 | Vehicle with four passengers, with the ballast of approximately 1000 kg and regenerative mode 2. |
Figure 4 shows the installation of the data acquisition equipment inside the electric vehicle, the current sensors were installed on the power lines of the battery bank and the instrument cluster of the vehicle


Six of the nine tests were done with static ballast, as mentioned in Table 2. Figure 5 shows the arrangement of the lead-acid batteries used for this purpose.


Figures 6, 7, and 8 are examples of instantaneous speed data collected during tests on the electric vehicle. The data were processed statistically to obtain a driving map of each trajectory and perform simulations of different vehicle configurations.


Additionally, Figures 9, 10, and 11 show the operating voltage of the electric minibus during trips in three different driving situations on line 4 of the MB transport system.


The results
LETEV carried out three different types of testing; In the first, the minibus was driven without a speed governor and with the minimum number of people necessary for the development of the tests (four passengers and the operator). In the second type of experiment, around 45 lead-acid batteries were used as static ballast; speed remained unrestricted. The third type of tour was carried out with the maximum speed of the electric minibus governed at 50 km/h.
Three tours were made for each proposed type of test; data was thus obtained on a total of nine drives on line 4 of the "METROBÚS" transportation system.
The graph of Figure 12 presents an example of the instantaneous power registered during the journeys on line 4 of the MB; the red line indicates when the electric motor demands power, while the green line represents the active moments of the regeneration system.


The average results obtained from the processing of the nine tests executed can be consulted in Table 3; the projected daily consumption was obtained by considering the distance equivalent to 14.23 journeys per day and the specific consumption registered in the vehicle.
| Duration in minutes | 84.33 |
| Daily operation time in hours | 20 |
| No. of tours per day | 14.23 |
| Specific consumption kWh/km | 0.33 |
| Mileage in km | 19.30 |
| Projected daily consumption in kWh | 91.76 |
| Usable energy in a battery bank in kWh | 79.2 |
| Difference in % | -16 |
Conclusions
Based on the experimental routes developed on line 4 of the "METROBÚS" transportation system in Mexico City, it can be mentioned that:
The evaluation tours had an average duration of 84.33 min.
The average distance travelled per trip is 19.3 km.
When considering a daily operating time of 20 hours, the projected consumption per unit is 91.76 kWh. Knowing that the usable energy of the battery bank is 79.2 kWh (90% of 88 kWh), it will be necessary to increase the autonomy of the selected vehicle to operate on the route of the transport system, or to establish adequate logistics to recharge the units during the operating periods.
To obtain a representative value of the autonomy of a vehicle, it is essential to obtain instantaneous values of speed, voltage, current, etc. Having a portable data acquisition system with easy configuration, such as Dewesoft's SIRIUS, facilitated the development of the experimental tests.
The data collected during the tours allowed obtaining a "drive cycle" characteristic of line 4 north of the CDMX "METROBÚS" transport system; this information was entered into the AVL CRUISE M simulation system, seeking to predict the energy consumption of larger units. The results obtained provided tools for a better selection of the electrical units that will be incorporated into the transportation system. Derived from this, it was possible to predict that the power demand required for larger units was less than that suggested by the manufacturer and, thus, achieving a considerable reduction in costs.
Future work
There is a continuous and rapid increase in electric vehicle (EV) adoption in many countries due to lower prices, government incentives, and subsidies; as well as the need for energy independence and environmental problems. Electric vehicles are expected to dominate the private car market in a few years.
These electric vehicles will charge their batteries from the mains and can cause serious effects if not handled properly. On the other hand, they could provide many benefits to the electricity grid and earn income for homeowners if managed properly.
In future stages of the operation of the " Laboratorio de Evaluación de Tecnologías vehiculares" (LETEV) project, will review the possible negative impacts of charging electric vehicles on electric power systems, mainly related to uncontrolled charging. The project will establish how those impacts can be reduced through controlled loading and unloading.
For this, Dewesoft data loggers and sensors will be used during field tests that allow quantifying:
the impacts of uncontrolled charging of electric vehicles on the increase in peak demand,
voltage deviation from acceptable limits,
phase imbalance due to single-phase chargers,
harmonic distortion, and
overload of power system equipment and increase in power losses.
Thanks to
The Secretaría de Educación, Ciencia, Tecnología e Innovación of Mexico City.
The transportation system of Mexico City "METROBÚS".
The collaborators of the Laboratory for the Evaluation of Vehicle Technologies "LETEV"